India Specialty Fertilizers Market Report: Trends, Growth and Forecast (2026-2032)
By Product Type (Water-Soluble Fertilizers (Water-Soluble NPK Fertilizers, Water-Soluble Straight Fertilizers, Specialty Water-Soluble Blends), Secondary Nutrient Fertilizers (Sulphur-based Fertilizers, Calcium-based Fertilizers, Magnesium-based Fertilizers), Micronutrient Fertilizers (Zinc Fertilizers, Boron Fertilizers, Chelated/Micronutrient Mixtures), Enhanced-Efficiency Fertilizers (Slow-Release Fertilizers, Controlled-Release Fertilizers, Stabilized Fertilizers), Customized Fertilizers (Area-Specific Grades, Crop-Specific Grades, Stage-Specific Grades), Fortified Fertilizers (Zinc-Fortified Grades, Boron-Fortified Grades, Multi-Fortified Grades), Nano Fertilizers (Nano Urea, Other Nano Nutrient Fertilizers)), By Form/Formulation (Crystalline/Powder, Granular, Liquid, Coated/Encapsulated, Chelated Formulations), By Application Method (Fertigation, Foliar Application, Soil Application, Localized/Precision Application), By Crop Type (Fruits & Vegetables, Cereals & Grains, Oilseeds & Pulses, Plantation & Commercial Crops, Turf & Ornamentals), By End User (Open-field Growers, Protected Cultivation/Greenhouse Growers, Nurseries, Plantation Growers, Hydroponic/Intensive Horticulture Users), By Distribution Channel (Retail Offline (Distributor/Dealer Network, Agri-input Retailers, Cooperatives), Retail Online (Online/Digital Agri-commerce), Direct/Institutional (Direct Institutional Sales)), By Region (North India (Punjab, Haryana, Uttar Pradesh), West India (Maharashtra, Gujarat), East India (West Bengal, Odisha), South India (Andhra Pradesh, Telangana, Karnataka, Tamil Nadu, Kerala), Central India (Madhya Pradesh, Chhattisgarh)) ... Read more
|
Major Players
|
India Specialty Fertilizers Market Statistics and Insights, 2026
- Market Size Statistics
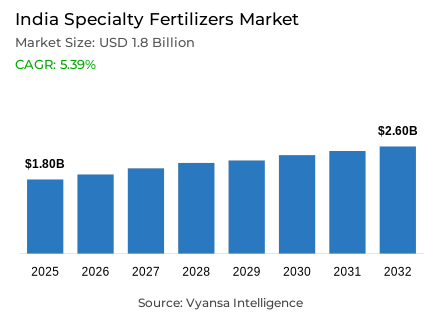
- Specialty fertilizers market size in India was valued at USD 1.8 billion in 2025 and is estimated at USD 2.2 billion in 2026.
- The market size is expected to grow to USD 2.6 billion by 2032.
- Market to register a CAGR of around 5.39% during 2026-32.
- Product Type Shares
- Water-soluble fertilizers grabbed market share of 40%.
- Competition
- More than 10 companies are actively engaged in producing specialty fertilizers in India.
- Top 5 companies acquired around 35% of the market share.
- Rashtriya Chemicals & Fertilizers Ltd. (RCF), Yara Fertilisers India Pvt. Ltd., ICL Fertilizers (India) Pvt. Ltd., Coromandel International Ltd., Indian Farmers Fertiliser Cooperative Ltd. (IFFCO) etc., are few of the top companies.
- Application Method
- Fertigation grabbed 45% of the market.
India Specialty Fertilizers Market Outlook
The India specialty fertilizer market size was valued at USD 1.8 billion in 2025 and is projected to grow from USD 2.2 billion in 2026 to USD 2.6 billion by 2032, exhibiting a CAGR of 5.39% during the forecast period. This double-digit growth is primarily fueled by the rapid expansion of high-value horticulture, which reached a record production of 3,707.38 lakh tonnes in 2024-25. As farmers pivot toward fruits, vegetables, and medicinal plants, the demand for targeted, crop-responsive nutrition solutions is becoming a critical driver for the industry's upward trajectory.
Efficiency-led product adoption is redefining the landscape, particularly as water-soluble fertilizers grabbed market share of 40%. These formulations are favored for their precision and compatibility with modern intensive farming, where granular nutrient control is essential for maximizing yield quality. While the India specialty fertilizer sector faces stiff competition from heavily subsidized conventional urea and DAP, the performance advantages of soluble nutrients are increasingly winning over growers who prioritize long-term ROI and molecular-level bioavailability over simple unit-cost comparisons.
The operational standard for nutrient delivery is shifting toward integrated systems, as fertigation grabbed 45% of the market. This dominance is intrinsically linked to the government’s "Per Drop More Crop" scheme, which has expanded micro-irrigation coverage to over 95 lakh hectares. The structural synergy between irrigation and an India specialty fertilizer allows for minimized nutrient loss and optimized root-zone absorption, making it the preferred method for commercial vegetable and fruit cultivation where uniform produce appearance directly dictates market value.
Looking toward 2032, the commercialization of nano-technology is set to accelerate the industry’s evolution, with cumulative sales already exceeding 1,593 lakh bottles of nano urea and DAP. Supported by the distribution of over 1,000 drones for precision spraying, these ultra-efficient formats are reducing conventional fertilizer consumption by up to 50%. As micro-irrigation infrastructure continues to deepen and soil health intelligence becomes more accessible, the India specialty fertilizer market is poised to capture significant value by bridging the gap between traditional bulk inputs and the future of high-tech, precision-driven agriculture.

India Specialty Fertilizers Market Growth DriverHigh-Value Crop Expansion Catalyzes Precision Nutrient Demand
The rapid growth of India's horticultural production capacity is the key structural force fueling the demand for specialty fertilizers. Developed after years of investing in agronomy best practices, horticulture now consists of an increasingly large and finely tuned agricultural base that requires specific nutritional solutions to be successful, depends on crop-specific approaches to feed at specific stages of growth, and uses specific application timing for precision feeding to achieve optimal plant performance, quality product development, and output of saleable commodity to the market. The differences between the nutrient management requirements of high-value horticultural crops (e.g., fruit, vegetable, spice, flower, and herb) and the requirements of low-value field crops create a unique and rapidly growing potential market for specialty fertilizer products that cannot be fulfilled by the conventional input subsidy route.
The quantitative measure of the growth of this demand driver is provided by the Ministry of Agriculture and Farmers Welfare. As of the 2024-25 planting season, the total area devoted to horticultural activities in India was 301.36 lakh hectares and produced 3,707.38 lakh tonnes of product, an increase of 10.50 lakh hectares of planted area and 159.94 lakh tonnes of produced product from the previous agricultural year (2023-24). Horticultural production growth included an increase of 4.13% in fruit production and a 5.11% increases in vegetable production. This continued expansion of horticultural production establishes a strong and growing structural foundation demand for specialty fertilizers to optimize nutrient utilization, enhance plant uniformity, and to conserve crop quality under intensive farming conditions.
India Specialty Fertilizers Market ChallengeSubsidized Conventional Nutrients Constrain Premium Adoption
The persistent price protection of conventional fertilizer products through government subsidy architecture creates a structural adoption barrier for specialty fertilizers, distorting the purchase decision framework within which premium input products must compete. When farmers evaluate specialty fertilizer investments against subsidized conventional alternatives, the comparison is inherently asymmetric pitting market-priced efficiency against policy-suppressed commodity costs. This pricing asymmetry is most consequential in price-sensitive farming belts where upfront input cost remains the primary purchase filter, and where the agronomic case for specialty nutrition must overcome a substantial economic perception gap before adoption decisions are made.
The durability of this challenge is confirmed by official pricing data from the Ministry of Agriculture and Farmers Welfare. The maximum retail price of urea has remained constant since 2018, while the MRP of DAP has been held unchanged for three consecutive years from 2023-24 through 2025-26 with the Government of India continuing to bear subsidy on both urea and phosphatic and potassic fertilizers. This sustained price protection keeps conventional nutrients highly affordable and widely embedded in farmer purchasing habits across all agroclimatic zones. For specialty fertilizer market participants, overcoming this structural inertia requires a sustained investment in agronomic demonstration, crop-response evidence communication, and ROI-based value articulation that repositions the purchase decision around long-term efficiency gains rather than unit input cost comparisons through 2032.
Unlock Market Intelligence
Explore the market potential with our data-driven report
India Specialty Fertilizers Market TrendNano Fertilizer Formats Accelerate Efficiency-Led Product Evolution
The transition of nano fertilizer technology from pilot-stage validation to scaled commercial distribution represents a defining structural trend within the specialty fertilizers space, signaling that the product innovation frontier has moved decisively toward ultra-efficient, precision-compatible nutrient formats. This evolution elevates the competitive conversation beyond conventional formulation parameters solubility, granulation, and NPK ratios into the domain of nutrient bioavailability at the molecular level, application economics per unit of crop response, and integration compatibility with digital and drone-assisted delivery systems. For specialty fertilizer market participants, the nano trend creates both a product development imperative and a market positioning opportunity.
Commercial absorption data from the Ministry of Chemicals and Fertilizers validates the depth of this trend's market penetration. Cumulative nano fertilizer sales reached 1,593.37 lakh bottles of 500 ml each by March 2026, comprising 1,219.27 lakh bottles of Nano Urea and 374.10 lakh bottles of Nano DAP demonstrating active farm-level adoption at meaningful scale through regular distribution channels. Field trials further substantiate the performance proposition: Nano Urea applied alongside the recommended basal dose of conventional fertilizer demonstrably reduces urea consumption by 25% to 50% while delivering yield gains of 3% to 8% across various crops. The distribution of 1,094 drones to support application access further accelerates the delivery infrastructure for nano and foliar nutrition formats, reinforcing their trajectory as a high-growth vector within the specialty fertilizer segment through 2032.
India Specialty Fertilizers Market OpportunityMicro-Irrigation Expansion Unlocks Fertigation-Linked Specialty Demand
As a result of this large investment by state and federal governments into the development of micro-irrigation systems, there now exists a significant and expanding structural opportunity for specialty fertilizers that can be used in conjunction with fertigation systems. As the penetration of drip and sprinkler irrigation systems continues to grow throughout the horticulture and intensively cultivated areas of the world, there is an increasing agronomic and economic rationale for using soluble, crop-specific nutrients via irrigation systems thereby allowing growers to achieve improved nutrient use efficiency, eliminate waste of inputs and enhance crop quality compared to conventional broadcasting techniques. This relationship between the requirement for new infrastructure and the commercial viability of precision-compatible specialty fertilizers creates a long-term and scalable commercial avenue for precision-compatible specialty fertilizers.
The financial scale of micro-irrigation investment, documented by the Ministry of Finance's Economic Survey 2024-25, validates the structural depth of this opportunity. USD 2.32 billion was released to states under the Per Drop More Crop scheme from FY16 to FY25, supporting coverage of 95.58 lakh hectares under micro-irrigation systems. Complementing this, loans amounting to USD 560 million was approved under the Micro-Irrigation Fund, of which USD 430 million had been disbursed. Each incremental hectare brought under micro-irrigation infrastructure represents a potential fertigation-ready surface for specialty nutrient delivery, progressively expanding the addressable market for water-soluble and precision-compatible fertilizer formats. Specialty fertilizer manufacturers positioned to serve this expanding irrigation-linked cultivation base with technically validated, agronomically differentiated products will capture disproportionate value from this opportunity through 2032.
Unlock Market Intelligence
Explore the market potential with our data-driven report
India Specialty Fertilizers Market Segmentation Analysis
By Product Type
- Water-Soluble Fertilizers
- Water-Soluble NPK Fertilizers
- Water-Soluble Straight Fertilizers
- Specialty Water-Soluble Blends
- Secondary Nutrient Fertilizers
- Sulphur-based Fertilizers
- Calcium-based Fertilizers
- Magnesium-based Fertilizers
- Micronutrient Fertilizers
- Zinc Fertilizers
- Boron Fertilizers
- Chelated/Micronutrient Mixtures
- Enhanced-Efficiency Fertilizers
- Slow-Release Fertilizers
- Controlled-Release Fertilizers
- Stabilized Fertilizers
- Customized Fertilizers
- Area-Specific Grades
- Crop-Specific Grades
- Stage-Specific Grades
- Fortified Fertilizers
- Zinc-Fortified Grades
- Boron-Fortified Grades
- Multi-Fortified Grades
- Nano Fertilizers
- Nano Urea
- Other Nano Nutrient Fertilizers
The segment with highest market share under the product type is water-soluble fertilizers, accounting for approximately 40% of the total market. This leading position reflects their superior agronomic compatibility with modern intensive farming systems, where rapid nutrient availability, solution-phase mixing precision, and controlled application rates are non-negotiable operational requirements. Water-soluble formulations deliver a functional advantage that commodity straight fertilizers cannot replicate the ability to calibrate nutrient concentration, timing, and placement with the granularity demanded by high-value crop production. Their dominance within the specialty segment confirms that product adoption in this market is driven by performance logic rather than price comparison.
The structural leadership of water-soluble fertilizers is reinforced by their dual compatibility with fertigation and foliar application systems the two fastest-growing delivery methods in precision-oriented farming. This compatibility creates a self-reinforcing demand cycle: as micro-irrigation infrastructure expands, the utility of water-soluble formats deepens, and as grower experience with precision delivery accumulates, product loyalty within this category strengthens. The segment's ability to serve diverse crop-specific nutrient requirements across multiple growth stages further widens its addressable application universe. Water-soluble fertilizers are expected to retain their category-leading position and continue defining the competitive center of the specialty fertilizer industry through 2032.

By Application Method
- Fertigation
- Foliar Application
- Soil Application
- Localized/Precision Application
The segment with highest market share under the application method is fertigation, accounting for approximately 45% of the total market. This dominant share reflects the progressive entrenchment of irrigation-integrated nutrient delivery as the operational standard across India's commercially intensive farming systems. Fertigation's market authority derives from its capacity to unify two critical farm management functions water delivery and nutrition into a single, precision-controllable process that minimizes application variability, reduces nutrient loss, and optimizes root-zone absorption efficiency. Its adoption signals a fundamental upgrade in how India's advanced grower segment conceptualizes input management and crop performance optimization.
Fertigation's structural leadership is sustained by its synergistic relationship with water-soluble specialty fertilizers and its alignment with government-supported micro-irrigation expansion. The 95.58 lakh hectares covered under the Per Drop More Crop scheme, supported by USD 2.63 billion in cumulative releases, creates an expanding infrastructure base within which fertigation-compatible specialty products can achieve scaled commercial absorption. In horticulture and intensive vegetable cultivation where yield quality, uniformity, and produce appearance directly determine commercial value fertigation delivers measurable agronomic and economic advantages that alternative application methods cannot match. The segment's dominance is expected to deepen as micro-irrigation penetration widens and precision farming adoption accelerates through 2032.
List of Companies Covered in India Specialty Fertilizers Market
The companies listed below are highly influential in the India specialty fertilizers market, with a significant market share and a strong impact on industry developments.
- Rashtriya Chemicals & Fertilizers Ltd. (RCF)
- Yara Fertilisers India Pvt. Ltd.
- ICL Fertilizers (India) Pvt. Ltd.
- Coromandel International Ltd.
- Indian Farmers Fertiliser Cooperative Ltd. (IFFCO)
- Mahadhan AgriTech Ltd.
- Gujarat State Fertilizers & Chemicals Ltd. (GSFC)
- DCM Shriram Ltd.
- Paradeep Phosphates Ltd.
- Indian Potash Ltd.
Market News & Updates
- Coromandel International Ltd, 2025:
Coromandel launched Fertinex in December 2025 as a next-generation water-soluble fertilizer powered by Smart Signalling Technology. This is a strong specialty-fertilizer market update because it directly fits the water-soluble fertilizer segment and is positioned for precision nutrition through fertigation and foliar use, especially for horticulture and other higher-value cropping systems.
- Rashtriya Chemicals & Fertilizers Ltd. (RCF), 2025:
RCF’s commissioning of the Trombay Nano Urea plant in February 2025 also fits the specialty fertilizers market because your segmentation explicitly includes nano fertilizers under specialty products. The development matters because it adds production capacity for advanced nutrient products designed to improve nutrient-use efficiency and support more targeted fertilizer application in Indian agriculture.
Frequently Asked Questions
Related Report
- Market Segmentation
- Research Scope
- Research Methodology
- Definitions and Assumptions
- Executive Summary
- India Specialty Fertilizers Market Policies, Regulations, and Standards
- India Specialty Fertilizers Market Dynamics
- Growth Factors
- Challenges
- Trends
- Opportunities
- India Specialty Fertilizers Market Statistics, 2022-2032F
- Market Size & Growth Outlook
- By Revenues in USD Million
- Market Segmentation & Growth Outlook
- By Product Type
- Water-Soluble Fertilizers- Market Insights and Forecast 2022-2032, USD Million
- Water-Soluble NPK Fertilizers- Market Insights and Forecast 2022-2032, USD Million
- Water-Soluble Straight Fertilizers- Market Insights and Forecast 2022-2032, USD Million
- Specialty Water-Soluble Blends- Market Insights and Forecast 2022-2032, USD Million
- Secondary Nutrient Fertilizers- Market Insights and Forecast 2022-2032, USD Million
- Sulphur-based Fertilizers- Market Insights and Forecast 2022-2032, USD Million
- Calcium-based Fertilizers- Market Insights and Forecast 2022-2032, USD Million
- Magnesium-based Fertilizers- Market Insights and Forecast 2022-2032, USD Million
- Micronutrient Fertilizers- Market Insights and Forecast 2022-2032, USD Million
- Zinc Fertilizers- Market Insights and Forecast 2022-2032, USD Million
- Boron Fertilizers- Market Insights and Forecast 2022-2032, USD Million
- Chelated/Micronutrient Mixtures- Market Insights and Forecast 2022-2032, USD Million
- Enhanced-Efficiency Fertilizers- Market Insights and Forecast 2022-2032, USD Million
- Slow-Release Fertilizers- Market Insights and Forecast 2022-2032, USD Million
- Controlled-Release Fertilizers- Market Insights and Forecast 2022-2032, USD Million
- Stabilized Fertilizers- Market Insights and Forecast 2022-2032, USD Million
- Customized Fertilizers- Market Insights and Forecast 2022-2032, USD Million
- Area-Specific Grades- Market Insights and Forecast 2022-2032, USD Million
- Crop-Specific Grades- Market Insights and Forecast 2022-2032, USD Million
- Stage-Specific Grades- Market Insights and Forecast 2022-2032, USD Million
- Fortified Fertilizers- Market Insights and Forecast 2022-2032, USD Million
- Zinc-Fortified Grades- Market Insights and Forecast 2022-2032, USD Million
- Boron-Fortified Grades- Market Insights and Forecast 2022-2032, USD Million
- Multi-Fortified Grades- Market Insights and Forecast 2022-2032, USD Million
- Nano Fertilizers- Market Insights and Forecast 2022-2032, USD Million
- Nano Urea- Market Insights and Forecast 2022-2032, USD Million
- Other Nano Nutrient Fertilizers- Market Insights and Forecast 2022-2032, USD Million
- Water-Soluble Fertilizers- Market Insights and Forecast 2022-2032, USD Million
- By Form/Formulation
- Crystalline/Powder- Market Insights and Forecast 2022-2032, USD Million
- Granular- Market Insights and Forecast 2022-2032, USD Million
- Liquid- Market Insights and Forecast 2022-2032, USD Million
- Coated/Encapsulated- Market Insights and Forecast 2022-2032, USD Million
- Chelated Formulations- Market Insights and Forecast 2022-2032, USD Million
- By Application Method
- Fertigation- Market Insights and Forecast 2022-2032, USD Million
- Foliar Application- Market Insights and Forecast 2022-2032, USD Million
- Soil Application- Market Insights and Forecast 2022-2032, USD Million
- Localized/Precision Application- Market Insights and Forecast 2022-2032, USD Million
- By Crop Type
- Fruits & Vegetables- Market Insights and Forecast 2022-2032, USD Million
- Cereals & Grains- Market Insights and Forecast 2022-2032, USD Million
- Oilseeds & Pulses- Market Insights and Forecast 2022-2032, USD Million
- Plantation & Commercial Crops- Market Insights and Forecast 2022-2032, USD Million
- Turf & Ornamentals- Market Insights and Forecast 2022-2032, USD Million
- By End User
- Open-field Growers- Market Insights and Forecast 2022-2032, USD Million
- Protected Cultivation/Greenhouse Growers- Market Insights and Forecast 2022-2032, USD Million
- Nurseries- Market Insights and Forecast 2022-2032, USD Million
- Plantation Growers- Market Insights and Forecast 2022-2032, USD Million
- Hydroponic/Intensive Horticulture Users- Market Insights and Forecast 2022-2032, USD Million
- By Distribution Channel
- Retail Offline- Market Insights and Forecast 2022-2032, USD Million
- Distributor/Dealer Network- Market Insights and Forecast 2022-2032, USD Million
- Agri-input Retailers- Market Insights and Forecast 2022-2032, USD Million
- Cooperatives- Market Insights and Forecast 2022-2032, USD Million
- Retail Online- Market Insights and Forecast 2022-2032, USD Million
- Online/Digital Agri-commerce- Market Insights and Forecast 2022-2032, USD Million
- Direct/Institutional- Market Insights and Forecast 2022-2032, USD Million
- Direct Institutional Sales- Market Insights and Forecast 2022-2032, USD Million
- Retail Offline- Market Insights and Forecast 2022-2032, USD Million
- By Region
- North India
- Punjab
- Haryana
- Uttar Pradesh
- West India
- Maharashtra
- Gujarat
- East India
- West Bengal
- Odisha
- South India
- Andhra Pradesh
- Telangana
- Karnataka
- Tamil Nadu
- Kerala
- Central India
- Madhya Pradesh
- Chhattisgarh
- North India
- By Competitors
- Competition Characteristics
- Market Share & Analysis
- By Product Type
- Market Size & Growth Outlook
- India Water-Soluble Fertilizers Market Statistics, 2022-2032
- Market Size & Growth Outlook
- By Revenues in USD Million
- Market Segmentation & Growth Outlook
- By Form/Formulation- Market Insights and Forecast 2022-2032, USD Million
- By Application Method- Market Insights and Forecast 2022-2032, USD Million
- By Crop Type- Market Insights and Forecast 2022-2032, USD Million
- By End User- Market Insights and Forecast 2022-2032, USD Million
- By Distribution Channel- Market Insights and Forecast 2022-2032, USD Million
- By Region- Market Insights and Forecast 2022-2032, USD Million
- Market Size & Growth Outlook
- India Secondary Nutrient Fertilizers Market Statistics, 2022-2032
- Market Size & Growth Outlook
- By Revenues in USD Million
- Market Segmentation & Growth Outlook
- By Form/Formulation- Market Insights and Forecast 2022-2032, USD Million
- By Application Method- Market Insights and Forecast 2022-2032, USD Million
- By Crop Type- Market Insights and Forecast 2022-2032, USD Million
- By End User- Market Insights and Forecast 2022-2032, USD Million
- By Distribution Channel- Market Insights and Forecast 2022-2032, USD Million
- By Region- Market Insights and Forecast 2022-2032, USD Million
- Market Size & Growth Outlook
- India Micronutrient Fertilizers Market Statistics, 2022-2032
- Market Size & Growth Outlook
- By Revenues in USD Million
- Market Segmentation & Growth Outlook
- By Form/Formulation- Market Insights and Forecast 2022-2032, USD Million
- By Application Method- Market Insights and Forecast 2022-2032, USD Million
- By Crop Type- Market Insights and Forecast 2022-2032, USD Million
- By End User- Market Insights and Forecast 2022-2032, USD Million
- By Distribution Channel- Market Insights and Forecast 2022-2032, USD Million
- By Region- Market Insights and Forecast 2022-2032, USD Million
- Market Size & Growth Outlook
- India Enhanced-Efficiency Fertilizers Market Statistics, 2022-2032
- Market Size & Growth Outlook
- By Revenues in USD Million
- Market Segmentation & Growth Outlook
- By Form/Formulation- Market Insights and Forecast 2022-2032, USD Million
- By Application Method- Market Insights and Forecast 2022-2032, USD Million
- By Crop Type- Market Insights and Forecast 2022-2032, USD Million
- By End User- Market Insights and Forecast 2022-2032, USD Million
- By Distribution Channel- Market Insights and Forecast 2022-2032, USD Million
- By Region- Market Insights and Forecast 2022-2032, USD Million
- Market Size & Growth Outlook
- India Customized Fertilizers Market Statistics, 2022-2032
- Market Size & Growth Outlook
- By Revenues in USD Million
- Market Segmentation & Growth Outlook
- By Form/Formulation- Market Insights and Forecast 2022-2032, USD Million
- By Application Method- Market Insights and Forecast 2022-2032, USD Million
- By Crop Type- Market Insights and Forecast 2022-2032, USD Million
- By End User- Market Insights and Forecast 2022-2032, USD Million
- By Distribution Channel- Market Insights and Forecast 2022-2032, USD Million
- By Region- Market Insights and Forecast 2022-2032, USD Million
- Market Size & Growth Outlook
- India Fortified Fertilizers Market Statistics, 2022-2032
- Market Size & Growth Outlook
- By Revenues in USD Million
- Market Segmentation & Growth Outlook
- By Form/Formulation- Market Insights and Forecast 2022-2032, USD Million
- By Application Method- Market Insights and Forecast 2022-2032, USD Million
- By Crop Type- Market Insights and Forecast 2022-2032, USD Million
- By End User- Market Insights and Forecast 2022-2032, USD Million
- By Distribution Channel- Market Insights and Forecast 2022-2032, USD Million
- By Region- Market Insights and Forecast 2022-2032, USD Million
- Market Size & Growth Outlook
- India Nano Fertilizers Market Statistics, 2022-2032
- Market Size & Growth Outlook
- By Revenues in USD Million
- Market Segmentation & Growth Outlook
- By Form/Formulation- Market Insights and Forecast 2022-2032, USD Million
- By Application Method- Market Insights and Forecast 2022-2032, USD Million
- By Crop Type- Market Insights and Forecast 2022-2032, USD Million
- By End User- Market Insights and Forecast 2022-2032, USD Million
- By Distribution Channel- Market Insights and Forecast 2022-2032, USD Million
- By Region- Market Insights and Forecast 2022-2032, USD Million
- Market Size & Growth Outlook
- Competitive Outlook
- Company Profiles
- Coromandel International Ltd.
- Business Description
- Product Portfolio
- Collaborations & Alliances
- Recent Developments
- Financial Details
- Others
- Indian Farmers Fertiliser Cooperative Ltd. (IFFCO)
- Business Description
- Product Portfolio
- Collaborations & Alliances
- Recent Developments
- Financial Details
- Others
- Mahadhan AgriTech Ltd.
- Business Description
- Product Portfolio
- Collaborations & Alliances
- Recent Developments
- Financial Details
- Others
- Gujarat State Fertilizers & Chemicals Ltd. (GSFC)
- Business Description
- Product Portfolio
- Collaborations & Alliances
- Recent Developments
- Financial Details
- Others
- DCM Shriram Ltd.
- Business Description
- Product Portfolio
- Collaborations & Alliances
- Recent Developments
- Financial Details
- Others
- Rashtriya Chemicals & Fertilizers Ltd. (RCF)
- Business Description
- Product Portfolio
- Collaborations & Alliances
- Recent Developments
- Financial Details
- Others
- Yara Fertilisers India Pvt. Ltd.
- Business Description
- Product Portfolio
- Collaborations & Alliances
- Recent Developments
- Financial Details
- Others
- ICL Fertilizers (India) Pvt. Ltd.
- Business Description
- Product Portfolio
- Collaborations & Alliances
- Recent Developments
- Financial Details
- Others
- Paradeep Phosphates Ltd.
- Business Description
- Product Portfolio
- Collaborations & Alliances
- Recent Developments
- Financial Details
- Others
- Indian Potash Ltd.
- Business Description
- Product Portfolio
- Collaborations & Alliances
- Recent Developments
- Financial Details
- Others
- Rama Phosphates Ltd.
- Business Description
- Product Portfolio
- Collaborations & Alliances
- Recent Developments
- Financial Details
- Others
- K+S Fertilizers (India) Pvt. Ltd.
- Business Description
- Product Portfolio
- Collaborations & Alliances
- Recent Developments
- Financial Details
- Others
- Indian Phosphate Ltd.
- Business Description
- Product Portfolio
- Collaborations & Alliances
- Recent Developments
- Financial Details
- Others
- Narmada Bio-Chem Ltd.
- Business Description
- Product Portfolio
- Collaborations & Alliances
- Recent Developments
- Financial Details
- Others
- Khaitan Chemicals & Fertilizers Ltd.
- Business Description
- Product Portfolio
- Collaborations & Alliances
- Recent Developments
- Financial Details
- Others
- Coromandel International Ltd.
- Company Profiles
- Disclaimer
| Segment | Sub-Segment |
|---|---|
| By Product Type |
|
| By Form/Formulation |
|
| By Application Method |
|
| By Crop Type |
|
| By End User |
|
| By Distribution Channel |
|
| By Region |
|
Research Methodology
This study followed a structured approach comprising four key phases to assess the size and scope of the electro-oxidation market. The process began with thorough secondary research to collect data on the target market, related markets, and broader industry context. These findings, along with preliminary assumptions and estimates, were then validated through extensive primary research involving industry experts from across the value chain. To calculate the overall market size, both top-down and bottom-up methodologies were employed. Finally, market segmentation and data triangulation techniques were applied to refine and validate segment-level estimations.
Secondary Research
The secondary research phase involved gathering data from a wide range of credible and published sources. This step helped in identifying industry trends, defining market segmentation, and understanding the market landscape and value chain.
Sources consulted during this phase included:
- Company annual reports, investor presentations, and press releases
- Industry white papers and certified publications
- Trade directories and market-recognized databases
- Articles from authoritative authors and reputable journals
- Gold and silver standard websites
Secondary research was critical in mapping out the industry's value chain and monetary flow, identifying key market segments, understanding regional variations, and tracking significant industry developments.
Other key sources:
- Financial disclosures
- Industry associations and trade bodies
- News outlets and business magazines
- Academic journals and research studies
- Paid industry databases
Primary Research
To validate secondary data and gain deeper market insights, primary research was conducted with key stakeholders across both the supply and demand sides of the market.
On the demand side, participants included decision-makers and influencers from end-user industries—such as CIOs, CTOs, and CSOs—who provided first-hand perspectives on market needs, product usage, and future expectations.
On the supply side, interviews were conducted with manufacturers, industry associations, and institutional participants to gather insights into current offerings, product pipelines, and market challenges.
Primary interviews provided critical inputs such as:
- Market size and revenue data
- Product and service breakdowns
- Market forecasts
- Regional and application-specific trends
Stakeholders consulted included:
- Leading OEM and solution providers
- Channel and distribution partners
- End users across various applications
- Independent consultants and industry specialists
Market Size Estimation and Data Triangulation
- Identifying Key Market Participants (Secondary Research)
- Goal: To identify the major players or companies in the target market. This typically involves using publicly available data sources such as industry reports, market research publications, and financial statements of companies.
- Tools: Reports from firms like Gartner, Forrester, Euromonitor, Statista, IBISWorld, and others. Public financial statements, news articles, and press releases from top market players.
- Extracting Earnings of Key Market Participants
- Goal: To estimate the earnings generated from the product or service being analyzed. This step helps in understanding the revenue potential of each market player in a specific geography.
- Methods: Earnings data can be gathered from:
- Publicly available financial reports (for listed companies).
- Interviews and primary data sources from professionals, such as Directors, VPs, SVPs, etc. This is especially useful for understanding more nuanced, internal data that isn't publicly disclosed.
- Annual reports and investor presentations of key players.
- Data Collation and Development of a Relevant Data Model
- Goal: To collate inputs from both primary and secondary sources into a structured, data-driven model for market estimation. This model will incorporate key market KPIs and any independent variables relevant to the market.
- Key KPIs: These could include:
- Market size, growth rate, and demand drivers.
- Industry-specific metrics like market share, average revenue per customer (ARPC), or average deal size.
- External variables, such as economic growth rates, inflation rates, or commodity prices, that could affect the market.
- Data Modeling: Based on this data, the market forecasts are developed for the next 5 years. A combination of trend analysis, scenario modeling, and statistical regression might be used to generate projections.
- Scenario Analysis
- Goal: To test different assumptions and validate how sensitive the market is to changes in key variables (e.g., market demand, regulatory changes, technological disruptions).
- Types of Scenarios:
- Base Case: Based on current assumptions and historical data.
- Best-Case Scenario: Assuming favorable market conditions, regulatory environments, and technological advancements.
- Worst-Case Scenario: Accounting for adverse factors, such as economic downturns, stricter regulations, or unexpected disruptions.


