India Nano Fertilizers Market Report: Trends, Growth and Forecast (2026-2032)
By Product Type (Nano Nitrogen Fertilizers (Nano Urea, Other Nano Nitrogen Formulations), Nano Phosphatic Fertilizers (Nano DAP, Other Nano Phosphorus Formulations), Nano Potassic Fertilizers (Nano Potassium Fertilizers), Nano Secondary Nutrient Fertilizers (Nano Calcium, Nano Magnesium, Nano Sulphur), Nano Micronutrient Fertilizers (Nano Zinc, Nano Iron, Nano Boron, Other Nano Micronutrients), Nano Multi-Nutrient/Compound Fertilizers (Nano NPK, Multi-Nutrient Nano Blends)), By Application Method (Foliar Application, Soil Application, Seed Treatment/Seed Priming, Fertigation/Irrigation-Based Application), By Crop Type (Cereals & Grains, Oilseeds & Pulses, Fruits & Vegetables, Plantation & Commercial Crops, Turf, Ornamentals & Other High-Value Crops), By Technology Platform (Nutrient Nanoparticles, Nano-Encapsulated Fertilizers, Nanocarrier-Based Fertilizers, Nanocomposite Fertilizers, Nano-Biofertilizers), By Distribution Channel (Retail Offline (Agri-input Stores, Fertilizer Dealers, Cooperative Outlets, Rural retail Stores, Distributor-led Physical Sales Points), Retail Online (Company Websites, E-commerce Marketplaces, Agri-tech Platforms, Online Sealer Portals, Digital Farm-input Apps)), By Region (North India (Uttar Pradesh, Punjab, Haryana), West India (Gujarat, Maharashtra), East India (Odisha, West Bengal), South India (Andhra Pradesh, Karnataka, Telangana, Tamil Nadu), Central India (Madhya Pradesh)) ... Read more
|
Major Players
|
India Nano Fertilizers Market Statistics and Insights, 2026
- Market Size Statistics
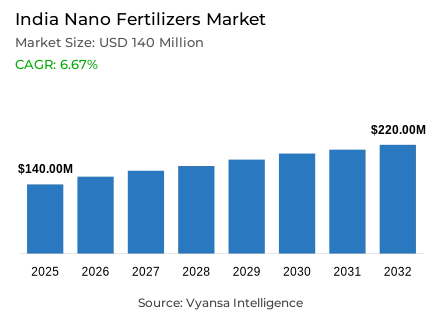
- Nano fertilizers market size in India was valued at USD 140 million in 2025 and is estimated at USD 167 million in 2026.
- The market size is expected to grow to USD 220 million by 2032.
- Market to register a CAGR of around 6.67% during 2026-32.
- Product Type Shares
- Nano nitrogen fertilizers grabbed market share of 75%.
- Competition
- More than 5 companies are actively engaged in producing nano fertilizers in India.
- Top 5 companies acquired around 35% of the market share.
- Zuari Farm Hub Ltd., Ray Nano & Research Centre, Natural Plant Protection Ltd., Indian Farmers Fertiliser Cooperative Ltd. (IFFCO), Coromandel International Ltd. etc., are few of the top companies.
- Application Method
- Foliar application grabbed 60% of the market.
India Nano Fertilizers Market Outlook
The India nano fertilizers market was valued at USD 140 million in 2025, establishing a commercially meaningful foundation within the advanced agricultural input ecosystem. Projected to advance from USD 167 million in 2026 to USD 220 million by 2032, the sector registers a CAGR of 6.67% across the forecast horizon. This trajectory reflects a market in purposeful transition moving from early adoption visibility toward structured commercial scaling, supported by rising grower acceptance of efficiency-oriented nutrient solutions and the progressive mainstreaming of precision agriculture practices across Indian farming systems. The step-up in market value from 2025 to 2026 signals that institutional demand creation mechanisms are translating into durable purchasing behavior at the farm level.
The technological logic driving this market's expansion centers on the fundamental agronomic advantages that nano-scale nutrient delivery confers over conventional bulk fertilizer formats. By reducing nutrient particle size to the nanometric range, these formulations achieve superior surface area-to-volume ratios that catalyze faster absorption kinetics, higher bioavailability at the cellular level, and measurably lower application volumes per unit of crop response. This performance architecture directly addresses the chronic nutrient-use efficiency deficit in Indian agriculture where nitrogen utilization rates of only 30% to 45%, phosphorus recovery of 15% to 25%, and potassium efficiency of 50% to 60% represent both a structural agricultural problem and a compelling commercial opportunity for precision nutrient innovation.
Demand behavior within this market is shaped by a dual-track adoption dynamic. On one track, policy-linked supply infrastructure with 7 nano urea plants operating at a combined capacity of 27.22 crore bottles per annum and 3 Nano DAP plants adding 7.64 crore bottles of annual capacity ensures product availability at the scale necessary to support widespread farm-level access. On the second track, agronomic demonstration programs, soil health advisory infrastructure, and drone-assisted application deployment are progressively building the field-level knowledge base that transforms product awareness into consistent purchase behavior. The convergence of these two adoption tracks defines the market's near-term commercial momentum and its medium-term scaling potential.
The competitive and regulatory forward view reveals a market whose growth trajectory is inextricably linked with the pace of precision agriculture infrastructure deployment and the evolution of policy incentives favoring reduced chemical fertilizer dependence. The PM-PRANAM framework, which provides state-level incentives equivalent to 50% of fertilizer subsidy savings achieved through reduced chemical consumption, creates a structural policy tailwind that progressively improves the commercial viability of nano fertilizer adoption at scale. As foliar delivery infrastructure deepens, soil intelligence systems expand, and agronomic evidence accumulates across diverse crop and soil environments, nano fertilizers are positioned to capture an expanding share of India's agricultural input value chain through 2032.

India Nano Fertilizers Market Growth DriverPolicy-Backed Supply Infrastructure Accelerates Market Scaling
The government has committed to supporting not only nano fertilizer promotion, but also production capacity growth and institutional awareness building. These are the main structural drivers of market growth and will function as a systematic demand activation mechanism that will address product availability and affordability access barriers, along with barriers to farmer knowledge. The policy infrastructure in place to support the adoption of nano fertilizers spans the entire commercialization value chain from investment in manufacturing capacity to agronomic demonstration and development of distribution networks, thus creating a coordinated and active demand-supply interface; thereby eliminating the common adoption friction experienced by farmers as they introduce new agricultural input categories into their farming systems. This institutional framework is creating a transition of nano fertilizers from a specialized new innovation type of product into a common farm input product type that will reach across the nation commercially at a national scale.
The quantitative dimensions of this policy-driven supply readiness are validated with precision by the Press Information Bureau. Cumulative nano fertilizer sales have reached 1,593.37 lakh bottles, comprising 1,219.27 lakh bottles of Nano Urea and 374.10 lakh bottles of Nano DAP demonstrating commercial absorption at a scale that confirms the transition from pilot visibility to structured market penetration. The production infrastructure underpinning this distribution capacity is substantial: 7 Nano Urea plants are operational with a combined production capacity of 27.22 crore bottles per annum, while 3 Nano DAP plants contribute an additional 7.64 crore bottles of annual capacity. This manufacturing scale supports wider product reach, improves supply reliability across geographies, and keeps market expansion firmly linked with government-backed awareness investment and institutional distribution development through 2032.
India Nano Fertilizers Market ChallengePerformance Variability Constrains Confident Farm-Level Substitution
Inconsistent agronomic performance across diverse soil conditions, crop systems, and substitution levels constitutes the primary structural challenge confronting the nano fertilizers market, creating adoption hesitancy among experience-driven farmers who evaluate new input products against observable crop response outcomes rather than theoretical efficiency claims. The challenge is most acute in low-fertility soils and at higher substitution rates, where the agronomic complexity of nano nutrient behavior under nutrient-deficient conditions demands more sophisticated dosage management than the simplified application messaging associated with early market rollout. This performance variability gap between controlled trial conditions and real-world farm diversity represents the most significant credibility barrier to accelerated mainstream adoption.
The structural depth of this challenge is contextualized by official data from the Press Information Bureau. The government is actively addressing documented concerns over inconsistent performance and nutrient deficiencies observed at higher substitution levels specifically at 50% replacement rates in low-fertility soil environments. The scale of the transition challenge is further illuminated by the conventional fertilizer entrenchment it must overcome: subsidized urea sales stand at 399.40 lakh metric tonnes in 2025, while national nutrient-use efficiency rates remain at only 30% to 45% for nitrogen, 15% to 25% for phosphorus, and 50% to 60% for potassium. This entrenched low-efficiency system means that successful nano fertilizer scaling requires not merely product substitution but a comprehensive behavioral shift in both product selection and application management practice a transformation that will define the market's adoption curve through 2032.
Unlock Market Intelligence
Explore the market potential with our data-driven report
India Nano Fertilizers Market TrendDrone-Integrated Precision Spraying Redefines Delivery Standards
The emergence of drone-assisted foliar application as the delivery infrastructure standard for nano fertilizers represents a defining structural trend, elevating the market's technological sophistication profile and establishing a new operational benchmark against which conventional application methods are increasingly measured. This convergence of nano nutrient science with autonomous precision delivery technology creates a compounding performance advantage combining the bioavailability superiority of nano-scale particles with the field coverage uniformity, application consistency, and labor efficiency that drone-based systems deliver. For market participants, this trend transforms the commercial proposition from product supply into integrated precision nutrition service delivery.
The agronomic and institutional evidence base supporting this trend is documented comprehensively by the Press Information Bureau. Nano Urea applied as a foliar spray alongside the recommended basal dose of conventional fertilizers demonstrably reduces urea consumption by 25% to 50% while delivering yield gains of 3% to 8% across various crop systems a performance profile that validates the economic case for precision foliar delivery investment at the farm level. The government is actively improving access to appropriate foliar spray systems, including drone-based spraying infrastructure, to ensure proper and efficient nano fertilizer use at scale. With 1,094 drones already distributed to support application access, the structural foundation for drone-integrated nano fertilizer delivery is being actively constructed positioning precision spraying as the dominant application paradigm through 2032.
India Nano Fertilizers Market OpportunityBalanced Nutrition Policy Framework Creates Structural Demand Headroom
The policy-driven transition toward balanced nutrient management and reduced chemical fertilizer dependence is creating a structurally significant and durable commercial opportunity for nano fertilizer market participants, establishing an incentive architecture that progressively improves the relative commercial attractiveness of precision nutrient alternatives over subsidized conventional inputs. The PM-PRANAM framework represents a particularly consequential policy mechanism by rewarding states that demonstrate measurable reductions in chemical fertilizer consumption with incentives equivalent to 50% of the subsidy savings generated, it creates financial motivation at the institutional level for accelerating the adoption of alternate nutrient categories, including nano fertilizers, across government-influenced agricultural extension and input procurement systems.
The soil intelligence infrastructure being deployed at national scale, as documented by the Press Information Bureau, amplifies the commercial potential of this opportunity by building the agronomic knowledge foundation necessary for informed specialty nutrient adoption. Over 25.55 crore Soil Health Cards have been distributed by mid-November 2025, supported by more than 93,000 farmer training programmes and approximately 6.8 lakh field demonstrations that collectively elevate farmer awareness of nutrient-use efficiency, soil-specific deficiency profiles, and the agronomic rationale for precision input selection. This expanding knowledge ecosystem transforms the PM-PRANAM policy incentive from an abstract financial mechanism into an actionable adoption pathway creating the conditions under which nano fertilizers can progressively capture market share from conventional bulk inputs and establish a self-reinforcing demand growth cycle through 2032.
Unlock Market Intelligence
Explore the market potential with our data-driven report
India Nano Fertilizers Market Segmentation Analysis
By Product Type
- Nano Nitrogen Fertilizers
- Nano Urea
- Other Nano Nitrogen Formulations
- Nano Phosphatic Fertilizers
- Nano DAP
- Other Nano Phosphorus Formulations
- Nano Potassic Fertilizers
- Nano Potassium Fertilizers
- Nano Secondary Nutrient Fertilizers
- Nano Calcium
- Nano Magnesium
- Nano Sulphur
- Nano Micronutrient Fertilizers
- Nano Zinc
- Nano Iron
- Nano Boron
- Other Nano Micronutrients
- Nano Multi-Nutrient/Compound Fertilizers
- Nano NPK
- Multi-Nutrient Nano Blends
The segment with highest market share under the product type is nano nitrogen fertilizers, accounting for approximately 75% of the total market. This commanding concentration reflects the primacy of nitrogen as the most universally limiting nutrient across India's diverse cropping systems and the agronomic urgency of improving its utilization efficiency at scale. With three-quarters of total market value anchored within a single product category, nano nitrogen fertilizers function as the structural and commercial engine of the nano fertilizer industry defining manufacturing investment priorities, distribution channel development, and competitive strategy across the entire value chain. Their dominance confirms that the market's initial scaling phase is being driven by the most agronomically critical and commercially validated nano nutrient category.
The structural leadership of nano nitrogen fertilizers is reinforced by the scale of their institutional backing, the depth of their agronomic trial evidence, and the breadth of their distribution penetration demonstrated by cumulative nano urea sales of 1,219.27 lakh bottles as reported by the Press Information Bureau. This embedded commercial traction creates a compounding advantage: as more farmers accumulate direct experience with nano nitrogen performance outcomes, product credibility deepens, adoption barriers lower, and repeat purchase rates strengthen. The category's central role in portfolio planning, channel prioritization, and category-level value generation is expected to sustain its dominant market share position while simultaneously creating a credibility platform from which adjacent nano nutrient categories can scale through 2032.

By Application Method
- Foliar Application
- Soil Application
- Seed Treatment/Seed Priming
- Fertigation/Irrigation-Based Application
The segment with highest market share under the application method is foliar application, accounting for approximately 60% of the total market. This dominant share reflects the fundamental agronomic compatibility between nano-scale nutrient particles and leaf-surface absorption pathways a compatibility that enables faster nutrient uptake response, more precise timing of nutritional interventions, and the ability to address crop deficiencies at critical growth stages without disturbing soil chemistry or application logistics. Foliar delivery's market leadership confirms that nano fertilizer adoption is being driven by growers who understand and prioritize delivery precision over application convenience, representing a commercially sophisticated and agronomically informed demand cohort.
The structural entrenchment of foliar application as the dominant delivery method is being actively reinforced by government infrastructure investment in drone-based spraying systems, as documented by the Press Information Bureau. The deployment of 1,094 drones to support nano fertilizer application access progressively resolves the field coverage and application uniformity challenges that have historically limited foliar method scalability beyond smallholder farming contexts. As drone-assisted precision spraying becomes more accessible and economically viable across diverse farm sizes and geographies, foliar application's addressable market expands substantially deepening its structural lead over soil-based alternatives. The method's strong alignment with nano fertilizer performance characteristics and its compatibility with technology-led farming models are expected to sustain its category-defining dominance through 2032.
List of Companies Covered in India Nano Fertilizers Market
The companies listed below are highly influential in the India nano fertilizers market, with a significant market share and a strong impact on industry developments.
- Zuari Farm Hub Ltd.
- Ray Nano & Research Centre
- Natural Plant Protection Ltd.
- Indian Farmers Fertiliser Cooperative Ltd. (IFFCO)
- Coromandel International Ltd.
- National Fertilizers Ltd. (NFL)
- Rashtriya Chemicals & Fertilizers Ltd. (RCF)
Market News & Updates
- Coromandel International Ltd., 2025:
Coromandel unveiled its nano fertilizer plant at Kakinada in February 2025, establishing a dedicated manufacturing base for nano nutrient products. This is a major nano-fertilizer market development because it expands India’s production footprint for advanced fertilizer formulations and supports broader commercialization of nano products intended to deliver lower-dose, higher-efficiency crop nutrition.
- Rashtriya Chemicals & Fertilizers Ltd. (RCF), 2025:
RCF commenced operations of its Nano Urea plant at Trombay on 4 February 2025, adding a new production asset focused on nano nitrogen fertilizer. This is important for the India nano fertilizers market because it increases domestic manufacturing capacity for nano urea and strengthens the availability of foliar-applied nano nutrient solutions through formal fertilizer channels.
Frequently Asked Questions
Related Report
- Market Segmentation
- Research Scope
- Research Methodology
- Definitions and Assumptions
- Executive Summary
- India Nano Fertilizers Market Policies, Regulations, and Standards
- India Nano Fertilizers Market Dynamics
- Growth Factors
- Challenges
- Trends
- Opportunities
- India Nano Fertilizers Market Statistics, 2022-2032F
- Market Size & Growth Outlook
- By Revenues in USD Million
- Market Segmentation & Growth Outlook
- By Product Type
- Nano Nitrogen Fertilizers - Market Insights and Forecast 2022-2032, USD Million
- Nano Urea- Market Insights and Forecast 2022-2032, USD Million
- Other Nano Nitrogen Formulations- Market Insights and Forecast 2022-2032, USD Million
- Nano Phosphatic Fertilizers - Market Insights and Forecast 2022-2032, USD Million
- Nano DAP- Market Insights and Forecast 2022-2032, USD Million
- Other Nano Phosphorus Formulations- Market Insights and Forecast 2022-2032, USD Million
- Nano Potassic Fertilizers - Market Insights and Forecast 2022-2032, USD Million
- Nano Potassium Fertilizers- Market Insights and Forecast 2022-2032, USD Million
- Nano Secondary Nutrient Fertilizers - Market Insights and Forecast 2022-2032, USD Million
- Nano Calcium- Market Insights and Forecast 2022-2032, USD Million
- Nano Magnesium- Market Insights and Forecast 2022-2032, USD Million
- Nano Sulphur- Market Insights and Forecast 2022-2032, USD Million
- Nano Micronutrient Fertilizers - Market Insights and Forecast 2022-2032, USD Million
- Nano Zinc- Market Insights and Forecast 2022-2032, USD Million
- Nano Iron- Market Insights and Forecast 2022-2032, USD Million
- Nano Boron- Market Insights and Forecast 2022-2032, USD Million
- Other Nano Micronutrients- Market Insights and Forecast 2022-2032, USD Million
- Nano Multi-Nutrient/Compound Fertilizers - Market Insights and Forecast 2022-2032, USD Million
- Nano NPK- Market Insights and Forecast 2022-2032, USD Million
- Multi-Nutrient Nano Blends- Market Insights and Forecast 2022-2032, USD Million
- Nano Nitrogen Fertilizers - Market Insights and Forecast 2022-2032, USD Million
- By Application Method
- Foliar Application- Market Insights and Forecast 2022-2032, USD Million
- Soil Application- Market Insights and Forecast 2022-2032, USD Million
- Seed Treatment/Seed Priming- Market Insights and Forecast 2022-2032, USD Million
- Fertigation/Irrigation-Based Application- Market Insights and Forecast 2022-2032, USD Million
- By Crop Type
- Cereals & Grains- Market Insights and Forecast 2022-2032, USD Million
- Oilseeds & Pulses- Market Insights and Forecast 2022-2032, USD Million
- Fruits & Vegetables- Market Insights and Forecast 2022-2032, USD Million
- Plantation & Commercial Crops- Market Insights and Forecast 2022-2032, USD Million
- Turf, Ornamentals & Other High-Value Crops- Market Insights and Forecast 2022-2032, USD Million
- By Technology Platform
- Nutrient Nanoparticles- Market Insights and Forecast 2022-2032, USD Million
- Nano-Encapsulated Fertilizers- Market Insights and Forecast 2022-2032, USD Million
- Nanocarrier-Based Fertilizers- Market Insights and Forecast 2022-2032, USD Million
- Nanocomposite Fertilizers- Market Insights and Forecast 2022-2032, USD Million
- Nano-Biofertilizers- Market Insights and Forecast 2022-2032, USD Million
- By Distribution Channel
- Retail Offline- Market Insights and Forecast 2022-2032, USD Million
- Agri-input Stores- Market Insights and Forecast 2022-2032, USD Million
- Fertilizer Dealers- Market Insights and Forecast 2022-2032, USD Million
- Cooperative Outlets- Market Insights and Forecast 2022-2032, USD Million
- Rural retail Stores- Market Insights and Forecast 2022-2032, USD Million
- Distributor-led Physical Sales Points- Market Insights and Forecast 2022-2032, USD Million
- Retail Online- Market Insights and Forecast 2022-2032, USD Million
- Company Websites- Market Insights and Forecast 2022-2032, USD Million
- E-commerce Marketplaces- Market Insights and Forecast 2022-2032, USD Million
- Agri-tech Platforms- Market Insights and Forecast 2022-2032, USD Million
- Online Sealer Portals- Market Insights and Forecast 2022-2032, USD Million
- Digital Farm-input Apps- Market Insights and Forecast 2022-2032, USD Million
- Retail Offline- Market Insights and Forecast 2022-2032, USD Million
- By Region
- North India
- Uttar Pradesh
- Punjab
- Haryana
- West India
- Gujarat
- Maharashtra
- East India
- Odisha
- West Bengal
- South India
- Andhra Pradesh
- Karnataka
- Telangana
- Tamil Nadu
- Central India
- Madhya Pradesh
- North India
- By Competitors
- Competition Characteristics
- Market Share & Analysis
- By Product Type
- Market Size & Growth Outlook
- India Nano Nitrogen Fertilizers Market Statistics, 2022-2032
- Market Size & Growth Outlook
- By Revenues in USD Million
- Market Segmentation & Growth Outlook
- By Application Method- Market Insights and Forecast 2022-2032, USD Million
- By Crop Type- Market Insights and Forecast 2022-2032, USD Million
- By Technology Platform- Market Insights and Forecast 2022-2032, USD Million
- By Distribution Channel- Market Insights and Forecast 2022-2032, USD Million
- By Region- Market Insights and Forecast 2022-2032, USD Million
- Market Size & Growth Outlook
- India Nano Phosphatic Fertilizers Market Statistics, 2022-2032
- Market Size & Growth Outlook
- By Revenues in USD Million
- Market Segmentation & Growth Outlook
- By Application Method- Market Insights and Forecast 2022-2032, USD Million
- By Crop Type- Market Insights and Forecast 2022-2032, USD Million
- By Technology Platform- Market Insights and Forecast 2022-2032, USD Million
- By Distribution Channel- Market Insights and Forecast 2022-2032, USD Million
- By Region- Market Insights and Forecast 2022-2032, USD Million
- Market Size & Growth Outlook
- India Nano Potassic Fertilizers Market Statistics, 2022-2032
- Market Size & Growth Outlook
- By Revenues in USD Million
- Market Segmentation & Growth Outlook
- By Application Method- Market Insights and Forecast 2022-2032, USD Million
- By Crop Type- Market Insights and Forecast 2022-2032, USD Million
- By Technology Platform- Market Insights and Forecast 2022-2032, USD Million
- By Distribution Channel- Market Insights and Forecast 2022-2032, USD Million
- By Region- Market Insights and Forecast 2022-2032, USD Million
- Market Size & Growth Outlook
- India Nano Secondary Nutrient Fertilizers Market Statistics, 2022-2032
- Market Size & Growth Outlook
- By Revenues in USD Million
- Market Segmentation & Growth Outlook
- By Application Method- Market Insights and Forecast 2022-2032, USD Million
- By Crop Type- Market Insights and Forecast 2022-2032, USD Million
- By Technology Platform- Market Insights and Forecast 2022-2032, USD Million
- By Distribution Channel- Market Insights and Forecast 2022-2032, USD Million
- By Region- Market Insights and Forecast 2022-2032, USD Million
- Market Size & Growth Outlook
- India Nano Micronutrient Fertilizers Market Statistics, 2022-2032
- Market Size & Growth Outlook
- By Revenues in USD Million
- Market Segmentation & Growth Outlook
- By Application Method- Market Insights and Forecast 2022-2032, USD Million
- By Crop Type- Market Insights and Forecast 2022-2032, USD Million
- By Technology Platform- Market Insights and Forecast 2022-2032, USD Million
- By Distribution Channel- Market Insights and Forecast 2022-2032, USD Million
- By Region- Market Insights and Forecast 2022-2032, USD Million
- Market Size & Growth Outlook
- India Nano Multi-Nutrient/Compound Fertilizers Market Statistics, 2022-2032
- Market Size & Growth Outlook
- By Revenues in USD Million
- Market Segmentation & Growth Outlook
- By Application Method- Market Insights and Forecast 2022-2032, USD Million
- By Crop Type- Market Insights and Forecast 2022-2032, USD Million
- By Technology Platform- Market Insights and Forecast 2022-2032, USD Million
- By Distribution Channel- Market Insights and Forecast 2022-2032, USD Million
- By Region- Market Insights and Forecast 2022-2032, USD Million
- Market Size & Growth Outlook
- Competitive Outlook
- Company Profiles
- Indian Farmers Fertiliser Cooperative Ltd. (IFFCO)
- Business Description
- Product Portfolio
- Collaborations & Alliances
- Recent Developments
- Financial Details
- Others
- Coromandel International Ltd.
- Business Description
- Product Portfolio
- Collaborations & Alliances
- Recent Developments
- Financial Details
- Others
- Zuari Farm Hub Ltd.
- Business Description
- Product Portfolio
- Collaborations & Alliances
- Recent Developments
- Financial Details
- Others
- Ray Nano & Research Centre
- Business Description
- Product Portfolio
- Collaborations & Alliances
- Recent Developments
- Financial Details
- Others
- Natural Plant Protection Ltd.
- Business Description
- Product Portfolio
- Collaborations & Alliances
- Recent Developments
- Financial Details
- Others
- National Fertilizers Ltd. (NFL)
- Business Description
- Product Portfolio
- Collaborations & Alliances
- Recent Developments
- Financial Details
- Others
- Rashtriya Chemicals & Fertilizers Ltd. (RCF)
- Business Description
- Product Portfolio
- Collaborations & Alliances
- Recent Developments
- Financial Details
- Others
- Others
- Business Description
- Product Portfolio
- Collaborations & Alliances
- Recent Developments
- Financial Details
- Others
- Indian Farmers Fertiliser Cooperative Ltd. (IFFCO)
- Company Profiles
- Disclaimer
| Segment | Sub-Segment |
|---|---|
| By Product Type |
|
| By Application Method |
|
| By Crop Type |
|
| By Technology Platform |
|
| By Distribution Channel |
|
| By Region |
|
Research Methodology
This study followed a structured approach comprising four key phases to assess the size and scope of the electro-oxidation market. The process began with thorough secondary research to collect data on the target market, related markets, and broader industry context. These findings, along with preliminary assumptions and estimates, were then validated through extensive primary research involving industry experts from across the value chain. To calculate the overall market size, both top-down and bottom-up methodologies were employed. Finally, market segmentation and data triangulation techniques were applied to refine and validate segment-level estimations.
Secondary Research
The secondary research phase involved gathering data from a wide range of credible and published sources. This step helped in identifying industry trends, defining market segmentation, and understanding the market landscape and value chain.
Sources consulted during this phase included:
- Company annual reports, investor presentations, and press releases
- Industry white papers and certified publications
- Trade directories and market-recognized databases
- Articles from authoritative authors and reputable journals
- Gold and silver standard websites
Secondary research was critical in mapping out the industry's value chain and monetary flow, identifying key market segments, understanding regional variations, and tracking significant industry developments.
Other key sources:
- Financial disclosures
- Industry associations and trade bodies
- News outlets and business magazines
- Academic journals and research studies
- Paid industry databases
Primary Research
To validate secondary data and gain deeper market insights, primary research was conducted with key stakeholders across both the supply and demand sides of the market.
On the demand side, participants included decision-makers and influencers from end-user industries—such as CIOs, CTOs, and CSOs—who provided first-hand perspectives on market needs, product usage, and future expectations.
On the supply side, interviews were conducted with manufacturers, industry associations, and institutional participants to gather insights into current offerings, product pipelines, and market challenges.
Primary interviews provided critical inputs such as:
- Market size and revenue data
- Product and service breakdowns
- Market forecasts
- Regional and application-specific trends
Stakeholders consulted included:
- Leading OEM and solution providers
- Channel and distribution partners
- End users across various applications
- Independent consultants and industry specialists
Market Size Estimation and Data Triangulation
- Identifying Key Market Participants (Secondary Research)
- Goal: To identify the major players or companies in the target market. This typically involves using publicly available data sources such as industry reports, market research publications, and financial statements of companies.
- Tools: Reports from firms like Gartner, Forrester, Euromonitor, Statista, IBISWorld, and others. Public financial statements, news articles, and press releases from top market players.
- Extracting Earnings of Key Market Participants
- Goal: To estimate the earnings generated from the product or service being analyzed. This step helps in understanding the revenue potential of each market player in a specific geography.
- Methods: Earnings data can be gathered from:
- Publicly available financial reports (for listed companies).
- Interviews and primary data sources from professionals, such as Directors, VPs, SVPs, etc. This is especially useful for understanding more nuanced, internal data that isn't publicly disclosed.
- Annual reports and investor presentations of key players.
- Data Collation and Development of a Relevant Data Model
- Goal: To collate inputs from both primary and secondary sources into a structured, data-driven model for market estimation. This model will incorporate key market KPIs and any independent variables relevant to the market.
- Key KPIs: These could include:
- Market size, growth rate, and demand drivers.
- Industry-specific metrics like market share, average revenue per customer (ARPC), or average deal size.
- External variables, such as economic growth rates, inflation rates, or commodity prices, that could affect the market.
- Data Modeling: Based on this data, the market forecasts are developed for the next 5 years. A combination of trend analysis, scenario modeling, and statistical regression might be used to generate projections.
- Scenario Analysis
- Goal: To test different assumptions and validate how sensitive the market is to changes in key variables (e.g., market demand, regulatory changes, technological disruptions).
- Types of Scenarios:
- Base Case: Based on current assumptions and historical data.
- Best-Case Scenario: Assuming favorable market conditions, regulatory environments, and technological advancements.
- Worst-Case Scenario: Accounting for adverse factors, such as economic downturns, stricter regulations, or unexpected disruptions.


