India Cards and Payments Market Report: Trends, Growth and Forecast (2026-2032)
By Instrument Type (Cards (Debit Card, Charge Card, ATM Card, Pre-Paid Card, Credit Card, Store Card), Mobile Wallets, Cheques, Others), By Card Type (Contact Smart Card, Contactless Smart Card, Non-Smart Card), By Type of Payments (B2B, B2C, C2C, C2B (E-commerce Shopping, Payment at POS Terminals)), By Transaction Type (Domestic, Foreign), By Application (Food & Groceries, Health & Pharmacies, Travel & Tourism, Hospitality, Others (Media & Entertainment)) ... Read more
|
Major Players
|
India Cards and Payments Market Statistics and Insights, 2026
- Market Size Statistics
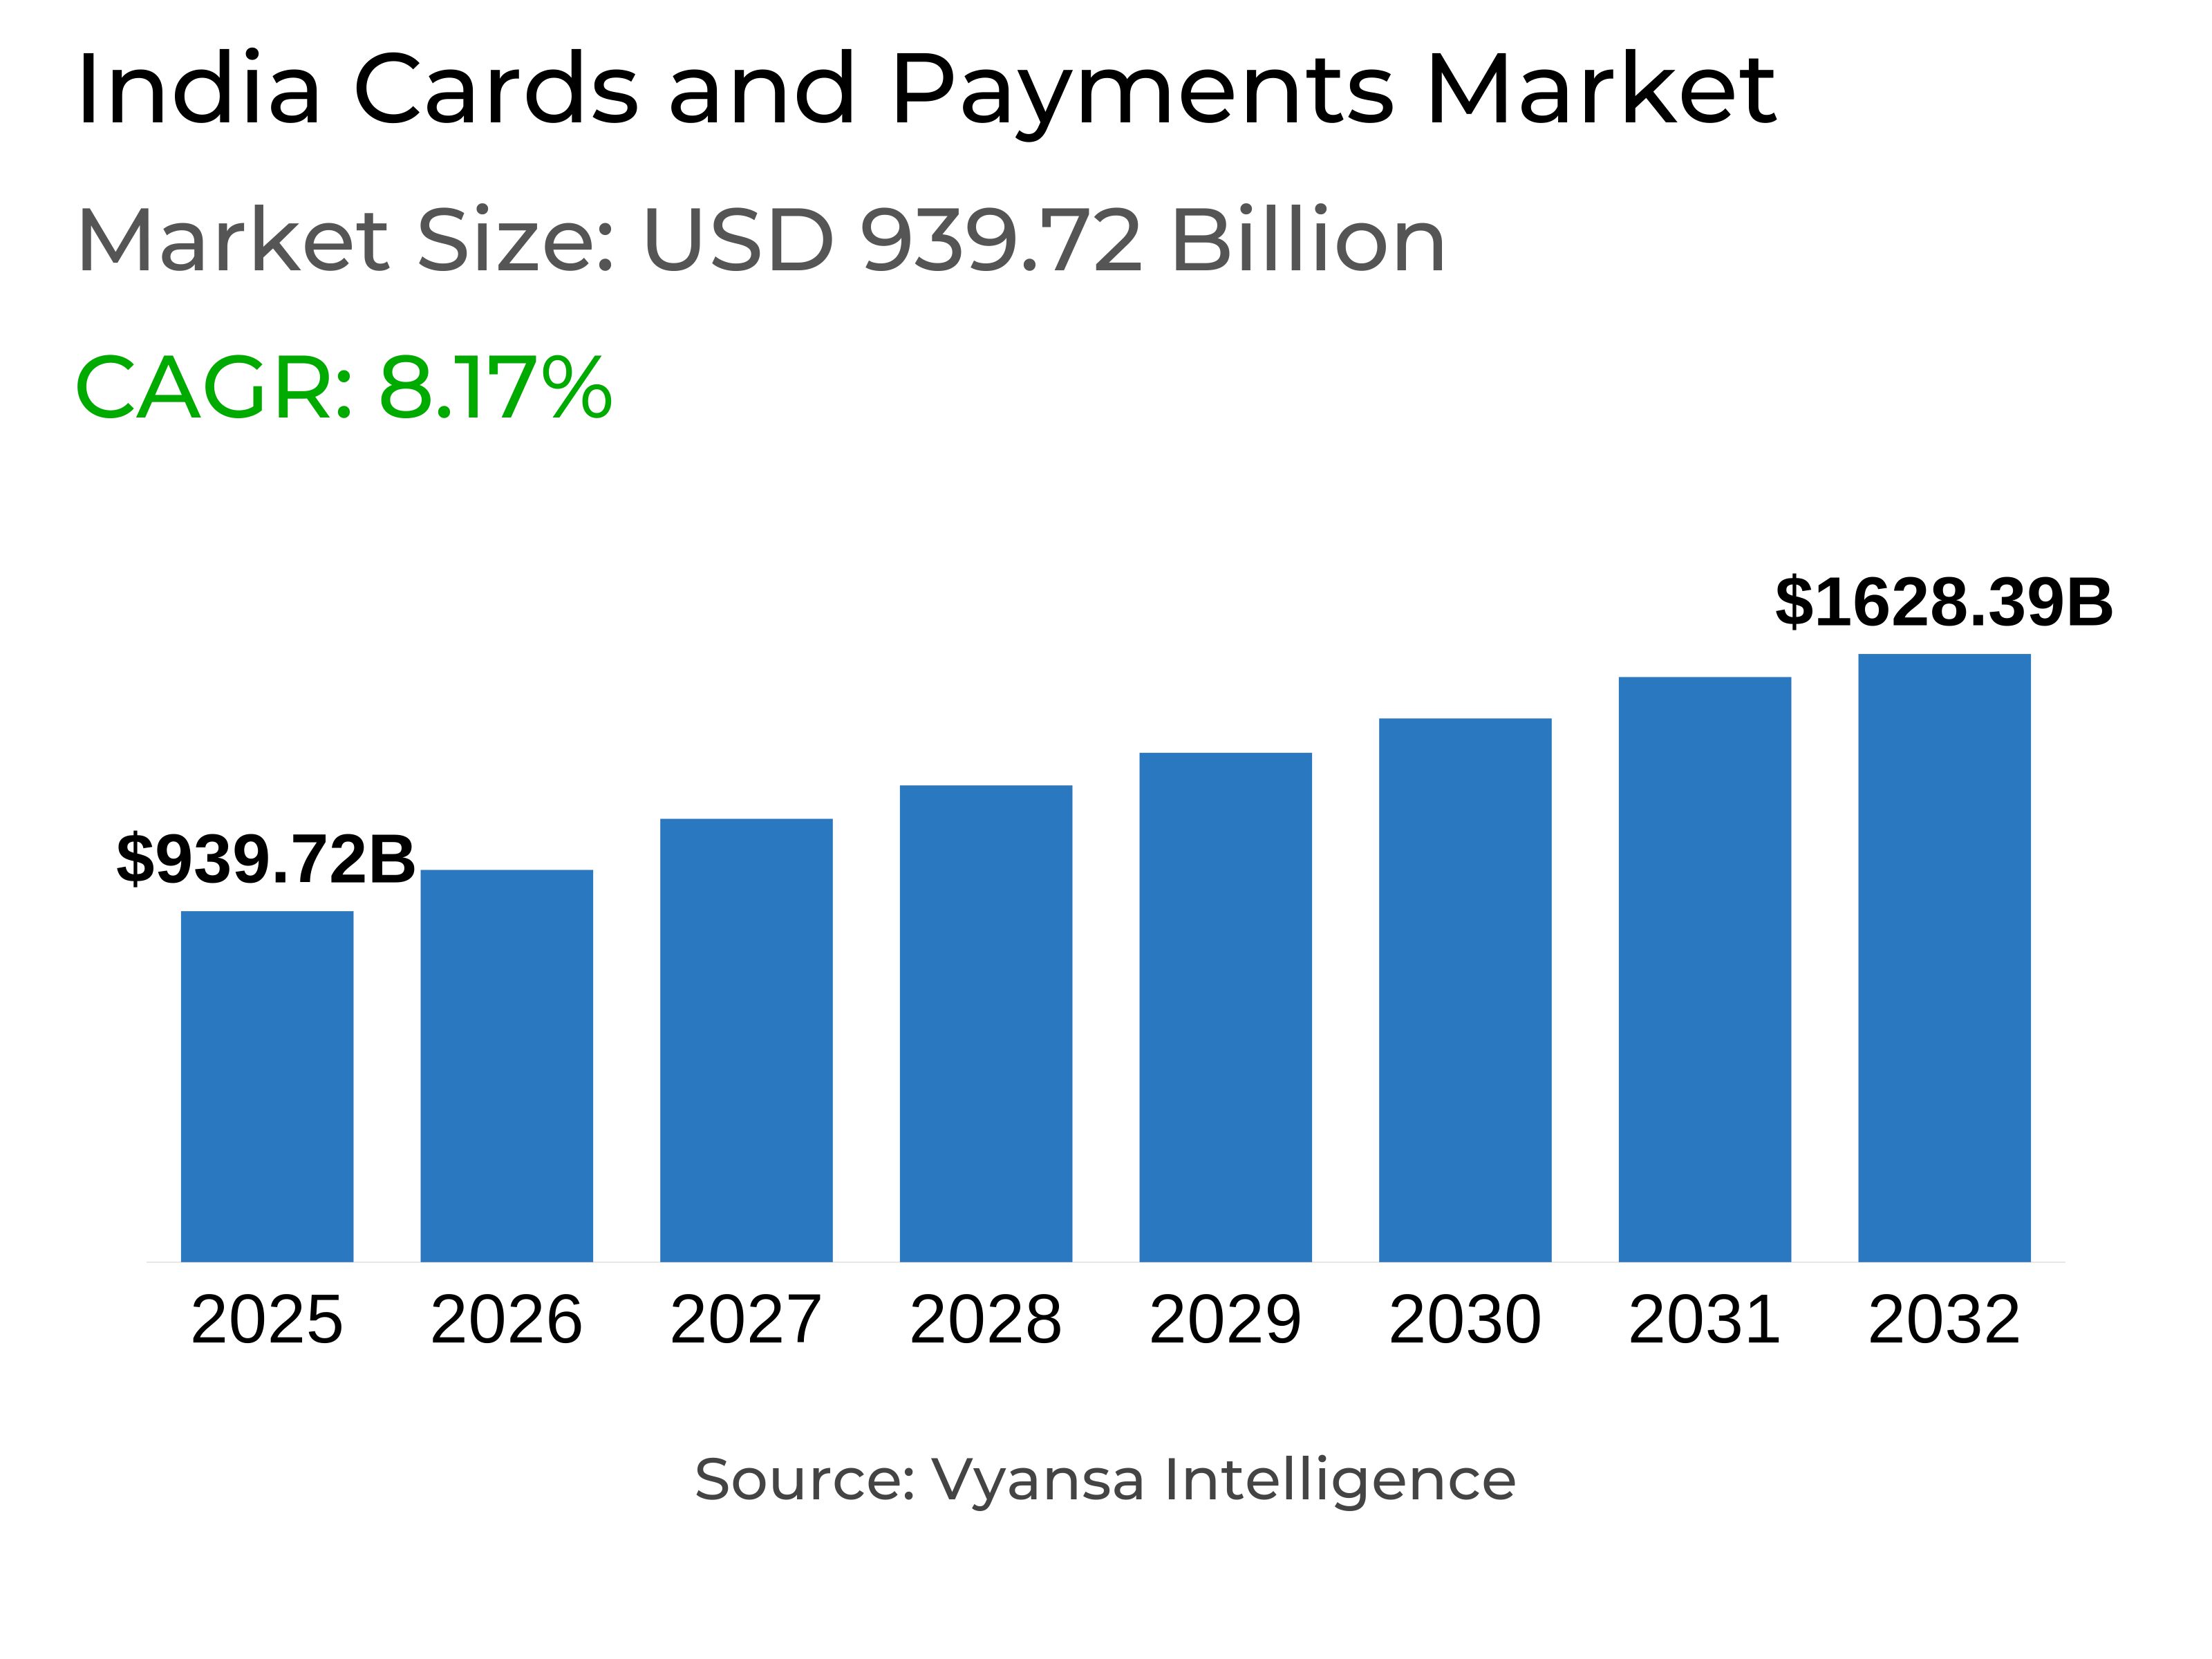
- Cards and Payments in India is estimated at $ 939.72 Billion.
- The market size is expected to grow to $ 1628.39 Billion by 2032.
- Market to register a CAGR of around 8.17% during 2026-32.
- Instrument Type Shares
- Cards grabbed market share of 75%.
- Cards to witness a volume CAGR of around 3.3%.
- Competition
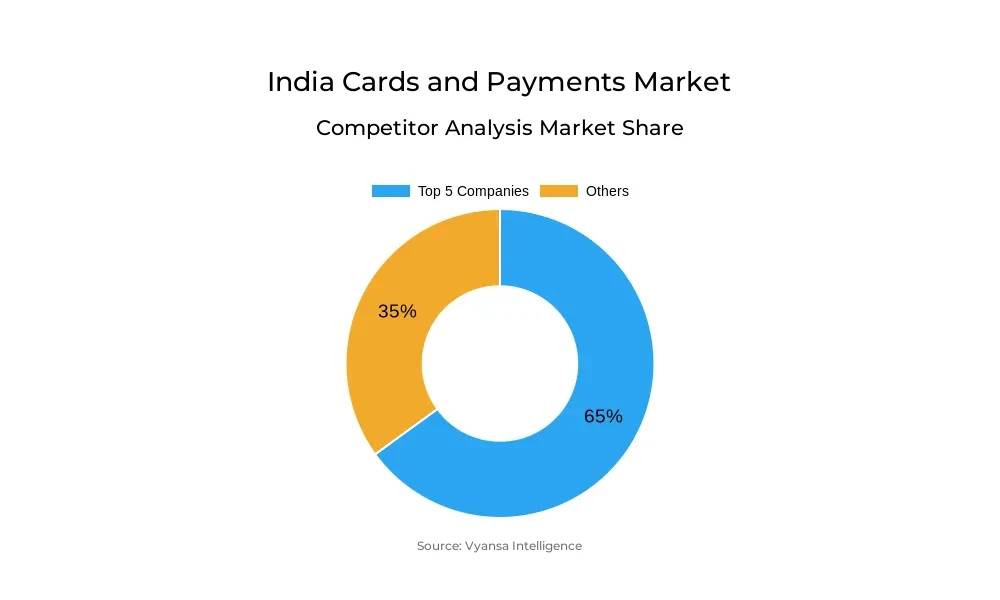
- More than 15 companies are actively engaged in producing Cards and Payments in India.
- Top 5 companies acquired 65% of the market share.
- American Express Co, Canara Bank, Bank of Baroda, HDFC Bank Ltd, ICICI Bank Ltd etc., are few of the top companies.
- Card Type
- Contactless Smart Card grabbed 70% of the market.
India Cards and Payments Market Outlook
The Indian cards and payments market is expected to grow robustly, with growth expanding from USD 939.72 billion to USD 1,628.39 billion during 2032. This will be due to the government's ongoing efforts towards financial inclusion under initiatives such as PMJDY, which opens the formal banking channel to more people and stimulates the use of debit cards. Though debit cards will experience steady but restrained growth, the true momentum will be driven by credit cards and electronic payment methods as End users become increasingly financially aware and embrace diversified payment modes.
Credit cards are poised to capture more ground through changing buying behavior, growth in online shopping, and compelling rewards available through co-branded cards. Banks' alliances with leading brands such as foodservice aggregators, hotel companies, and online commerce sites will help spur End users adoption through discounts, rewards for loyalty, and value-added propositions. These customized services are especially attractive in a price-conscious environment where End users want the best value out of their expenditures.
Parallelly, UPI-based digital payments will continue to be the most rapidly growing mode, transforming India payment landscape. With over 80% smartphone penetration and extensive merchant acceptance, QR-based UPI payments are replacing cash for daily transactions, particularly in small-value transactions. However, issues such as settlement time lags and infrastructure expense for small merchants in semi-urban and rural areas could check the rate of adoption unless properly addressed.
In the future, contactless smart cards, which presently possess a market share of about 70%, will remain dominant in point-of-sale transactions. The overall cards segment is likely to register a healthy volume CAGR of 3.3% with increasing e-commerce, policy reforms like card portability, and growing competition among card operators such as RuPay, Visa, and Mastercard. As End users move from cash to increasingly digital and card-based formats, India payments sector is poised for stable expansion.
India Cards and Payments Market Growth Driver
Government Push Towards Financial Inclusion Boosts Card Adoption
The Indian government's national mission to ensure financial inclusion continues to pull increasing numbers of the population into the formal banking system. This widening of access to banks heightens awareness of financial products and facilitates the wider use of financial cards among End users.
By the Pradhan Mantri Jan Dhan Yojana (PMJDY), a large number of the unbanked public become bank account holders. Since debit cards are distributed while new accounts are opened, this program serves as a key driving force for consistent growth in the number of debit cards distributed, further solidifying the contribution of government policy in propelling overall growth of the cards market.
India Cards and Payments Market Trend
Accelerating Transition to Online Payments
Inexpensive smartphones and cheap mobile internet plans have increased mobile internet penetration in India, with almost 80% of the populace having a smartphone in 2024. This access is transforming End users spending behavior, as electronic payments via Unified Payment Interface (UPI) and credit cards are becoming increasingly popular. UPI, in particular, stands out as the fastest-growing payment mode, supported by ease of usage and widespread merchant acceptance. Its convenience has enabled it to dominate small-value transactions, traditionally led by debit cards.
At the same time, shifting purchasing behavior is driving End users toward online platforms for a wide range of purchases. This behavioral change is reflected in the rising use of credit cards, with the majority of transactions now taking place online. The strong adoption of UPI-based QR payments and the growth of online credit card usage underline the clear End users shift from offline to online transactions.
Unlock Market Intelligence
Explore the market potential with our data-driven report
India Cards and Payments Market Opportunity
Growing usage of co-branded cards
Co-branded cards will be a major growth driver for the cards and payments market in India, as issuers seek to differentiate their products and win new End users. With debit cards projected to be close to saturation and credit cards still at an emerging stage, co-branded cards will be a major driver of volumes. These cards, branded in collaboration with foodservice aggregators, hotel chains, or online marketplaces, will attract End users by offering customized benefits associated with their regular expenditures.
Where there is high food inflation and watchful discretionary spending, End users will seek value more intensely in the form of rewards, discounts, and exclusivity. Co-branded alliances with well-known names, both on-line and major hospitality chains, will feed customer retention as well as acquisition. With strengthening demand, issuers will use these alliances to drive payment card usage higher and increase market share by segment.
Unlock Market Intelligence
Explore the market potential with our data-driven report
India Cards and Payments Market Segmentation Analysis

By Instrument Type
- Cards
- Mobile Wallets
- Cheques
- Others
The segment with highest market share under Instrument Type is Cards, which contributed to just under 75% of the market. The expansion of cards is strongly related to India drive towards financial inclusion, with debit cards issued under schemes such as Pradhan Mantri Jan Dhan Yojana increasing steadily. Debit cards lead by volume, while credit cards are growing faster, aided by shifting buying behavior, internet shopping expansion, and increased consumer awareness.
In the future, cards are likely to post a volume CAGR of approximately 3.3%, demonstrating both constant debit card usage and increased credit card adoption. Although UPI transactions are growing more rapidly, cards stay firm, especially through co-branded products and their popularity in online and offline transactions. This equilibrium keeps cards as one of the main pillars within India changing payment landscape.
By Card Type
- Contact Smart Card
- Contactless Smart Card
- Non-Smart Card
The most dominant market share in the Card Type is held by Contactless Smart Cards, which held about 70% market share. Their acceptance has been fueled by broad acceptance by merchant outlets, convenience and speed of transactions, and the growing ease of Indian consumers with tap-and-pay technology. Debit and credit cards are increasingly pre-equipped with contactless capabilities, and these cards have become the default option among consumers in urban areas.
The requirement for contactless smart cards is augmented by shifting lifestyles and the desire for efficiency and speed in daily purchases. As e-commerce expenditure and co-branded card introductions bring value through rewards and customised benefits, the contactless segment is poised to continue its dominance. With digital uptake gaining momentum, contactless smart cards will continue to dominate as the predominant card type in India payments market.
Top Companies in India Cards and Payments Market
The top companies operating in the market include American Express Co, Canara Bank, Bank of Baroda, HDFC Bank Ltd, ICICI Bank Ltd, SBI Cards & Payment Services Ltd, Axis Bank Ltd, State Bank of India, Intrex India, Standard Chartered Bank India Branches, etc., are the top players operating in the India Cards and Payments Market.
Frequently Asked Questions
Related Report
1. Market Segmentation
1.1. Research Scope
1.2. Research Methodology
1.3. Definitions and Assumptions
2. Executive Summary
3. India Cards and Payments Market Policies, Regulations, and Standards
4. India Cards and Payments Market Dynamics
4.1. Growth Factors
4.2. Challenges
4.3. Trends
4.4. Opportunities
5. India Cards and Payments Market Statistics, 2022-2032F
5.1. Market Size & Growth Outlook
5.1.1. By Revenues in US$ Million
5.2. Market Segmentation & Growth Outlook
5.2.1. By Instrument Type
5.2.1.1. Cards- Market Insights and Forecast 2022-2032, USD Million
5.2.1.1.1. Debit Card- Market Insights and Forecast 2022-2032, USD Million
5.2.1.1.2. Charge Card- Market Insights and Forecast 2022-2032, USD Million
5.2.1.1.3. ATM Card- Market Insights and Forecast 2022-2032, USD Million
5.2.1.1.4. Pre-Paid Card- Market Insights and Forecast 2022-2032, USD Million
5.2.1.1.5. Credit Card- Market Insights and Forecast 2022-2032, USD Million
5.2.1.1.6. Store Card- Market Insights and Forecast 2022-2032, USD Million
5.2.1.2. Mobile Wallets- Market Insights and Forecast 2022-2032, USD Million
5.2.1.3. Cheques- Market Insights and Forecast 2022-2032, USD Million
5.2.1.4. Others- Market Insights and Forecast 2022-2032, USD Million
5.2.2. By Card Type
5.2.2.1. Contact Smart Card- Market Insights and Forecast 2022-2032, USD Million
5.2.2.2. Contactless Smart Card- Market Insights and Forecast 2022-2032, USD Million
5.2.2.3. Non-Smart Card- Market Insights and Forecast 2022-2032, USD Million
5.2.3. By Type of Payments
5.2.3.1. B2B- Market Insights and Forecast 2022-2032, USD Million
5.2.3.2. B2C- Market Insights and Forecast 2022-2032, USD Million
5.2.3.3. C2C- Market Insights and Forecast 2022-2032, USD Million
5.2.3.4. C2B- Market Insights and Forecast 2022-2032, USD Million
5.2.3.4.1. E-commerce Shopping- Market Insights and Forecast 2022-2032, USD Million
5.2.3.4.2. Payment at POS Terminals- Market Insights and Forecast 2022-2032, USD Million
5.2.4. By Transaction Type
5.2.4.1. Domestic- Market Insights and Forecast 2022-2032, USD Million
5.2.4.2. Foreign- Market Insights and Forecast 2022-2032, USD Million
5.2.5. By Application
5.2.5.1. Food & Groceries- Market Insights and Forecast 2022-2032, USD Million
5.2.5.2. Health & Pharmacies- Market Insights and Forecast 2022-2032, USD Million
5.2.5.3. Travel & Tourism- Market Insights and Forecast 2022-2032, USD Million
5.2.5.4. Hospitality- Market Insights and Forecast 2022-2032, USD Million
5.2.5.5. Others (Media & Entertainment)- Market Insights and Forecast 2022-2032, USD Million
5.2.6. By Competitors
5.2.6.1. Competition Characteristics
5.2.6.2. Market Share & Analysis
6. India Cards Market Statistics, 2022-2032F
6.1. Market Size & Growth Outlook
6.1.1. By Revenues in US$ Million
6.2. Market Segmentation & Growth Outlook
6.2.1. By Card Type- Market Insights and Forecast 2022-2032, USD Million
6.2.2. By Type of Payments- Market Insights and Forecast 2022-2032, USD Million
6.2.3. By Transaction Type- Market Insights and Forecast 2022-2032, USD Million
6.2.4. By Application- Market Insights and Forecast 2022-2032, USD Million
7. India Mobile Wallets Market Statistics, 2022-2032F
7.1. Market Size & Growth Outlook
7.1.1. By Revenues in US$ Million
7.2. Market Segmentation & Growth Outlook
7.2.1. By Type of Payments- Market Insights and Forecast 2022-2032, USD Million
7.2.2. By Transaction Type- Market Insights and Forecast 2022-2032, USD Million
7.2.3. By Application- Market Insights and Forecast 2022-2032, USD Million
8. India Cheques Market Statistics, 2022-2032F
8.1. Market Size & Growth Outlook
8.1.1. By Revenues in US$ Million
8.2. Market Segmentation & Growth Outlook
8.2.1. By Type of Payments- Market Insights and Forecast 2022-2032, USD Million
8.2.2. By Transaction Type- Market Insights and Forecast 2022-2032, USD Million
8.2.3. By Application- Market Insights and Forecast 2022-2032, USD Million
9. Competitive Outlook
9.1. Company Profiles
9.1.1. HDFC Bank Ltd
9.1.1.1. Business Description
9.1.1.2. Product Portfolio
9.1.1.3. Collaborations & Alliances
9.1.1.4. Recent Developments
9.1.1.5. Financial Details
9.1.1.6. Others
9.1.2. ICICI Bank Ltd
9.1.2.1. Business Description
9.1.2.2. Product Portfolio
9.1.2.3. Collaborations & Alliances
9.1.2.4. Recent Developments
9.1.2.5. Financial Details
9.1.2.6. Others
9.1.3. SBI Cards & Payment Services Ltd
9.1.3.1. Business Description
9.1.3.2. Product Portfolio
9.1.3.3. Collaborations & Alliances
9.1.3.4. Recent Developments
9.1.3.5. Financial Details
9.1.3.6. Others
9.1.4. Axis Bank Ltd
9.1.4.1. Business Description
9.1.4.2. Product Portfolio
9.1.4.3. Collaborations & Alliances
9.1.4.4. Recent Developments
9.1.4.5. Financial Details
9.1.4.6. Others
9.1.5. State Bank of India
9.1.5.1. Business Description
9.1.5.2. Product Portfolio
9.1.5.3. Collaborations & Alliances
9.1.5.4. Recent Developments
9.1.5.5. Financial Details
9.1.5.6. Others
9.1.6. American Express Co
9.1.6.1. Business Description
9.1.6.2. Product Portfolio
9.1.6.3. Collaborations & Alliances
9.1.6.4. Recent Developments
9.1.6.5. Financial Details
9.1.6.6. Others
9.1.7. Canara Bank
9.1.7.1. Business Description
9.1.7.2. Product Portfolio
9.1.7.3. Collaborations & Alliances
9.1.7.4. Recent Developments
9.1.7.5. Financial Details
9.1.7.6. Others
9.1.8. Bank of Baroda
9.1.8.1. Business Description
9.1.8.2. Product Portfolio
9.1.8.3. Collaborations & Alliances
9.1.8.4. Recent Developments
9.1.8.5. Financial Details
9.1.8.6. Others
9.1.9. Intrex India
9.1.9.1. Business Description
9.1.9.2. Product Portfolio
9.1.9.3. Collaborations & Alliances
9.1.9.4. Recent Developments
9.1.9.5. Financial Details
9.1.9.6. Others
9.1.10. Standard Chartered Bank India Branches
9.1.10.1. Business Description
9.1.10.2. Product Portfolio
9.1.10.3. Collaborations & Alliances
9.1.10.4. Recent Developments
9.1.10.5. Financial Details
9.1.10.6. Others
10. Disclaimer
| Segment | Sub-Segment |
|---|---|
| By Instrument Type |
|
| By Card Type |
|
| By Type of Payments |
|
| By Transaction Type |
|
| By Application |
|
Research Methodology
This study followed a structured approach comprising four key phases to assess the size and scope of the electro-oxidation market. The process began with thorough secondary research to collect data on the target market, related markets, and broader industry context. These findings, along with preliminary assumptions and estimates, were then validated through extensive primary research involving industry experts from across the value chain. To calculate the overall market size, both top-down and bottom-up methodologies were employed. Finally, market segmentation and data triangulation techniques were applied to refine and validate segment-level estimations.
Secondary Research
The secondary research phase involved gathering data from a wide range of credible and published sources. This step helped in identifying industry trends, defining market segmentation, and understanding the market landscape and value chain.
Sources consulted during this phase included:
- Company annual reports, investor presentations, and press releases
- Industry white papers and certified publications
- Trade directories and market-recognized databases
- Articles from authoritative authors and reputable journals
- Gold and silver standard websites
Secondary research was critical in mapping out the industry's value chain and monetary flow, identifying key market segments, understanding regional variations, and tracking significant industry developments.
Other key sources:
- Financial disclosures
- Industry associations and trade bodies
- News outlets and business magazines
- Academic journals and research studies
- Paid industry databases
Primary Research
To validate secondary data and gain deeper market insights, primary research was conducted with key stakeholders across both the supply and demand sides of the market.
On the demand side, participants included decision-makers and influencers from end-user industries—such as CIOs, CTOs, and CSOs—who provided first-hand perspectives on market needs, product usage, and future expectations.
On the supply side, interviews were conducted with manufacturers, industry associations, and institutional participants to gather insights into current offerings, product pipelines, and market challenges.
Primary interviews provided critical inputs such as:
- Market size and revenue data
- Product and service breakdowns
- Market forecasts
- Regional and application-specific trends
Stakeholders consulted included:
- Leading OEM and solution providers
- Channel and distribution partners
- End users across various applications
- Independent consultants and industry specialists
Market Size Estimation and Data Triangulation
- Identifying Key Market Participants (Secondary Research)
- Goal: To identify the major players or companies in the target market. This typically involves using publicly available data sources such as industry reports, market research publications, and financial statements of companies.
- Tools: Reports from firms like Gartner, Forrester, Euromonitor, Statista, IBISWorld, and others. Public financial statements, news articles, and press releases from top market players.
- Extracting Earnings of Key Market Participants
- Goal: To estimate the earnings generated from the product or service being analyzed. This step helps in understanding the revenue potential of each market player in a specific geography.
- Methods: Earnings data can be gathered from:
- Publicly available financial reports (for listed companies).
- Interviews and primary data sources from professionals, such as Directors, VPs, SVPs, etc. This is especially useful for understanding more nuanced, internal data that isn't publicly disclosed.
- Annual reports and investor presentations of key players.
- Data Collation and Development of a Relevant Data Model
- Goal: To collate inputs from both primary and secondary sources into a structured, data-driven model for market estimation. This model will incorporate key market KPIs and any independent variables relevant to the market.
- Key KPIs: These could include:
- Market size, growth rate, and demand drivers.
- Industry-specific metrics like market share, average revenue per customer (ARPC), or average deal size.
- External variables, such as economic growth rates, inflation rates, or commodity prices, that could affect the market.
- Data Modeling: Based on this data, the market forecasts are developed for the next 5 years. A combination of trend analysis, scenario modeling, and statistical regression might be used to generate projections.
- Scenario Analysis
- Goal: To test different assumptions and validate how sensitive the market is to changes in key variables (e.g., market demand, regulatory changes, technological disruptions).
- Types of Scenarios:
- Base Case: Based on current assumptions and historical data.
- Best-Case Scenario: Assuming favorable market conditions, regulatory environments, and technological advancements.
- Worst-Case Scenario: Accounting for adverse factors, such as economic downturns, stricter regulations, or unexpected disruptions.


