Belgium Healthy Snacks Market Report: Trends, Growth and Forecast (2026-2032)
By Category (Low/No Fat & Salt Snacks (Low Fat Snacks, No Fat Snacks, Low Salt Snacks, No Salt Snacks), Low/No Sugar & Caffeine Snacks (Low Sugar Snacks, No Sugar Snacks, No Added Sugar Snacks, No Caffeine Snacks), Allergy / Free-from / Specialized Diet Snacks (Gluten-Free Snacks, Dairy-Free Snacks, Lactose-Free Snacks, Hypoallergenic Snacks, Keto Snacks, Meat-Free Snacks, No Allergens Snacks, Plant-Based Snacks, Vegan Snacks, Vegetarian Snacks, Weight Management Snacks), Fortified / Nutrient-Enhanced Snacks (Good Source of Antioxidants Snacks, Good Source of Minerals Snacks, Good Source of Omega-3s Snacks, Good Source of Vitamins Snacks, High Fibre Snacks, High Protein Snacks, Probiotic Snacks, Superfruit Snacks), Health & Wellness-Oriented Snacks (Bone and Joint Health Snacks, Brain Health and Memory Snacks, Cardiovascular Health Snacks, Digestive Health Snacks, Energy Boosting Snacks, Immune Support Snacks, Skin Health Snacks, Vision Health Snacks), Natural Snacks, Organic Snacks), By Product Type (Meat Snacks, Nuts, Seeds & Trail Mixes, Dried Fruit Snacks, Cereal & Granola Bars, Others), By Packaging (Bag & Pouches, Boxes, Cans, Jars, Others), By Sales Channel (Retail Offline, Retail Online) ... Read more
|
Major Players
|
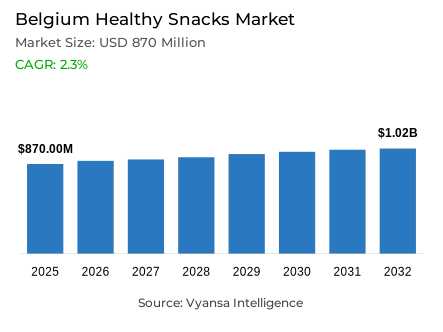
Belgium Healthy Snacks Market Statistics and Insights, 2026
- Market Size Statistics
- Healthy snacks market size in Belgium was estimated at USD 870 million in 2025.
- The market size is expected to grow to USD 1.02 billion by 2032.
- Market to register a CAGR of around 2.3% during 2026-32.
- Category Shares
- Allergy / free-from / specialized diet snacks grabbed market share of 40%.
- Competition
- More than 10 companies are actively engaged in producing healthy snacks in Belgium.
- Top 5 companies acquired around 20% of the market share.
- Kellanova, Mondelez International Inc, Boni Holding AD, General Mills Inc, Roger & Roger SA etc., are few of the top companies.
- Sales Channel
- Retail offline grabbed 70% of the market.
Belgium Healthy Snacks Market Outlook
The Belgium healthy snacks market is experiencing a major change with snacking being a major component of daily caloric consumption. The market is estimated to reach 870 million dollars in 2025, and it is expected to reach 1.02 billion dollars in 2032, with a compound annual growth rate of about 2.3% between 2026 and 2032. This development is motivated by a change to active nutrition where people no longer just count calories but are now demanding snacks that offer functional advantages like muscle building, better digestion, and immunity.
One of the main market forces is the need to reduce sugar. No-sugar and stevia-sweetened versions of major brands like Mentos and Leonidas are also being offered to attract health-conscious consumers and younger audiences, including Generation Z. Functionality is also a major trend, with protein-enriched bars and high-fiber snacks offered by competitors like Nature Valley and Smartful gaining momentum. Also, there is an increase in the market of guilt-free chocolate and gum that use vitamins, minerals, and natural sweeteners.
The shift to a plant-based lifestyle also supports the industry, and PepsiCo dominates the vegetarian snack market with the brands of Lay and Doritos. The health decisions are becoming more and more interconnected with ethical issues of animal welfare and environmental sustainability, which results in the increased number of vegan and organic products. Retailer-owned brands like Delhaize and Carrefour are also successfully developing their own healthy lines to provide low-cost, high-Nutri-Score alternatives to branded products.
Physical stores continue to dominate sales channel, and Retail Offline controls 70% of the market. Supermarkets are the main center of healthy snacks, and they provide the wide range and shelf presence that consumers seek. Nevertheless, the vegan and organic snacks niche is growing into specialised organic networks and retail online. With the market moving towards 2032, functional health claims coupled with ethical transparency will be critical in brands that want to win over the changing snacking trends in Belgium.

Belgium Healthy Snacks Market Growth Driver
Obesity and Inactivity Concerns Reinforcing Demand for Nutritionally Enhanced Snacking
The health risk awareness is forcing consumers to demand snacks with lower sugar content and higher nutritional content. In Belgium, OECD data indicates that 17% of adults are obese and 29% do not exercise according to the recommended guidelines, which makes weight control a priority in the population. This health burden supports the need to develop healthier snack formats, including reduced-sugar confectionery and protein- or fibre-enriched snack bars, and this creates favourable conditions of functional snack innovation.
With snacking replacing more and more of the full-course meals of time-starved consumers, brands that provide healthier daily options that are viewed as convenient, delicious, and reliable gain consumer interest. Reduced sugar launches or active benefits fit this attitude and warrant higher prices, even when consumers are label-reading and expecting obvious health value. The prevalence of obesity, the issue of physical inactivity, and the tendency to snack on meal replacements create a structural need of nutritionally enriched snack formats that can be used to promote wellness objectives. This health-based demand shift, therefore, provides long-term prospects to brands that exhibit genuine functional advantages and open nutritional positioning.
Belgium Healthy Snacks Market Challenge
Entrenched Sweetness Preferences Slowing Sugar Reduction and Reformulation Adoption
The high propensities towards sweet tastes make reformulation a risky venture to a brand even when the consumers are willing to consume healthier snacks. According to Sciensano, the average daily consumption of sugary soft drinks in Belgium is 132 grams, and only a quarter of the population says that they never drink sugary soft drinks. As a result, the expectations of high sugar remain, and it is difficult to make no-sugar confectionery or functional bars successful without affecting the quality of taste and acceptance by consumers.
At the same time, businesses are under increased pressure to determine whether their product and marketing decisions are encouraging healthier diets. The Business Impact Assessment on Obesity by Sciensano examines 33 large food corporations and finds that there are gaps in their pledges like the availability of healthier foods and the marketing of unhealthy foods to children. Sealing these loopholes would demand significant investment in reformulation and governance frameworks, which may slow down innovation processes. The conflict between consumer sweetness preferences and regulatory or public-health pressures presents strategic complexity to reformulation efforts. Brands are forced to juggle between preserving palatability, cost competitiveness, and health positioning and negotiating the changing corporate responsibility demands.
Unlock Market Intelligence
Explore the market potential with our data-driven report
Belgium Healthy Snacks Market Trend
Nutri-Score Benchmarking Accelerating Functional and Nutrition-Optimised Snack Innovation
Positioning based on simple nutrition cues makes functional and lower-sugar positioning more organized as consumers compare snacks efficiently. According to the Nutri-Score Steering Committee of Belgium, 80% of consumers are familiar with Nutri-Score, and 59% of consumers indicate that the label is helpful. In this regard, brands are under pressure to enhance product composition, especially to lower sugar and saturated fat and raise fibre or protein content, thus establishing standardized points of reference on nutritional quality comparisons.
As a result, active advantages like high protein, high fibre, added vitamins, and oral health support are being actively added to mainstream snack formats, including bars and sugar-free gum. Such assertions assist brands to stand out in overcrowded shelves and attract consumers who seek indulgence with a clear health justification at the point of purchase. The adoption of Nutri-Score increases the rate of functional innovation because manufacturers re-formulate to obtain favourable ratings without altering taste profiles. This trend is a critical category development to nutrition-optimised formulations backed by transparent and consumer-friendly labeling systems that allow informed buying choices and competitive differentiation based on quantifiable nutritional excellence.
Belgium Healthy Snacks Market Opportunity
High Digital Commerce Penetration Scaling Vegan, Functional, and Premium Snack Discovery
The increased use of online shopping offers viable avenues to expand vegan and functional snack lines that are still limited in most of the traditional outlets. According to the FPS Economy of Belgium, 76.08% of the Belgians will shop online in 2024, and 94.62% of households have internet access at home. This strong digital penetration facilitates online discovery of niche snacks that are positioned as vegan, low-sugar, or high-protein, allowing specialty products to reach addressable consumer segments effectively.
To manufacturers, retail online enables more assortments and focused narratives about ethical and health advantages- communication that is hard to achieve on busy physical shelves. By maximising pack formats to deliver and offer transparent nutrition information, brands can turn intent-driven shoppers into higher-value repeat purchasers. Digital platforms facilitate comprehensive ingredient disclosure, functional benefit training, and value-based positioning that underpin high prices and trial creation. The retail online opportunity enables the brands to circumvent the traditional retail sales channel limitations and create direct consumer relationships via digital-first marketing approaches, which is in line with the highly connected, digitally engaged consumer base in Belgium that is seeking specialised health and ethical snack alternatives.
Unlock Market Intelligence
Explore the market potential with our data-driven report
Belgium Healthy Snacks Market Segmentation Analysis
By Category
- Low/No Fat & Salt Snacks
- Low Fat Snacks
- No Fat Snacks
- Low Salt Snacks
- No Salt Snacks
- Low/No Sugar & Caffeine Snacks
- Low Sugar Snacks
- No Sugar Snacks
- No Added Sugar Snacks
- No Caffeine Snacks
- Allergy / Free-from / Specialized Diet Snacks
- Gluten-Free Snacks
- Dairy-Free Snacks
- Lactose-Free Snacks
- Hypoallergenic Snacks
- Keto Snacks
- Meat-Free Snacks
- No Allergens Snacks
- Plant-Based Snacks
- Vegan Snacks
- Vegetarian Snacks
- Weight Management Snacks
- Fortified / Nutrient-Enhanced Snacks
- Good Source of Antioxidants Snacks
- Good Source of Minerals Snacks
- Good Source of Omega-3s Snacks
- Good Source of Vitamins Snacks
- High Fibre Snacks
- High Protein Snacks
- Probiotic Snacks
- Superfruit Snacks
- Health & Wellness-Oriented Snacks
- Bone and Joint Health Snacks
- Brain Health and Memory Snacks
- Cardiovascular Health Snacks
- Digestive Health Snacks
- Energy Boosting Snacks
- Immune Support Snacks
- Skin Health Snacks
- Vision Health Snacks
- Natural Snacks
- Organic Snacks
The segment has the highest share around the category in the Belgium healthy snacks market, where Allergy / Free-from / Specialized Diet Snacks grabbed a market share of 40%. This dominance is fueled by a growing aversion to "unfavorable" ingredients and a rising preference for vegetarian and vegan options. PepsiCo has recently overtaken Haribo to lead the vegetarian snacks space, reflecting how mainstream brands are pivoting toward specialized diets to meet consumer demand for meat-free alternatives and cleaner ingredient lists.
Within this 40% share, gluten-free and vegan claims are no longer niche but are becoming standard requirements for many shoppers. High-profile product launches, such as Dandoy’s vegan biscuits and Generous cookies, highlight the shift toward ethical and specialized snacking. As consumers continue to scrutinize labels for trans fats and high sugar, this segment is expected to remain the market's largest pillar, supported by both premium artisanal brands and expanded private label health ranges.

By Sales Channel
- Retail Offline
- Retail Online
The segment has the highest share around the Sales Channel is Retail Offline, which grabbed 70% of the market. Supermarkets and hypermarkets are the leading contributors to this share, serving as the primary point of purchase for Belgian households. These retailers have become innovation hubs, with chains like Delhaize and Albert Heijn aggressively expanding their "better-for-you" private label lines. This offline dominance is supported by the consumer's desire to compare Nutri-Scores and ingredient labels physically before purchasing.
While offline retail holds the majority of the market, the landscape is shifting toward more specialized brick-and-mortar outlets. Small local grocers and organic specialists are increasingly stocking niche vegan and functional brands, such as Le Moulin du Pivert and TerraSana, to cater to urban, health-conscious shoppers. Although retail online is expanding, the 70% share held by offline retail underscores the continued importance of convenience and immediate accessibility in the Belgian snacking routine through 2032.
List of Companies Covered in Belgium Healthy Snacks Market
The companies listed below are highly influential in the Belgium healthy snacks market, with a significant market share and a strong impact on industry developments.
- Kellanova
- Mondelez International Inc
- Boni Holding AD
- General Mills Inc
- Roger & Roger SA
- Unilever Group
- PepsiCo Inc
- Haribo GmbH & Co KG
- Ecotone
- Ricola AG
Competitive Landscape
Belgium healthy snacks landscape is shaped by strong demand for reduced sugar, functional, and vegetarian products, with both multinational brands and private label competing aggressively. PepsiCo has taken a narrow lead in vegetarian snacks, driven by Lay’s and Doritos, overtaking Haribo, although Haribo remains a key brand player. In confectionery, premium brands such as Godiva and Leonidas are differentiating through no sugar and added functional ingredients, while Perfetti Van Melle targets Gen Z with no sugar Mentos variants. Private label retailers including Delhaize, Colruyt, Carrefour, and Albert Heijn compete on both price and expanding vegan and organic assortments. Growth opportunities centre on protein and energy bars, functional gum, vegan niches, and ethically positioned organic products combining health, sustainability, and strong Nutri-Score credentials.
Frequently Asked Questions
Related Report
1. Market Segmentation
1.1. Research Scope
1.2. Research Methodology
1.3. Definitions and Assumptions
2. Executive Summary
3. Belgium Healthy Snacks Market Policies, Regulations, and Standards
4. Belgium Healthy Snacks Market Dynamics
4.1. Growth Factors
4.2. Challenges
4.3. Trends
4.4. Opportunities
5. Belgium Healthy Snacks Market Statistics, 2022-2032F
5.1. Market Size & Growth Outlook
5.1.1.By Revenues in USD Million
5.2. Market Segmentation & Growth Outlook
5.2.1.By Category
5.2.1.1. Low/No Fat & Salt Snacks- Market Insights and Forecast 2022-2032, USD Million
5.2.1.1.1. Low Fat Snacks- Market Insights and Forecast 2022-2032, USD Million
5.2.1.1.2. No Fat Snacks- Market Insights and Forecast 2022-2032, USD Million
5.2.1.1.3. Low Salt Snacks- Market Insights and Forecast 2022-2032, USD Million
5.2.1.1.4. No Salt Snacks- Market Insights and Forecast 2022-2032, USD Million
5.2.1.2. Low/No Sugar & Caffeine Snacks- Market Insights and Forecast 2022-2032, USD Million
5.2.1.2.1. Low Sugar Snacks- Market Insights and Forecast 2022-2032, USD Million
5.2.1.2.2. No Sugar Snacks- Market Insights and Forecast 2022-2032, USD Million
5.2.1.2.3. No Added Sugar Snacks- Market Insights and Forecast 2022-2032, USD Million
5.2.1.2.4. No Caffeine Snacks- Market Insights and Forecast 2022-2032, USD Million
5.2.1.3. Allergy / Free-from / Specialized Diet Snacks- Market Insights and Forecast 2022-2032, USD Million
5.2.1.3.1. Gluten-Free Snacks- Market Insights and Forecast 2022-2032, USD Million
5.2.1.3.2. Dairy-Free Snacks- Market Insights and Forecast 2022-2032, USD Million
5.2.1.3.3. Lactose-Free Snacks- Market Insights and Forecast 2022-2032, USD Million
5.2.1.3.4. Hypoallergenic Snacks- Market Insights and Forecast 2022-2032, USD Million
5.2.1.3.5. Keto Snacks- Market Insights and Forecast 2022-2032, USD Million
5.2.1.3.6. Meat-Free Snacks- Market Insights and Forecast 2022-2032, USD Million
5.2.1.3.7. No Allergens Snacks- Market Insights and Forecast 2022-2032, USD Million
5.2.1.3.8. Plant-Based Snacks- Market Insights and Forecast 2022-2032, USD Million
5.2.1.3.9. Vegan Snacks- Market Insights and Forecast 2022-2032, USD Million
5.2.1.3.10. Vegetarian Snacks- Market Insights and Forecast 2022-2032, USD Million
5.2.1.3.11. Weight Management Snacks- Market Insights and Forecast 2022-2032, USD Million
5.2.1.4. Fortified / Nutrient-Enhanced Snacks- Market Insights and Forecast 2022-2032, USD Million
5.2.1.4.1. Good Source of Antioxidants Snacks- Market Insights and Forecast 2022-2032, USD Million
5.2.1.4.2. Good Source of Minerals Snacks- Market Insights and Forecast 2022-2032, USD Million
5.2.1.4.3. Good Source of Omega-3s Snacks- Market Insights and Forecast 2022-2032, USD Million
5.2.1.4.4. Good Source of Vitamins Snacks- Market Insights and Forecast 2022-2032, USD Million
5.2.1.4.5. High Fibre Snacks- Market Insights and Forecast 2022-2032, USD Million
5.2.1.4.6. High Protein Snacks- Market Insights and Forecast 2022-2032, USD Million
5.2.1.4.7. Probiotic Snacks- Market Insights and Forecast 2022-2032, USD Million
5.2.1.4.8. Superfruit Snacks- Market Insights and Forecast 2022-2032, USD Million
5.2.1.5. Health & Wellness-Oriented Snacks- Market Insights and Forecast 2022-2032, USD Million
5.2.1.5.1. Bone and Joint Health Snacks- Market Insights and Forecast 2022-2032, USD Million
5.2.1.5.2. Brain Health and Memory Snacks- Market Insights and Forecast 2022-2032, USD Million
5.2.1.5.3. Cardiovascular Health Snacks- Market Insights and Forecast 2022-2032, USD Million
5.2.1.5.4. Digestive Health Snacks- Market Insights and Forecast 2022-2032, USD Million
5.2.1.5.5. Energy Boosting Snacks- Market Insights and Forecast 2022-2032, USD Million
5.2.1.5.6. Immune Support Snacks- Market Insights and Forecast 2022-2032, USD Million
5.2.1.5.7. Skin Health Snacks- Market Insights and Forecast 2022-2032, USD Million
5.2.1.5.8. Vision Health Snacks- Market Insights and Forecast 2022-2032, USD Million
5.2.1.6. Natural Snacks- Market Insights and Forecast 2022-2032, USD Million
5.2.1.7. Organic Snacks- Market Insights and Forecast 2022-2032, USD Million
5.2.2.By Product Type
5.2.2.1. Meat Snacks- Market Insights and Forecast 2022-2032, USD Million
5.2.2.2. Nuts, Seeds & Trail Mixes- Market Insights and Forecast 2022-2032, USD Million
5.2.2.3. Dried Fruit Snacks- Market Insights and Forecast 2022-2032, USD Million
5.2.2.4. Cereal & Granola Bars- Market Insights and Forecast 2022-2032, USD Million
5.2.2.5. Others- Market Insights and Forecast 2022-2032, USD Million
5.2.3.By Packaging
5.2.3.1. Bag & Pouches- Market Insights and Forecast 2022-2032, USD Million
5.2.3.2. Boxes- Market Insights and Forecast 2022-2032, USD Million
5.2.3.3. Cans- Market Insights and Forecast 2022-2032, USD Million
5.2.3.4. Jars- Market Insights and Forecast 2022-2032, USD Million
5.2.3.5. Others- Market Insights and Forecast 2022-2032, USD Million
5.2.4.By Sales Channel
5.2.4.1. Retail Offline- Market Insights and Forecast 2022-2032, USD Million
5.2.4.2. Retail Online- Market Insights and Forecast 2022-2032, USD Million
5.2.5.By Competitors
5.2.5.1. Competition Characteristics
5.2.5.2. Market Share & Analysis
6. Belgium Low/No Fat & Salt Snacks Healthy Snacks Market Statistics, 2022-2032
6.1. Market Size & Growth Outlook
6.1.1.By Revenues in USD Million
6.2. Market Segmentation & Growth Outlook
6.2.1.By Product Type- Market Insights and Forecast 2022-2032, USD Million
6.2.2.By Packaging- Market Insights and Forecast 2022-2032, USD Million
6.2.3.By Sales Channel- Market Insights and Forecast 2022-2032, USD Million
7. Belgium Low/No Sugar & Caffeine Snacks Healthy Snacks Market Statistics, 2022-2032
7.1. Market Size & Growth Outlook
7.1.1.By Revenues in USD Million
7.2. Market Segmentation & Growth Outlook
7.2.1.By Product Type- Market Insights and Forecast 2022-2032, USD Million
7.2.2.By Packaging- Market Insights and Forecast 2022-2032, USD Million
7.2.3.By Sales Channel- Market Insights and Forecast 2022-2032, USD Million
8. Belgium Allergy / Free-from / Specialized Diet Snacks Healthy Snacks Market Statistics, 2022-2032
8.1. Market Size & Growth Outlook
8.1.1.By Revenues in USD Million
8.2. Market Segmentation & Growth Outlook
8.2.1.By Product Type- Market Insights and Forecast 2022-2032, USD Million
8.2.2.By Packaging- Market Insights and Forecast 2022-2032, USD Million
8.2.3.By Sales Channel- Market Insights and Forecast 2022-2032, USD Million
9. Belgium Fortified / Nutrient-Enhanced Snacks Healthy Snacks Market Statistics, 2022-2032
9.1. Market Size & Growth Outlook
9.1.1.By Revenues in USD Million
9.2. Market Segmentation & Growth Outlook
9.2.1.By Product Type- Market Insights and Forecast 2022-2032, USD Million
9.2.2.By Packaging- Market Insights and Forecast 2022-2032, USD Million
9.2.3.By Sales Channel- Market Insights and Forecast 2022-2032, USD Million
10. Belgium Health & Wellness-Oriented Snacks Healthy Snacks Market Statistics, 2022-2032
10.1. Market Size & Growth Outlook
10.1.1. By Revenues in USD Million
10.2. Market Segmentation & Growth Outlook
10.2.1. By Product Type- Market Insights and Forecast 2022-2032, USD Million
10.2.2. By Packaging- Market Insights and Forecast 2022-2032, USD Million
10.2.3. By Sales Channel- Market Insights and Forecast 2022-2032, USD Million
11. Belgium Natural Snacks Healthy Snacks Market Statistics, 2022-2032
11.1. Market Size & Growth Outlook
11.1.1. By Revenues in USD Million
11.2. Market Segmentation & Growth Outlook
11.2.1. By Product Type- Market Insights and Forecast 2022-2032, USD Million
11.2.2. By Packaging- Market Insights and Forecast 2022-2032, USD Million
11.2.3. By Sales Channel- Market Insights and Forecast 2022-2032, USD Million
12. Belgium Organic Snacks Healthy Snacks Market Statistics, 2022-2032
12.1. Market Size & Growth Outlook
12.1.1. By Revenues in USD Million
12.2. Market Segmentation & Growth Outlook
12.2.1. By Product Type- Market Insights and Forecast 2022-2032, USD Million
12.2.2. By Packaging- Market Insights and Forecast 2022-2032, USD Million
12.2.3. By Sales Channel- Market Insights and Forecast 2022-2032, USD Million
13. Competitive Outlook
13.1. Company Profiles
13.1.1. General Mills Inc
13.1.1.1. Business Description
13.1.1.2. Product Portfolio
13.1.1.3. Collaborations & Alliances
13.1.1.4. Recent Developments
13.1.1.5. Financial Details
13.1.1.6. Others
13.1.2. Roger & Roger SA
13.1.2.1. Business Description
13.1.2.2. Product Portfolio
13.1.2.3. Collaborations & Alliances
13.1.2.4. Recent Developments
13.1.2.5. Financial Details
13.1.2.6. Others
13.1.3. Unilever Group
13.1.3.1. Business Description
13.1.3.2. Product Portfolio
13.1.3.3. Collaborations & Alliances
13.1.3.4. Recent Developments
13.1.3.5. Financial Details
13.1.3.6. Others
13.1.4. PepsiCo Inc
13.1.4.1. Business Description
13.1.4.2. Product Portfolio
13.1.4.3. Collaborations & Alliances
13.1.4.4. Recent Developments
13.1.4.5. Financial Details
13.1.4.6. Others
13.1.5. Haribo GmbH & Co KG
13.1.5.1. Business Description
13.1.5.2. Product Portfolio
13.1.5.3. Collaborations & Alliances
13.1.5.4. Recent Developments
13.1.5.5. Financial Details
13.1.5.6. Others
13.1.6. Kellanova
13.1.6.1. Business Description
13.1.6.2. Product Portfolio
13.1.6.3. Collaborations & Alliances
13.1.6.4. Recent Developments
13.1.6.5. Financial Details
13.1.6.6. Others
13.1.7. Mondelez International Inc
13.1.7.1. Business Description
13.1.7.2. Product Portfolio
13.1.7.3. Collaborations & Alliances
13.1.7.4. Recent Developments
13.1.7.5. Financial Details
13.1.7.6. Others
13.1.8. Boni Holding AD
13.1.8.1. Business Description
13.1.8.2. Product Portfolio
13.1.8.3. Collaborations & Alliances
13.1.8.4. Recent Developments
13.1.8.5. Financial Details
13.1.8.6. Others
13.1.9. Ecotone
13.1.9.1. Business Description
13.1.9.2. Product Portfolio
13.1.9.3. Collaborations & Alliances
13.1.9.4. Recent Developments
13.1.9.5. Financial Details
13.1.9.6. Others
13.1.10. Ricola AG
13.1.10.1.Business Description
13.1.10.2.Product Portfolio
13.1.10.3.Collaborations & Alliances
13.1.10.4.Recent Developments
13.1.10.5.Financial Details
13.1.10.6.Others
14. Disclaimer
| Segment | Sub-Segment |
|---|---|
| By Category |
|
| By Product Type |
|
| By Packaging |
|
| By Sales Channel |
|
Research Methodology
This study followed a structured approach comprising four key phases to assess the size and scope of the electro-oxidation market. The process began with thorough secondary research to collect data on the target market, related markets, and broader industry context. These findings, along with preliminary assumptions and estimates, were then validated through extensive primary research involving industry experts from across the value chain. To calculate the overall market size, both top-down and bottom-up methodologies were employed. Finally, market segmentation and data triangulation techniques were applied to refine and validate segment-level estimations.
Secondary Research
The secondary research phase involved gathering data from a wide range of credible and published sources. This step helped in identifying industry trends, defining market segmentation, and understanding the market landscape and value chain.
Sources consulted during this phase included:
- Company annual reports, investor presentations, and press releases
- Industry white papers and certified publications
- Trade directories and market-recognized databases
- Articles from authoritative authors and reputable journals
- Gold and silver standard websites
Secondary research was critical in mapping out the industry's value chain and monetary flow, identifying key market segments, understanding regional variations, and tracking significant industry developments.
Other key sources:
- Financial disclosures
- Industry associations and trade bodies
- News outlets and business magazines
- Academic journals and research studies
- Paid industry databases
Primary Research
To validate secondary data and gain deeper market insights, primary research was conducted with key stakeholders across both the supply and demand sides of the market.
On the demand side, participants included decision-makers and influencers from end-user industries—such as CIOs, CTOs, and CSOs—who provided first-hand perspectives on market needs, product usage, and future expectations.
On the supply side, interviews were conducted with manufacturers, industry associations, and institutional participants to gather insights into current offerings, product pipelines, and market challenges.
Primary interviews provided critical inputs such as:
- Market size and revenue data
- Product and service breakdowns
- Market forecasts
- Regional and application-specific trends
Stakeholders consulted included:
- Leading OEM and solution providers
- Channel and distribution partners
- End users across various applications
- Independent consultants and industry specialists
Market Size Estimation and Data Triangulation
- Identifying Key Market Participants (Secondary Research)
- Goal: To identify the major players or companies in the target market. This typically involves using publicly available data sources such as industry reports, market research publications, and financial statements of companies.
- Tools: Reports from firms like Gartner, Forrester, Euromonitor, Statista, IBISWorld, and others. Public financial statements, news articles, and press releases from top market players.
- Extracting Earnings of Key Market Participants
- Goal: To estimate the earnings generated from the product or service being analyzed. This step helps in understanding the revenue potential of each market player in a specific geography.
- Methods: Earnings data can be gathered from:
- Publicly available financial reports (for listed companies).
- Interviews and primary data sources from professionals, such as Directors, VPs, SVPs, etc. This is especially useful for understanding more nuanced, internal data that isn't publicly disclosed.
- Annual reports and investor presentations of key players.
- Data Collation and Development of a Relevant Data Model
- Goal: To collate inputs from both primary and secondary sources into a structured, data-driven model for market estimation. This model will incorporate key market KPIs and any independent variables relevant to the market.
- Key KPIs: These could include:
- Market size, growth rate, and demand drivers.
- Industry-specific metrics like market share, average revenue per customer (ARPC), or average deal size.
- External variables, such as economic growth rates, inflation rates, or commodity prices, that could affect the market.
- Data Modeling: Based on this data, the market forecasts are developed for the next 5 years. A combination of trend analysis, scenario modeling, and statistical regression might be used to generate projections.
- Scenario Analysis
- Goal: To test different assumptions and validate how sensitive the market is to changes in key variables (e.g., market demand, regulatory changes, technological disruptions).
- Types of Scenarios:
- Base Case: Based on current assumptions and historical data.
- Best-Case Scenario: Assuming favorable market conditions, regulatory environments, and technological advancements.
- Worst-Case Scenario: Accounting for adverse factors, such as economic downturns, stricter regulations, or unexpected disruptions.


