Australia Juice Market Report: Trends, Growth and Forecast (2026-2032)
By Category (100% Juice (Not from Concentrate, Reconstituted), Juice Drinks (up to 24% Juice), Nectars (High Concentration (40% to 50% fruit content), Medium Concentration (30% to 39% fruit content), Low Concentration (25% to 29% fruit content)), Vegetable Juice, Fruit and Vegetable Blends), By Nature (Conventional, Organic), By Packaging Material (Plastic, Glass, Metal, Others), By Packaging Type (PET Bottles, Aseptic Packages (Cartons), Glass Bottles, Metal Cans, Disposable Cups & Pouches), By Sales Channel (Off-Trade (Hypermarkets/ Supermarkets, Retail Outlets, Convenience Stores, Online Platforms), On-Trade), By Region (Queensland, New South Wales, Victoria, South Australia, Others) ... Read more
|
Major Players
|
Australia Juice Market Statistics and Insights, 2026
- Market Size Statistics
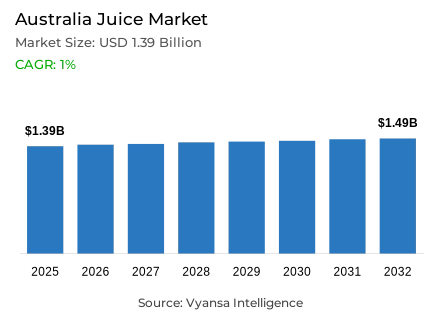
- Juice in Australia is estimated at USD 1.39 billion in 2025.
- The market size is expected to grow to USD 1.49 billion by 2032.
- Market to register a cagr of around 1% during 2026-32.
- Category Shares
- 100% juice grabbed market share of 75%.
- Competition
- More than 20 companies are actively engaged in producing juice in Australia.
- Top 5 companies acquired around 60% of the market share.
- Grove Fruit Juices Pty Ltd, Campbell's Co, The, Bickford's Australia Pty Ltd, Bega Cheese Ltd, Monde Nissin (Australia) Pty Ltd etc., are few of the top companies.
- Sales Channel
- Off-trade grabbed 75% of the market.
Australia Juice Market Outlook
Australia juice market is experiencing structural realignment as the consumer preference shifts towards low-sugar and high-functionality juices. Although traditional juice has been a breakfast staple, increasing worries about sugar content and the new Health Star Rating system, which ranks some juices lower than diet sodas, have slowed volume growth. These headwinds notwithstanding, the market is projected to be at 1.39 billion dollars in 2025 and is expected to be at 1.28 billion dollars in 2032, which is a compound annual growth rate of about 1 % in the 2026-32 period.
The landscape is also being redefined by economic pressures, with the issue of cost-of-living issues pushing shoppers towards the private-label and value-oriented ambient products. However, the high-end chilled market is still strong due to the presence of health-conscious end user who value the credentials of 100 per cent real juice and cold-pressed juices. In fact, 100% Juice holds a strong market share of 75% because Australians are interested in natural ingredients and minimal processing to balance their nutritional objectives.
The main force of recovery is innovation, where brands go beyond general refreshment to need-state solutions like immunity, gut health, and recovery. The addition of functional ingredients such as probiotics, vitamins, and special ingredients such as Korean pear to hangovers reposition juice as a wellness product. Additionally, the fast development of coconut and plant waters is an indicator of a need in natural and low-calorie hydration that will provide health benefits and at the same time indulgent flavours like coffee or chocolate.
Retail convenience remains the leader in distribution with 75 % of the market being captured by the Off-Trade channels. Supermarkets are the most powerful because they have a broad selection and aggressive multi-buy offers. In the meantime, retail online is the most rapidly expanding channel, with digital platforms allowing end user to compare prices easily and find health-oriented brands. This change to online grocery shopping is fundamentally changing the way household staples are bought in the country.

Australia Juice Market Growth Driver
Value Seeking and Online Grocery Keep Juice in the Basket
The pressure of the cost of living is forcing Australians to be more careful in their daily grocery spending, including consumables like beverages. According to the Consumer Price Index, food and non-alcoholic beverages increased by 3.4% in the twelve months to December 2025, whereas the prices of non-alcoholic beverages increased by 4.0% in the same period. This highlights the importance of value-based money and focuses on pack size, unit price, and promotion.
At the same time, online grocery retail enables easier price comparison and multi-buy options. In its FY25 highlights, Coles records a normalised retail online sales growth of 23.3, which shows strong online adoption. In the case of juice, this increases access to discounts, simplifies re-ordering, and offers more transparent unit-price options between branded and own-label.
Australia Juice Market Challenge
Sugar Perception and Health Labels Weaken Juice Health Halo
Australians are becoming more and more critical of beverages in a sugar lens, which is also applied to juice. According to ABS data, the share of individuals who drink sugar-sweetened drinks dropped to 20.9% in 2023 compared to 43.2% in 1995, which is a long-term trend of abandoning sugary options in favor of healthier hydration.
Packaging cues contribute to the pressure. After changes to the Health Star Rating (HSR) calculator, fruit juice may now be rated at two stars, and the change is widely reported to have put juice below diet cola in the same system. This undermines the traditional health image of juice and makes sugar, portion size, and value more difficult to defend at the shelf.
Unlock Market Intelligence
Explore the market potential with our data-driven report
Australia Juice Market Trend
Hydration Shifts Toward Functional and ‘Better‑for‑You’ Alternatives
End user are still shifting away to the new modern forms of sweet drinks to the new modern forms of functional + hydration. According to ABS, the consumption of electrolyte and energy drinks and fortified waters increased by 0.9 in 1995 and 3.3 in 2023, which shows how quickly related categories become more relevant every day.
This change redefines the look of juice on the shelf. To support the sugar-reduction trend, brands are shifting to lower-sugar blends, fruit-plus-plant-water blends, and smaller on-the-go packs. Plant waters, like coconut water, are also becoming visible with flavoured and sparkling varieties that are lighter than regular juice. Reforms to the Health Star Rating, which emphasize more on sugar, support this trend by rewarding reformulation and more prominent nutrition information on packaging
Australia Juice Market Opportunity
Functional Shots and Veg‑Forward Blends Create New Occasions
Australia has a definite nutrition gap that convenience formats aim to fill. According to the Australian Institute of Health and Welfare, 94% of adults fail to consume the recommended number of servings of vegetables and 56% fail to consume the recommended number of servings of fruits. It also mentions that 12 % of adults do not eat any fruit and 1.8 % do not eat any vegetables, which highlights the challenge many households have in achieving daily goals.
This creates room to small but meaningful juice formats: fibre-added vegetable blends, probiotic-style shots, and reduced-sugar mixes that fit hydration, recovery, or immunity routines. Transparency of sugar and clear portion cues are important since the changes in Health Star Rating keep the attention on sugars in beverages.
Unlock Market Intelligence
Explore the market potential with our data-driven report
Australia Juice Market Segmentation Analysis
By Category
- 100% Juice
- Not from Concentrate
- Reconstituted
- Juice Drinks (up to 24% Juice)
- Nectars
- High Concentration (40% to 50% fruit content)
- Medium Concentration (30% to 39% fruit content)
- Low Concentration (25% to 29% fruit content)
- Vegetable Juice
- Fruit and Vegetable Blends
The segment has the largest share in the category in the Australian market with 100% Juice having a market share of 75%. Such a leading role is indicative of the importance attached to authenticity and natural nutrition by Australian end user. Although the broader category has issues with sugar-related health ratings, 100% juice is the best option to choose when one wants to consume clean label products that do not contain added sugars or preservatives.
In this segment, Not From Concentrate (NFC) and cold-pressed are especially robust in urban regions, where wellness-conscious end user are ready to pay a higher price to freshness. Nudie and other brands have been able to take advantage of this by providing functional wellness shots and lower-sugar blends. Although price sensitivity drives others to value choices, the fundamental need of 100% pure fruit and vegetable content remains the basis of most market action up to 2032.

By Sales Channel
- Off-Trade
- Hypermarkets/ Supermarkets
- Retail Outlets
- Convenience Stores
- Online Platforms
- On-Trade
The segment has the highest share around the Sales Channel is Off-Trade, which grabbed 75% of the market. This significant share is driven by the strength of major supermarket chains like Coles and Woolworths, which serve as the primary hubs for both everyday value and premium chilled juices. The off-trade channel benefits from the convenience of one-stop grocery shopping, where end user can take advantage of frequent promotional activities and private label products that offer better value for money.
While physical stores remain the bedrock of distribution, the retail online sub-channel is experiencing the most rapid growth. The ability to compare brands, access home delivery, and browse specialized health food platforms is reshaping consumer behavior. This digital expansion, combined with the continued dominance of brick-and-mortar retailers, ensures that home consumption will remain the primary driver for the juice market's distribution strategy over the forecast period.
List of Companies Covered in Australia Juice Market
The companies listed below are highly influential in the Australia juice market, with a significant market share and a strong impact on industry developments.
- Grove Fruit Juices Pty Ltd
- Campbell's Co, The
- Bickford's Australia Pty Ltd
- Bega Cheese Ltd
- Monde Nissin (Australia) Pty Ltd
- Heinz Co Australia Ltd, HJ
- Food Revolution Group Ltd, The
- Made (Aust) Pty Ltd
- H2Coco Pty Ltd
- Schweppes Australia Pty Ltd
Competitive Landscape
Australia juice market in 2025 remains highly mature, with leading brands consolidating positions amid declining volumes and shifting health perceptions. Golden Circle, owned by HJ Heinz Co Australia Ltd, continues to lead through mass distribution and strong household penetration, benefiting from its status as a trusted, family-oriented staple in supermarkets. However, premium and health-led players are gaining relative traction. Nudie from Monde Nissin (Australia) Pty Ltd outperforms rivals in chilled juice by leveraging 100% juice credentials, reduced-sugar blends, and functional wellness shots. Competitive dynamics are increasingly shaped by cross-category pressure from plant waters and private labels, particularly within major retailers such as Coles and Woolworths, intensifying value-led competition.
Frequently Asked Questions
Related Report
1. Market Segmentation
1.1. Research Scope
1.2. Research Methodology
1.3. Definitions and Assumptions
2. Executive Summary
3. Australia Juice Market Policies, Regulations, and Standards
4. Australia Juice Market Dynamics
4.1. Growth Factors
4.2. Challenges
4.3. Trends
4.4. Opportunities
5. Australia Juice Market Statistics, 2022-2032F
5.1. Market Size & Growth Outlook
5.1.1.By Revenues in USD Million
5.1.2.By Quantity Sold in Million Litres
5.2. Market Segmentation & Growth Outlook
5.2.1.By Category
5.2.1.1. 100% Juice- Market Insights and Forecast 2022-2032, USD Million
5.2.1.1.1. Not from Concentrate- Market Insights and Forecast 2022-2032, USD Million
5.2.1.1.2. Reconstituted- Market Insights and Forecast 2022-2032, USD Million
5.2.1.2. Juice Drinks (up to 24% Juice)- Market Insights and Forecast 2022-2032, USD Million
5.2.1.3. Nectars- Market Insights and Forecast 2022-2032, USD Million
5.2.1.3.1. High Concentration (40% to 50% fruit content)- Market Insights and Forecast 2022-2032, USD Million
5.2.1.3.2. Medium Concentration (30% to 39% fruit content)- Market Insights and Forecast 2022-2032, USD Million
5.2.1.3.3. Low Concentration (25% to 29% fruit content)- Market Insights and Forecast 2022-2032, USD Million
5.2.1.4. Vegetable Juice- Market Insights and Forecast 2022-2032, USD Million
5.2.1.5. Fruit and Vegetable Blends- Market Insights and Forecast 2022-2032, USD Million
5.2.2.By Nature
5.2.2.1. Conventional- Market Insights and Forecast 2022-2032, USD Million
5.2.2.2. Organic- Market Insights and Forecast 2022-2032, USD Million
5.2.3.By Packaging Material
5.2.3.1. Plastic- Market Insights and Forecast 2022-2032, USD Million
5.2.3.2. Glass- Market Insights and Forecast 2022-2032, USD Million
5.2.3.3. Metal- Market Insights and Forecast 2022-2032, USD Million
5.2.3.4. Others- Market Insights and Forecast 2022-2032, USD Million
5.2.4.By Packaging Type
5.2.4.1. PET Bottles- Market Insights and Forecast 2022-2032, USD Million
5.2.4.2. Aseptic Packages (Cartons)- Market Insights and Forecast 2022-2032, USD Million
5.2.4.3. Glass Bottles- Market Insights and Forecast 2022-2032, USD Million
5.2.4.4. Metal Cans- Market Insights and Forecast 2022-2032, USD Million
5.2.4.5. Disposable Cups & Pouches- Market Insights and Forecast 2022-2032, USD Million
5.2.5.By Sales Channel
5.2.5.1. Off-Trade- Market Insights and Forecast 2022-2032, USD Million
5.2.5.1.1. Hypermarkets/ Supermarkets - Market Insights and Forecast 2022-2032, USD Million
5.2.5.1.2. Retail Outlets - Market Insights and Forecast 2022-2032, USD Million
5.2.5.1.3. Convenience Stores- Market Insights and Forecast 2022-2032, USD Million
5.2.5.1.4. Online Platforms- Market Insights and Forecast 2022-2032, USD Million
5.2.5.2. On-Trade- Market Insights and Forecast 2022-2032, USD Million
5.2.6.By Region
5.2.6.1. Queensland
5.2.6.2. New South Wales
5.2.6.3. Victoria
5.2.6.4. South Australia
5.2.6.5. Others
5.2.7.By Competitors
5.2.7.1. Competition Characteristics
5.2.7.2. Market Share & Analysis
6. Australia 100% Juice Market Statistics, 2022-2032
6.1. Market Size & Growth Outlook
6.1.1.By Revenues in USD Million
6.1.2.By Quantity Sold in Million Litres
6.2. Market Segmentation & Growth Outlook
6.2.1.By Nature- Market Insights and Forecast 2022-2032, USD Million
6.2.2.By Packaging Material- Market Insights and Forecast 2022-2032, USD Million
6.2.3.By Packaging Type- Market Insights and Forecast 2022-2032, USD Million
6.2.4.By Sales Channel- Market Insights and Forecast 2022-2032, USD Million
6.2.5.By Region- Market Insights and Forecast 2022-2032, USD Million
7. Australia Juice Drinks (up to 24% Juice) Market Statistics, 2022-2032
7.1. Market Size & Growth Outlook
7.1.1.By Revenues in USD Million
7.1.2.By Quantity Sold in Million Litres
7.2. Market Segmentation & Growth Outlook
7.2.1.By Nature- Market Insights and Forecast 2022-2032, USD Million
7.2.2.By Packaging Material- Market Insights and Forecast 2022-2032, USD Million
7.2.3.By Packaging Type- Market Insights and Forecast 2022-2032, USD Million
7.2.4.By Sales Channel- Market Insights and Forecast 2022-2032, USD Million
7.2.5.By Region- Market Insights and Forecast 2022-2032, USD Million
8. Australia Nectars Market Statistics, 2022-2032
8.1. Market Size & Growth Outlook
8.1.1.By Revenues in USD Million
8.1.2.By Quantity Sold in Million Litres
8.2. Market Segmentation & Growth Outlook
8.2.1.By Nature- Market Insights and Forecast 2022-2032, USD Million
8.2.2.By Packaging Material- Market Insights and Forecast 2022-2032, USD Million
8.2.3.By Packaging Type- Market Insights and Forecast 2022-2032, USD Million
8.2.4.By Sales Channel- Market Insights and Forecast 2022-2032, USD Million
8.2.5.By Region- Market Insights and Forecast 2022-2032, USD Million
9. Australia Vegetable Juice Market Statistics, 2022-2032
9.1. Market Size & Growth Outlook
9.1.1.By Revenues in USD Million
9.1.2.By Quantity Sold in Million Litres
9.2. Market Segmentation & Growth Outlook
9.2.1.By Nature- Market Insights and Forecast 2022-2032, USD Million
9.2.2.By Packaging Material- Market Insights and Forecast 2022-2032, USD Million
9.2.3.By Packaging Type- Market Insights and Forecast 2022-2032, USD Million
9.2.4.By Sales Channel- Market Insights and Forecast 2022-2032, USD Million
9.2.5.By Region- Market Insights and Forecast 2022-2032, USD Million
10. Australia Fruit and Vegetable Blends Market Statistics, 2022-2032
10.1. Market Size & Growth Outlook
10.1.1. By Revenues in USD Million
10.1.2. By Quantity Sold in Million Litres
10.2. Market Segmentation & Growth Outlook
10.2.1. By Nature- Market Insights and Forecast 2022-2032, USD Million
10.2.2. By Packaging Material- Market Insights and Forecast 2022-2032, USD Million
10.2.3. By Packaging Type- Market Insights and Forecast 2022-2032, USD Million
10.2.4. By Sales Channel- Market Insights and Forecast 2022-2032, USD Million
10.2.5. By Region- Market Insights and Forecast 2022-2032, USD Million
11. Competitive Outlook
11.1. Company Profiles
11.1.1. Bega Cheese Ltd
11.1.1.1. Business Description
11.1.1.2. Product Portfolio
11.1.1.3. Collaborations & Alliances
11.1.1.4. Recent Developments
11.1.1.5. Financial Details
11.1.1.6. Others
11.1.2. Monde Nissin (Australia) Pty Ltd
11.1.2.1. Business Description
11.1.2.2. Product Portfolio
11.1.2.3. Collaborations & Alliances
11.1.2.4. Recent Developments
11.1.2.5. Financial Details
11.1.2.6. Others
11.1.3. Heinz Co Australia Ltd, HJ
11.1.3.1. Business Description
11.1.3.2. Product Portfolio
11.1.3.3. Collaborations & Alliances
11.1.3.4. Recent Developments
11.1.3.5. Financial Details
11.1.3.6. Others
11.1.4. Food Revolution Group Ltd, The
11.1.4.1. Business Description
11.1.4.2. Product Portfolio
11.1.4.3. Collaborations & Alliances
11.1.4.4. Recent Developments
11.1.4.5. Financial Details
11.1.4.6. Others
11.1.5. Made (Aust) Pty Ltd
11.1.5.1. Business Description
11.1.5.2. Product Portfolio
11.1.5.3. Collaborations & Alliances
11.1.5.4. Recent Developments
11.1.5.5. Financial Details
11.1.5.6. Others
11.1.6. Grove Fruit Juices Pty Ltd
11.1.6.1. Business Description
11.1.6.2. Product Portfolio
11.1.6.3. Collaborations & Alliances
11.1.6.4. Recent Developments
11.1.6.5. Financial Details
11.1.6.6. Others
11.1.7. Campbell's Co, The
11.1.7.1. Business Description
11.1.7.2. Product Portfolio
11.1.7.3. Collaborations & Alliances
11.1.7.4. Recent Developments
11.1.7.5. Financial Details
11.1.7.6. Others
11.1.8. Bickford's Australia Pty Ltd
11.1.8.1. Business Description
11.1.8.2. Product Portfolio
11.1.8.3. Collaborations & Alliances
11.1.8.4. Recent Developments
11.1.8.5. Financial Details
11.1.8.6. Others
11.1.9. H2Coco Pty Ltd
11.1.9.1. Business Description
11.1.9.2. Product Portfolio
11.1.9.3. Collaborations & Alliances
11.1.9.4. Recent Developments
11.1.9.5. Financial Details
11.1.9.6. Others
11.1.10. Schweppes Australia Pty Ltd
11.1.10.1.Business Description
11.1.10.2.Product Portfolio
11.1.10.3.Collaborations & Alliances
11.1.10.4.Recent Developments
11.1.10.5.Financial Details
11.1.10.6.Others
12. Disclaimer
| Segment | Sub-Segment |
|---|---|
| By Category |
|
| By Nature |
|
| By Packaging Material |
|
| By Packaging Type |
|
| By Sales Channel |
|
| By Region |
|
Research Methodology
This study followed a structured approach comprising four key phases to assess the size and scope of the electro-oxidation market. The process began with thorough secondary research to collect data on the target market, related markets, and broader industry context. These findings, along with preliminary assumptions and estimates, were then validated through extensive primary research involving industry experts from across the value chain. To calculate the overall market size, both top-down and bottom-up methodologies were employed. Finally, market segmentation and data triangulation techniques were applied to refine and validate segment-level estimations.
Secondary Research
The secondary research phase involved gathering data from a wide range of credible and published sources. This step helped in identifying industry trends, defining market segmentation, and understanding the market landscape and value chain.
Sources consulted during this phase included:
- Company annual reports, investor presentations, and press releases
- Industry white papers and certified publications
- Trade directories and market-recognized databases
- Articles from authoritative authors and reputable journals
- Gold and silver standard websites
Secondary research was critical in mapping out the industry's value chain and monetary flow, identifying key market segments, understanding regional variations, and tracking significant industry developments.
Other key sources:
- Financial disclosures
- Industry associations and trade bodies
- News outlets and business magazines
- Academic journals and research studies
- Paid industry databases
Primary Research
To validate secondary data and gain deeper market insights, primary research was conducted with key stakeholders across both the supply and demand sides of the market.
On the demand side, participants included decision-makers and influencers from end-user industries—such as CIOs, CTOs, and CSOs—who provided first-hand perspectives on market needs, product usage, and future expectations.
On the supply side, interviews were conducted with manufacturers, industry associations, and institutional participants to gather insights into current offerings, product pipelines, and market challenges.
Primary interviews provided critical inputs such as:
- Market size and revenue data
- Product and service breakdowns
- Market forecasts
- Regional and application-specific trends
Stakeholders consulted included:
- Leading OEM and solution providers
- Channel and distribution partners
- End users across various applications
- Independent consultants and industry specialists
Market Size Estimation and Data Triangulation
- Identifying Key Market Participants (Secondary Research)
- Goal: To identify the major players or companies in the target market. This typically involves using publicly available data sources such as industry reports, market research publications, and financial statements of companies.
- Tools: Reports from firms like Gartner, Forrester, Euromonitor, Statista, IBISWorld, and others. Public financial statements, news articles, and press releases from top market players.
- Extracting Earnings of Key Market Participants
- Goal: To estimate the earnings generated from the product or service being analyzed. This step helps in understanding the revenue potential of each market player in a specific geography.
- Methods: Earnings data can be gathered from:
- Publicly available financial reports (for listed companies).
- Interviews and primary data sources from professionals, such as Directors, VPs, SVPs, etc. This is especially useful for understanding more nuanced, internal data that isn't publicly disclosed.
- Annual reports and investor presentations of key players.
- Data Collation and Development of a Relevant Data Model
- Goal: To collate inputs from both primary and secondary sources into a structured, data-driven model for market estimation. This model will incorporate key market KPIs and any independent variables relevant to the market.
- Key KPIs: These could include:
- Market size, growth rate, and demand drivers.
- Industry-specific metrics like market share, average revenue per customer (ARPC), or average deal size.
- External variables, such as economic growth rates, inflation rates, or commodity prices, that could affect the market.
- Data Modeling: Based on this data, the market forecasts are developed for the next 5 years. A combination of trend analysis, scenario modeling, and statistical regression might be used to generate projections.
- Scenario Analysis
- Goal: To test different assumptions and validate how sensitive the market is to changes in key variables (e.g., market demand, regulatory changes, technological disruptions).
- Types of Scenarios:
- Base Case: Based on current assumptions and historical data.
- Best-Case Scenario: Assuming favorable market conditions, regulatory environments, and technological advancements.
- Worst-Case Scenario: Accounting for adverse factors, such as economic downturns, stricter regulations, or unexpected disruptions.


