Australia Healthy Snacks Market Report: Trends, Growth and Forecast (2026-2032)
By Category (Low/No Fat & Salt Snacks (Low Fat Snacks, No Fat Snacks, Low Salt Snacks, No Salt Snacks), Low/No Sugar & Caffeine Snacks (Low Sugar Snacks, No Sugar Snacks, No Added Sugar Snacks, No Caffeine Snacks), Allergy / Free-from / Specialized Diet Snacks (Gluten-Free Snacks, Dairy-Free Snacks, Lactose-Free Snacks, Hypoallergenic Snacks, Keto Snacks, Meat-Free Snacks, No Allergens Snacks, Plant-Based Snacks, Vegan Snacks, Vegetarian Snacks, Weight Management Snacks), Fortified / Nutrient-Enhanced Snacks (Good Source of Antioxidants Snacks, Good Source of Minerals Snacks, Good Source of Omega-3s Snacks, Good Source of Vitamins Snacks, High Fibre Snacks, High Protein Snacks, Probiotic Snacks, Superfruit Snacks), Health & Wellness-Oriented Snacks (Bone and Joint Health Snacks, Brain Health and Memory Snacks, Cardiovascular Health Snacks, Digestive Health Snacks, Energy Boosting Snacks, Immune Support Snacks, Skin Health Snacks, Vision Health Snacks), Natural Snacks, Organic Snacks), By Product Type (Meat Snacks, Nuts, Seeds & Trail Mixes, Dried Fruit Snacks, Cereal & Granola Bars, Others), By Packaging (Bag & Pouches, Boxes, Cans, Jars, Others), By Sales Channel (Retail Offline, Retail Online) ... Read more
|
Major Players
|
Australia Healthy Snacks Market Statistics and Insights, 2026
- Market Size Statistics
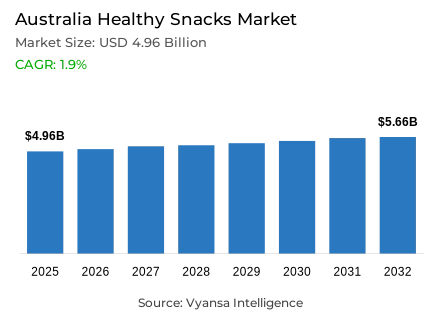
- Healthy snacks market size in Australia was estimated at USD 4.96 billion in 2025.
- The market size is expected to grow to USD 5.66 billion by 2032.
- Market to register a CAGR of around 1.9% during 2026-32.
- Category Shares
- Allergy / free-from / specialized diet snacks grabbed market share of 40%.
- Competition
- More than 10 companies are actively engaged in producing healthy snacks in Australia.
- Top 5 companies acquired around 20% of the market share.
- Mondelez International Inc, Organic Times Pty Ltd, Ceres Enterprises Ltd, PepsiCo Inc, Intersnack Group GmbH & Co KG etc., are few of the top companies.
- Sales Channel
- Retail offline grabbed 75% of the market.
Australia Healthy Snacks Market Outlook
The Australia healthy snack market is undergoing a stable growth as customers are moving towards the better-for-you products that focus on natural ingredients and functional advantages. The market is estimated to be worth AU$4.96 billion in 2025 and is expected to grow to AU$5.66 billion in 2032 with a CAGR of about 1.9% in the forecast period. This growth is also motivated by the increased emphasis on preventative health, as Australians are increasingly choosing snacks that aid in weight control and prevent chronic diseases like obesity and diabetes.
The focus of innovation is now on sugar reduction and plant-based formulations. Large competitors like Arnott’s and Allen are re-packaging classic products to provide low-sugar and vegan options, and own-label brands like Woolworths Plantitude and Coles Joyful are turning high-end healthy snacks into a more affordable option. There is also an increasing demand of less processed and immune-enhancing snacks that will serve time-starved consumers with busy schedules and yet want to achieve their wellness objectives.
The legislative changes are likely to further influence the landscape, as the stricter regulations on the no added sugar claims and possible reforms of the Health Star Rating system are likely to be implemented. With consumers becoming more critical, they are turning towards clean-label products that avoid artificial additives and unnecessary sodium. The brands that emphasize transparency and functional ingredients, including high protein, probiotics, and fibre, are in a good position to attract the attention of both health-conscious and flexitarian shoppers.
The market is still very dependent on physical stores, and the retail offline takes 75% of the market. Supermarkets control the sales channel environment with a wide range of diversity and easy accessibility. Nevertheless, online shopping is gaining more and more importance, and online platforms are offering new brands a platform to access niche markets. With the market shifting to 2032, the overlap of convenience, affordability, and proven health claims will be the main factor in achieving competitive success in the Australian snacking industry.

Australia Healthy Snacks Market Growth Driver
Wellness-Led Ingredient Scrutiny Sustaining Demand for Transparent and Better-for-You Snacks
Australians are becoming more health conscious and are using health as a major factor in choosing snacks, which is increasing the pressure on products that communicate positive, healthy messages. The Australian Bureau of Statistics reports that 24.9% of the population followed a particular diet or eating pattern in 2023, which means that there is a large group of consumers who are actively controlling their diet. This health-aware group maintains the demand of products that focus on nutritional transparency, ingredient simplicity, and functional health advantages in line with dietary management goals.
The behaviour observed is a greater preference of snacks that minimise or avoid specific ingredients. The same ABS release states that 13.6% of people avoid foods because of intolerances and among those on a diet, low-sugar diets are the most common at 6.7%. These trends support the momentum of plant-based, gluten-free, and reduced-sugar snacks that are viewed as more simplistic, healthier, and more credible at the point of sale. The overlap of dietary pattern adoption and ingredient avoidance behaviours creates favourable market conditions of snacks with transparent formulation, lower sugar content, and free-from positioning in accordance with wellness-driven purchasing criteria.
Australia Healthy Snacks Market Challenge
Tightening Nutrition Claim and Labelling Standards Elevating Compliance and Reformulation Burden
Regulators are increasing the requirements of health claims and front-of-pack information, which puts brands under increased compliance and reformulation pressure. Food Standards Australia New Zealand has conditions restricting voluntary claims of no added sugars. Under Proposal P1062, products cannot use the no added sugars claim when they contain added sugar, or when the total sugars exceed 10.0g per 100g of solid food or 7.5g per 100mL of liquid. These limits require significant reformulation of many existing products that want to remain eligible to claim.
At the same time, the Australian Government is moving towards the mandatory Health Star Ratings due to the lack of use of the voluntary scheme. The Department of Health, Disability and Ageing refers to the statistics provided by Food Standards Australia New Zealand, which indicate that only 37% of products contain a Health Star Rating. The time and cost of packaging changes, testing, and recipe modifications needed to meet these standards is particularly burdensome to smaller snack brands with limited resources. Tightening of regulations creates structural compliance issues that require investment in reformulation, testing infrastructure, and packaging redesign to maintain market access and earn credibility in the increasingly regulated snack environment in Australia.
Unlock Market Intelligence
Explore the market potential with our data-driven report
Australia Healthy Snacks Market Trend
Mainstreaming of Plant-Based and Free-From Snacking Reshaping Portfolio Priorities
Plant-based and free-from positioning is gaining more mainstream with an increasing number of consumers actively shunning certain foods and seeking perceived cleaner labels. According to the Australian Bureau of Statistics, 24.9% of the population adheres to a diet or eating pattern in 2023, which confirms that diet-based decision-making is not a niche but a mainstream phenomenon. This high rate of dietary engagement makes plant-based and free-from products mainstream category segments and not specialty options, which fundamentally changes the competitive landscape.
Among them, avoidance patterns are consistent with free-from and plant-based snack claims. Low-or-meat-free diets and gluten- or wheat-free diets are 21.4% and 9.7% among diet-adherents, respectively. According to the same ABS release, 5.3% of people are vegetarian or vegan. This wider foundation facilitates an increase in vegan, gluten-free, and no-allergen claims being co-located in snack lines, not just in specialist products. The growing popularity of dietary restrictions outside of the traditional niche segments keeps the demand of multi-attribute free-from positioning, forcing mainstream brands to expand their product lines to meet the various dietary needs simultaneously.
Australia Healthy Snacks Market Opportunity
Compliance-Led Reformulation Unlocking Low-Sugar and Functional Snack Innovation Runways
The snack innovation that is health-oriented can succeed because it can adhere to more stringent regulations of claims and provide the benefits that consumers are actively pursuing. According to the Australian Bureau of Statistics, 6.7% of individuals on a diet adhere to low-sugar diets, and 37.9% pursue food-avoidance trends, which suggests strong demand of low sugar and fewer ingredients on the label. This large consumer base offers obvious market opportunities to products that reduce sugar and increase functional ingredients.
This opportunity is strengthened by regulatory momentum. Food Standards Australia New Zealand limits the usage of the no added sugars claim and the Australian Government is progressing towards mandatory Health Star Ratings, following data that showed that only 37% of products currently carry ratings. Reformulated brands that reduce sugar and add features like increased protein can increase on-pack credibility, reduce claim risk, and earn trust among time-starved shoppers who want healthier snacks. Reformulation opportunities allow brands to gain regulatory compliance and win health-conscious consumer segments by functional innovation, clear nutrition communication, and believable better-for-you positioning consistent with mandatory labeling regulations.
Unlock Market Intelligence
Explore the market potential with our data-driven report
Australia Healthy Snacks Market Segmentation Analysis
By Category
- Low/No Fat & Salt Snacks
- Low Fat Snacks
- No Fat Snacks
- Low Salt Snacks
- No Salt Snacks
- Low/No Sugar & Caffeine Snacks
- Low Sugar Snacks
- No Sugar Snacks
- No Added Sugar Snacks
- No Caffeine Snacks
- Allergy / Free-from / Specialized Diet Snacks
- Gluten-Free Snacks
- Dairy-Free Snacks
- Lactose-Free Snacks
- Hypoallergenic Snacks
- Keto Snacks
- Meat-Free Snacks
- No Allergens Snacks
- Plant-Based Snacks
- Vegan Snacks
- Vegetarian Snacks
- Weight Management Snacks
- Fortified / Nutrient-Enhanced Snacks
- Good Source of Antioxidants Snacks
- Good Source of Minerals Snacks
- Good Source of Omega-3s Snacks
- Good Source of Vitamins Snacks
- High Fibre Snacks
- High Protein Snacks
- Probiotic Snacks
- Superfruit Snacks
- Health & Wellness-Oriented Snacks
- Bone and Joint Health Snacks
- Brain Health and Memory Snacks
- Cardiovascular Health Snacks
- Digestive Health Snacks
- Energy Boosting Snacks
- Immune Support Snacks
- Skin Health Snacks
- Vision Health Snacks
- Natural Snacks
- Organic Snacks
The segment has the highest share around the category in the Australian healthy snacks market, where Allergy / Free-from / Specialized Diet Snacks grabbed a market share of 40%. This dominance is led by the massive growth of gluten-free products, which reached a retail value of AUD 1.6 billion in 2023. While some consumers choose these for medical reasons, a growing number of Australians opt for them under the perception that they are inherently healthier than standard snacks. Gluten-free salty snacks are a particularly strong sub-segment, often combined with vegan and natural claims to maximize appeal.
Leading players like PepsiCo (with brands like Lay's and Sakata) and Roma Food Products (Orgran) continue to dominate this space by offering a wide range of allergen-friendly options. The segment is also seeing a surge in "guilt-free indulgence," with brands like Pana Organic offering gluten-free and organic chocolate. As plant-based diets become more mainstream among flexitarians, the combination of "free-from" and vegan claims is expected to remain the primary driver for this 40% market share through 2032.

By Sales Channel
- Retail Offline
- Retail Online
The segment has the highest share around the Sales Channel is Retail Offline, which grabbed 75% of the market. Supermarkets and hypermarkets remain the primary destination for healthy snacks, benefiting from high foot traffic and the ability to stock a vast array of both branded and private label options. Retailers like Coles and Woolworths have effectively leveraged this position by launching their own healthy lines, such as Coles Joyful and Plantitude, targeting both health-conscious and price-sensitive consumers who seek value amid inflationary pressures.
While offline retail holds the majority of the market, it is evolving to meet the needs of modern "on-the-go" consumers. Forecourt and convenience retailers are increasingly stocking chilled, plant-based, and high-protein snacks to capture impulse purchases. Although online channels are growing for bulk and specialized orders, the 75% share held by offline retail highlights the importance of in-store visibility and the "planned weekly shop" in maintaining the market's multi-billion dollar valuation.
List of Companies Covered in Australia Healthy Snacks Market
The companies listed below are highly influential in the Australia healthy snacks market, with a significant market share and a strong impact on industry developments.
- Mondelez International Inc
- Organic Times Pty Ltd
- Ceres Enterprises Ltd
- PepsiCo Inc
- Intersnack Group GmbH & Co KG
- Nestlé SA
- Kellanova
- Monde Nissin Corp
- Unilever Group
- Roma Food Products
Competitive Landscape
Australia healthy snacks market is increasingly competitive, driven by plant-based, gluten free, low sugar, and no allergens positioning. PepsiCo leads gluten free snacks with a 19% value share, supported by Lay’s, Sakata, and Red Rock Deli, though facing rising competition from smaller brands. Roma Food Products dominates no allergens snacks with a 50% share via Orgran, while major multinationals such as Mondelez, Nestlé, Unilever, and Lindt expand vegan and reduced sugar portfolios. Private label players including Coles Joyful, Woolworths Plantitude, and premium retailer lines are gaining traction through affordable better for you alternatives. Emerging brands like V’Good, Pana Organic, and SuperSeed intensify niche competition. Key differentiation opportunities lie in clean label, high protein, immune support, sustainable packaging, and compliant low or no added sugar formulations amid tightening regulation.
Frequently Asked Questions
Related Report
1. Market Segmentation
1.1. Research Scope
1.2. Research Methodology
1.3. Definitions and Assumptions
2. Executive Summary
3. Australia Healthy Snacks Market Policies, Regulations, and Standards
4. Australia Healthy Snacks Market Dynamics
4.1. Growth Factors
4.2. Challenges
4.3. Trends
4.4. Opportunities
5. Australia Healthy Snacks Market Statistics, 2022-2032F
5.1. Market Size & Growth Outlook
5.1.1.By Revenues in USD Million
5.2. Market Segmentation & Growth Outlook
5.2.1.By Category
5.2.1.1. Low/No Fat & Salt Snacks- Market Insights and Forecast 2022-2032, USD Million
5.2.1.1.1. Low Fat Snacks- Market Insights and Forecast 2022-2032, USD Million
5.2.1.1.2. No Fat Snacks- Market Insights and Forecast 2022-2032, USD Million
5.2.1.1.3. Low Salt Snacks- Market Insights and Forecast 2022-2032, USD Million
5.2.1.1.4. No Salt Snacks- Market Insights and Forecast 2022-2032, USD Million
5.2.1.2. Low/No Sugar & Caffeine Snacks- Market Insights and Forecast 2022-2032, USD Million
5.2.1.2.1. Low Sugar Snacks- Market Insights and Forecast 2022-2032, USD Million
5.2.1.2.2. No Sugar Snacks- Market Insights and Forecast 2022-2032, USD Million
5.2.1.2.3. No Added Sugar Snacks- Market Insights and Forecast 2022-2032, USD Million
5.2.1.2.4. No Caffeine Snacks- Market Insights and Forecast 2022-2032, USD Million
5.2.1.3. Allergy / Free-from / Specialized Diet Snacks- Market Insights and Forecast 2022-2032, USD Million
5.2.1.3.1. Gluten-Free Snacks- Market Insights and Forecast 2022-2032, USD Million
5.2.1.3.2. Dairy-Free Snacks- Market Insights and Forecast 2022-2032, USD Million
5.2.1.3.3. Lactose-Free Snacks- Market Insights and Forecast 2022-2032, USD Million
5.2.1.3.4. Hypoallergenic Snacks- Market Insights and Forecast 2022-2032, USD Million
5.2.1.3.5. Keto Snacks- Market Insights and Forecast 2022-2032, USD Million
5.2.1.3.6. Meat-Free Snacks- Market Insights and Forecast 2022-2032, USD Million
5.2.1.3.7. No Allergens Snacks- Market Insights and Forecast 2022-2032, USD Million
5.2.1.3.8. Plant-Based Snacks- Market Insights and Forecast 2022-2032, USD Million
5.2.1.3.9. Vegan Snacks- Market Insights and Forecast 2022-2032, USD Million
5.2.1.3.10. Vegetarian Snacks- Market Insights and Forecast 2022-2032, USD Million
5.2.1.3.11. Weight Management Snacks- Market Insights and Forecast 2022-2032, USD Million
5.2.1.4. Fortified / Nutrient-Enhanced Snacks- Market Insights and Forecast 2022-2032, USD Million
5.2.1.4.1. Good Source of Antioxidants Snacks- Market Insights and Forecast 2022-2032, USD Million
5.2.1.4.2. Good Source of Minerals Snacks- Market Insights and Forecast 2022-2032, USD Million
5.2.1.4.3. Good Source of Omega-3s Snacks- Market Insights and Forecast 2022-2032, USD Million
5.2.1.4.4. Good Source of Vitamins Snacks- Market Insights and Forecast 2022-2032, USD Million
5.2.1.4.5. High Fibre Snacks- Market Insights and Forecast 2022-2032, USD Million
5.2.1.4.6. High Protein Snacks- Market Insights and Forecast 2022-2032, USD Million
5.2.1.4.7. Probiotic Snacks- Market Insights and Forecast 2022-2032, USD Million
5.2.1.4.8. Superfruit Snacks- Market Insights and Forecast 2022-2032, USD Million
5.2.1.5. Health & Wellness-Oriented Snacks- Market Insights and Forecast 2022-2032, USD Million
5.2.1.5.1. Bone and Joint Health Snacks- Market Insights and Forecast 2022-2032, USD Million
5.2.1.5.2. Brain Health and Memory Snacks- Market Insights and Forecast 2022-2032, USD Million
5.2.1.5.3. Cardiovascular Health Snacks- Market Insights and Forecast 2022-2032, USD Million
5.2.1.5.4. Digestive Health Snacks- Market Insights and Forecast 2022-2032, USD Million
5.2.1.5.5. Energy Boosting Snacks- Market Insights and Forecast 2022-2032, USD Million
5.2.1.5.6. Immune Support Snacks- Market Insights and Forecast 2022-2032, USD Million
5.2.1.5.7. Skin Health Snacks- Market Insights and Forecast 2022-2032, USD Million
5.2.1.5.8. Vision Health Snacks- Market Insights and Forecast 2022-2032, USD Million
5.2.1.6. Natural Snacks- Market Insights and Forecast 2022-2032, USD Million
5.2.1.7. Organic Snacks- Market Insights and Forecast 2022-2032, USD Million
5.2.2.By Product Type
5.2.2.1. Meat Snacks- Market Insights and Forecast 2022-2032, USD Million
5.2.2.2. Nuts, Seeds & Trail Mixes- Market Insights and Forecast 2022-2032, USD Million
5.2.2.3. Dried Fruit Snacks- Market Insights and Forecast 2022-2032, USD Million
5.2.2.4. Cereal & Granola Bars- Market Insights and Forecast 2022-2032, USD Million
5.2.2.5. Others- Market Insights and Forecast 2022-2032, USD Million
5.2.3.By Packaging
5.2.3.1. Bag & Pouches- Market Insights and Forecast 2022-2032, USD Million
5.2.3.2. Boxes- Market Insights and Forecast 2022-2032, USD Million
5.2.3.3. Cans- Market Insights and Forecast 2022-2032, USD Million
5.2.3.4. Jars- Market Insights and Forecast 2022-2032, USD Million
5.2.3.5. Others- Market Insights and Forecast 2022-2032, USD Million
5.2.4.By Sales Channel
5.2.4.1. Retail Offline- Market Insights and Forecast 2022-2032, USD Million
5.2.4.2. Retail Online- Market Insights and Forecast 2022-2032, USD Million
5.2.5.By Competitors
5.2.5.1. Competition Characteristics
5.2.5.2. Market Share & Analysis
6. Australia Low/No Fat & Salt Snacks Healthy Snacks Market Statistics, 2022-2032
6.1. Market Size & Growth Outlook
6.1.1.By Revenues in USD Million
6.2. Market Segmentation & Growth Outlook
6.2.1.By Product Type- Market Insights and Forecast 2022-2032, USD Million
6.2.2.By Packaging- Market Insights and Forecast 2022-2032, USD Million
6.2.3.By Sales Channel- Market Insights and Forecast 2022-2032, USD Million
7. Australia Low/No Sugar & Caffeine Snacks Healthy Snacks Market Statistics, 2022-2032
7.1. Market Size & Growth Outlook
7.1.1.By Revenues in USD Million
7.2. Market Segmentation & Growth Outlook
7.2.1.By Product Type- Market Insights and Forecast 2022-2032, USD Million
7.2.2.By Packaging- Market Insights and Forecast 2022-2032, USD Million
7.2.3.By Sales Channel- Market Insights and Forecast 2022-2032, USD Million
8. Australia Allergy / Free-from / Specialized Diet Snacks Healthy Snacks Market Statistics, 2022-2032
8.1. Market Size & Growth Outlook
8.1.1.By Revenues in USD Million
8.2. Market Segmentation & Growth Outlook
8.2.1.By Product Type- Market Insights and Forecast 2022-2032, USD Million
8.2.2.By Packaging- Market Insights and Forecast 2022-2032, USD Million
8.2.3.By Sales Channel- Market Insights and Forecast 2022-2032, USD Million
9. Australia Fortified / Nutrient-Enhanced Snacks Healthy Snacks Market Statistics, 2022-2032
9.1. Market Size & Growth Outlook
9.1.1.By Revenues in USD Million
9.2. Market Segmentation & Growth Outlook
9.2.1.By Product Type- Market Insights and Forecast 2022-2032, USD Million
9.2.2.By Packaging- Market Insights and Forecast 2022-2032, USD Million
9.2.3.By Sales Channel- Market Insights and Forecast 2022-2032, USD Million
10. Australia Health & Wellness-Oriented Snacks Healthy Snacks Market Statistics, 2022-2032
10.1. Market Size & Growth Outlook
10.1.1. By Revenues in USD Million
10.2. Market Segmentation & Growth Outlook
10.2.1. By Product Type- Market Insights and Forecast 2022-2032, USD Million
10.2.2. By Packaging- Market Insights and Forecast 2022-2032, USD Million
10.2.3. By Sales Channel- Market Insights and Forecast 2022-2032, USD Million
11. Australia Natural Snacks Healthy Snacks Market Statistics, 2022-2032
11.1. Market Size & Growth Outlook
11.1.1. By Revenues in USD Million
11.2. Market Segmentation & Growth Outlook
11.2.1. By Product Type- Market Insights and Forecast 2022-2032, USD Million
11.2.2. By Packaging- Market Insights and Forecast 2022-2032, USD Million
11.2.3. By Sales Channel- Market Insights and Forecast 2022-2032, USD Million
12. Australia Organic Snacks Healthy Snacks Market Statistics, 2022-2032
12.1. Market Size & Growth Outlook
12.1.1. By Revenues in USD Million
12.2. Market Segmentation & Growth Outlook
12.2.1. By Product Type- Market Insights and Forecast 2022-2032, USD Million
12.2.2. By Packaging- Market Insights and Forecast 2022-2032, USD Million
12.2.3. By Sales Channel- Market Insights and Forecast 2022-2032, USD Million
13. Competitive Outlook
13.1. Company Profiles
13.1.1. PepsiCo Inc
13.1.1.1. Business Description
13.1.1.2. Product Portfolio
13.1.1.3. Collaborations & Alliances
13.1.1.4. Recent Developments
13.1.1.5. Financial Details
13.1.1.6. Others
13.1.2. Intersnack Group GmbH & Co KG
13.1.2.1. Business Description
13.1.2.2. Product Portfolio
13.1.2.3. Collaborations & Alliances
13.1.2.4. Recent Developments
13.1.2.5. Financial Details
13.1.2.6. Others
13.1.3. Nestlé SA
13.1.3.1. Business Description
13.1.3.2. Product Portfolio
13.1.3.3. Collaborations & Alliances
13.1.3.4. Recent Developments
13.1.3.5. Financial Details
13.1.3.6. Others
13.1.4. Kellanova
13.1.4.1. Business Description
13.1.4.2. Product Portfolio
13.1.4.3. Collaborations & Alliances
13.1.4.4. Recent Developments
13.1.4.5. Financial Details
13.1.4.6. Others
13.1.5. Monde Nissin Corp
13.1.5.1. Business Description
13.1.5.2. Product Portfolio
13.1.5.3. Collaborations & Alliances
13.1.5.4. Recent Developments
13.1.5.5. Financial Details
13.1.5.6. Others
13.1.6. Mondelez International Inc
13.1.6.1. Business Description
13.1.6.2. Product Portfolio
13.1.6.3. Collaborations & Alliances
13.1.6.4. Recent Developments
13.1.6.5. Financial Details
13.1.6.6. Others
13.1.7. Organic Times Pty Ltd
13.1.7.1. Business Description
13.1.7.2. Product Portfolio
13.1.7.3. Collaborations & Alliances
13.1.7.4. Recent Developments
13.1.7.5. Financial Details
13.1.7.6. Others
13.1.8. Ceres Enterprises Ltd
13.1.8.1. Business Description
13.1.8.2. Product Portfolio
13.1.8.3. Collaborations & Alliances
13.1.8.4. Recent Developments
13.1.8.5. Financial Details
13.1.8.6. Others
13.1.9. Unilever Group
13.1.9.1. Business Description
13.1.9.2. Product Portfolio
13.1.9.3. Collaborations & Alliances
13.1.9.4. Recent Developments
13.1.9.5. Financial Details
13.1.9.6. Others
13.1.10. Roma Food Products
13.1.10.1.Business Description
13.1.10.2.Product Portfolio
13.1.10.3.Collaborations & Alliances
13.1.10.4.Recent Developments
13.1.10.5.Financial Details
13.1.10.6.Others
14. Disclaimer
| Segment | Sub-Segment |
|---|---|
| By Category |
|
| By Product Type |
|
| By Packaging |
|
| By Sales Channel |
|
Research Methodology
This study followed a structured approach comprising four key phases to assess the size and scope of the electro-oxidation market. The process began with thorough secondary research to collect data on the target market, related markets, and broader industry context. These findings, along with preliminary assumptions and estimates, were then validated through extensive primary research involving industry experts from across the value chain. To calculate the overall market size, both top-down and bottom-up methodologies were employed. Finally, market segmentation and data triangulation techniques were applied to refine and validate segment-level estimations.
Secondary Research
The secondary research phase involved gathering data from a wide range of credible and published sources. This step helped in identifying industry trends, defining market segmentation, and understanding the market landscape and value chain.
Sources consulted during this phase included:
- Company annual reports, investor presentations, and press releases
- Industry white papers and certified publications
- Trade directories and market-recognized databases
- Articles from authoritative authors and reputable journals
- Gold and silver standard websites
Secondary research was critical in mapping out the industry's value chain and monetary flow, identifying key market segments, understanding regional variations, and tracking significant industry developments.
Other key sources:
- Financial disclosures
- Industry associations and trade bodies
- News outlets and business magazines
- Academic journals and research studies
- Paid industry databases
Primary Research
To validate secondary data and gain deeper market insights, primary research was conducted with key stakeholders across both the supply and demand sides of the market.
On the demand side, participants included decision-makers and influencers from end-user industries—such as CIOs, CTOs, and CSOs—who provided first-hand perspectives on market needs, product usage, and future expectations.
On the supply side, interviews were conducted with manufacturers, industry associations, and institutional participants to gather insights into current offerings, product pipelines, and market challenges.
Primary interviews provided critical inputs such as:
- Market size and revenue data
- Product and service breakdowns
- Market forecasts
- Regional and application-specific trends
Stakeholders consulted included:
- Leading OEM and solution providers
- Channel and distribution partners
- End users across various applications
- Independent consultants and industry specialists
Market Size Estimation and Data Triangulation
- Identifying Key Market Participants (Secondary Research)
- Goal: To identify the major players or companies in the target market. This typically involves using publicly available data sources such as industry reports, market research publications, and financial statements of companies.
- Tools: Reports from firms like Gartner, Forrester, Euromonitor, Statista, IBISWorld, and others. Public financial statements, news articles, and press releases from top market players.
- Extracting Earnings of Key Market Participants
- Goal: To estimate the earnings generated from the product or service being analyzed. This step helps in understanding the revenue potential of each market player in a specific geography.
- Methods: Earnings data can be gathered from:
- Publicly available financial reports (for listed companies).
- Interviews and primary data sources from professionals, such as Directors, VPs, SVPs, etc. This is especially useful for understanding more nuanced, internal data that isn't publicly disclosed.
- Annual reports and investor presentations of key players.
- Data Collation and Development of a Relevant Data Model
- Goal: To collate inputs from both primary and secondary sources into a structured, data-driven model for market estimation. This model will incorporate key market KPIs and any independent variables relevant to the market.
- Key KPIs: These could include:
- Market size, growth rate, and demand drivers.
- Industry-specific metrics like market share, average revenue per customer (ARPC), or average deal size.
- External variables, such as economic growth rates, inflation rates, or commodity prices, that could affect the market.
- Data Modeling: Based on this data, the market forecasts are developed for the next 5 years. A combination of trend analysis, scenario modeling, and statistical regression might be used to generate projections.
- Scenario Analysis
- Goal: To test different assumptions and validate how sensitive the market is to changes in key variables (e.g., market demand, regulatory changes, technological disruptions).
- Types of Scenarios:
- Base Case: Based on current assumptions and historical data.
- Best-Case Scenario: Assuming favorable market conditions, regulatory environments, and technological advancements.
- Worst-Case Scenario: Accounting for adverse factors, such as economic downturns, stricter regulations, or unexpected disruptions.


