Australia Cards and Payments Market Report: Trends, Growth and Forecast (2026-2032)
By Instrument Type (Cards (Debit Card, Charge Card, ATM Card, Pre-Paid Card, Credit Card, Store Card), Mobile Wallets, Cheques, Others), By Card Type (Contact Smart Card, Contactless Smart Card, Non-Smart Card), By Type of Payments (B2B, B2C, C2C, C2B (E-commerce Shopping, Payment at POS Terminals)), By Transaction Type (Domestic, Foreign), By Application (Food & Groceries, Health & Pharmacies, Travel & Tourism, Hospitality, Others (Media & Entertainment)) ... Read more
|
Major Players
|
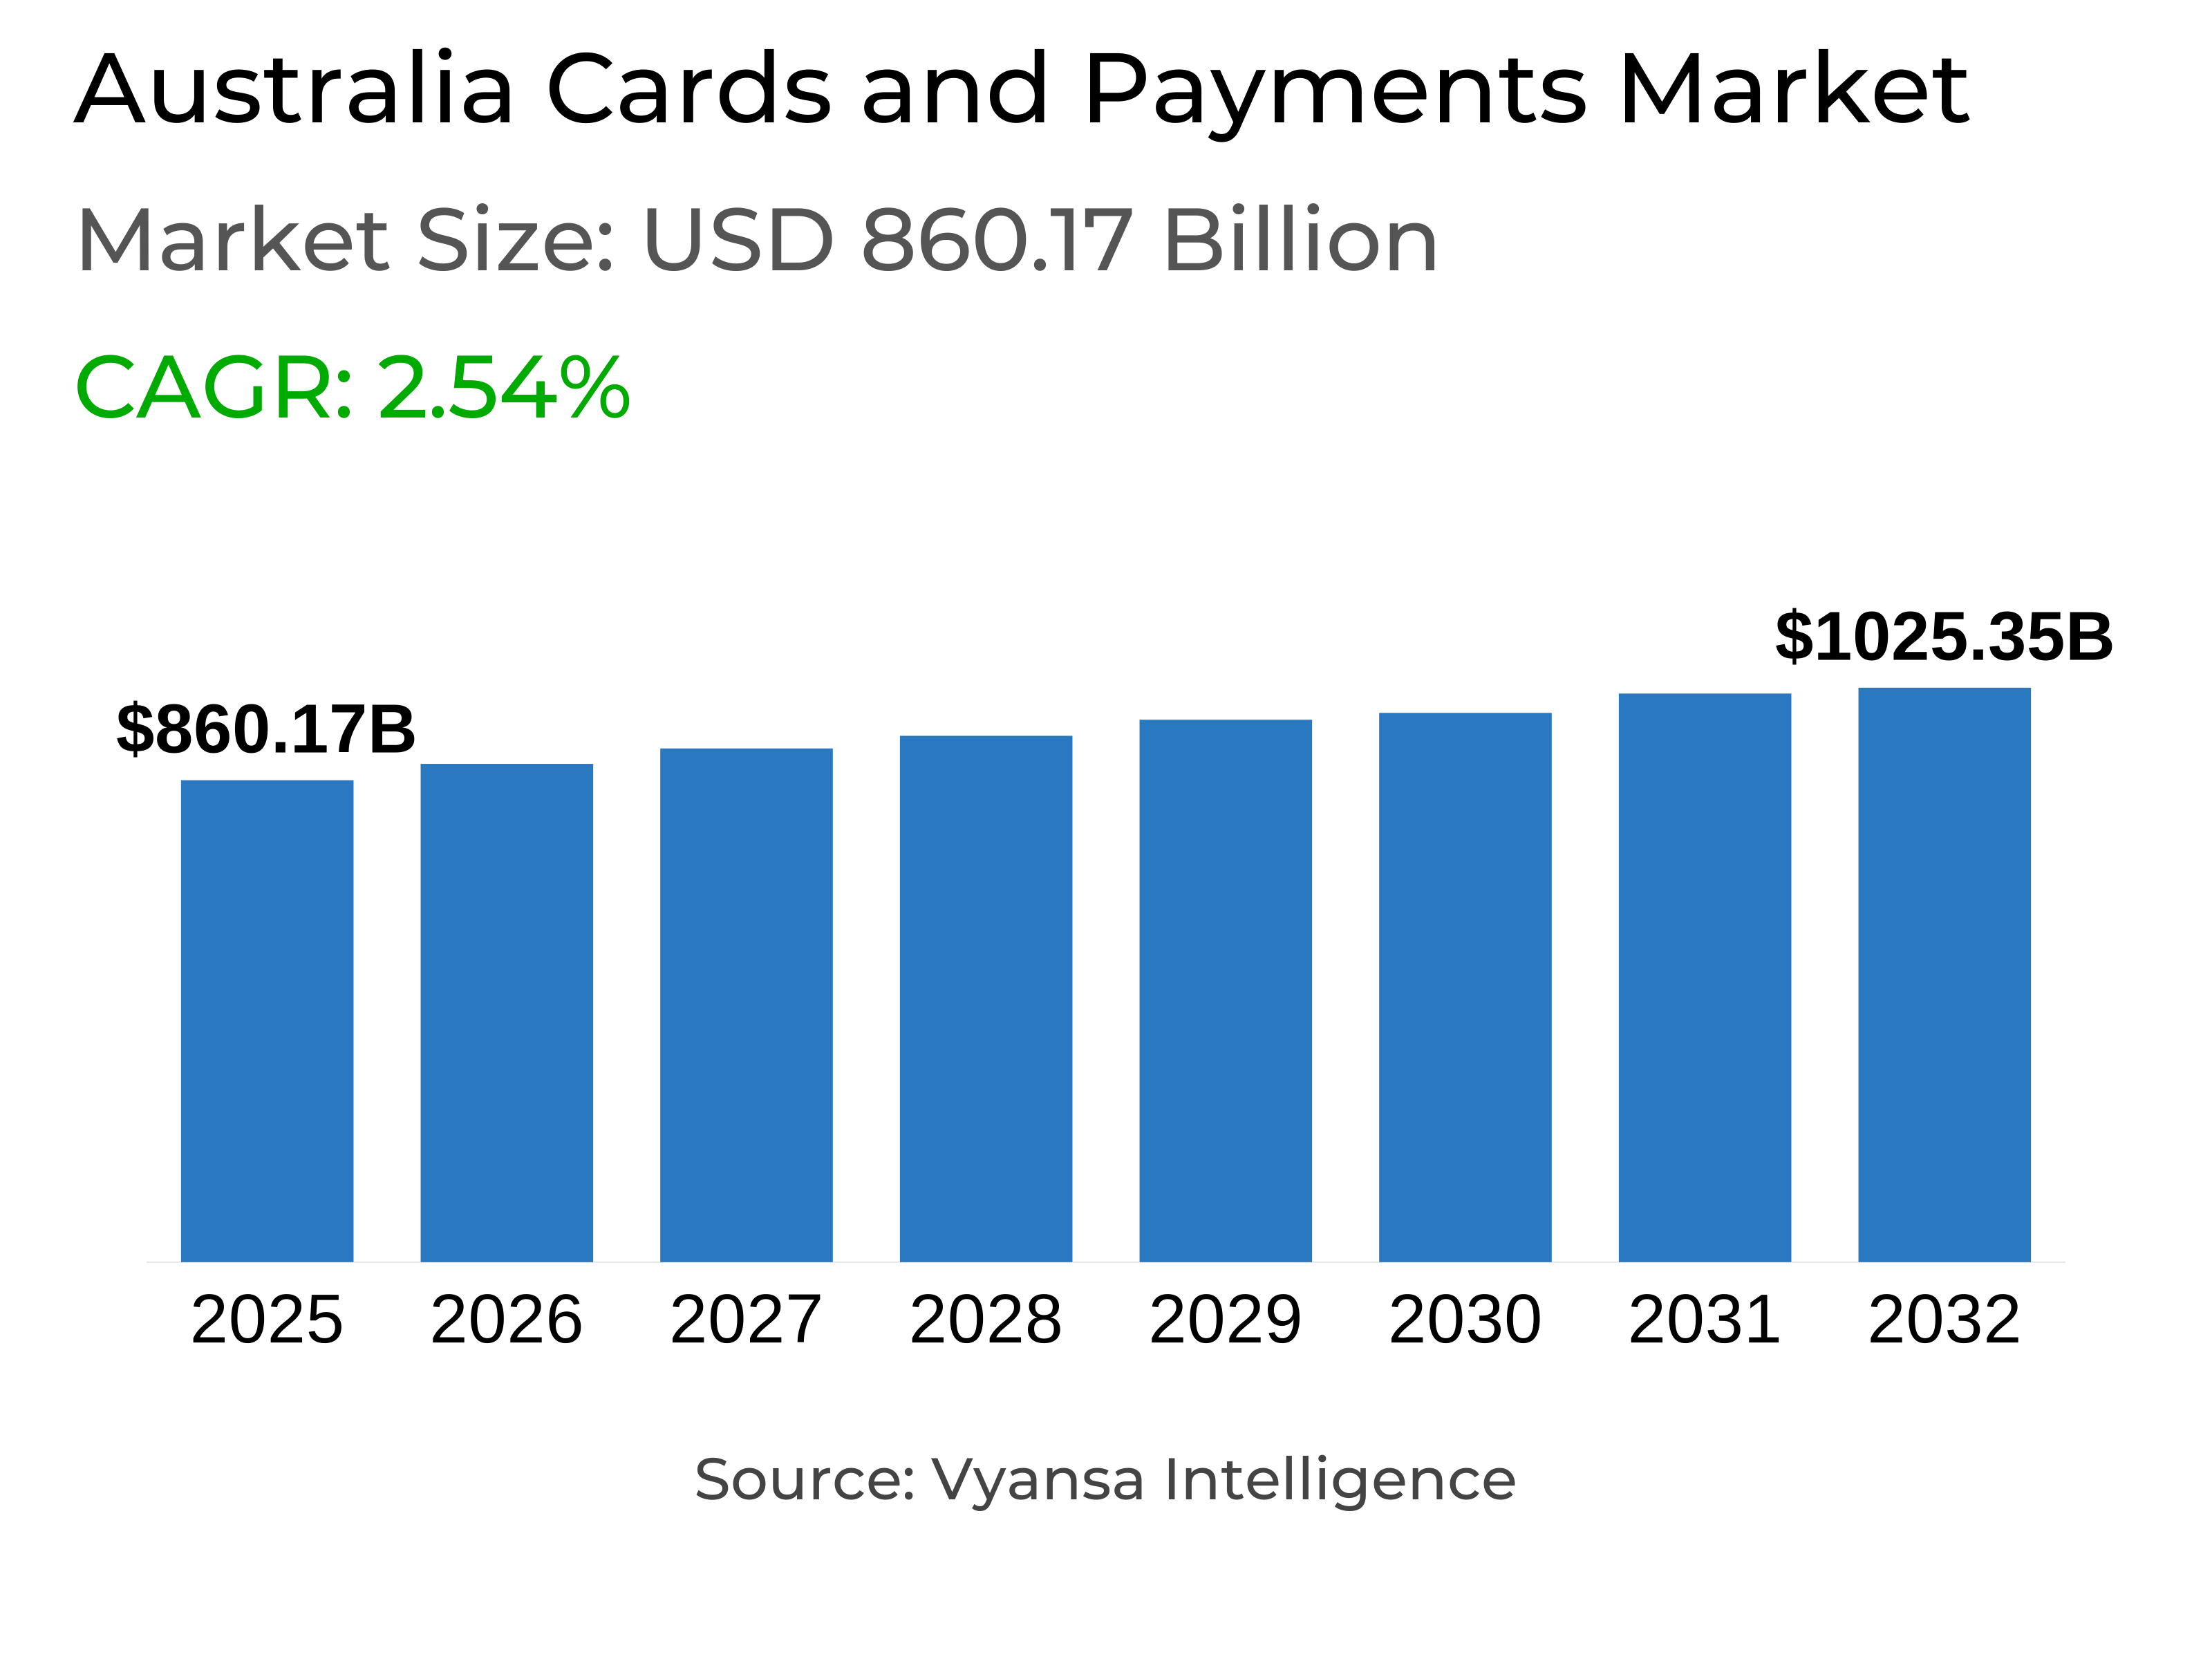
Australia Cards and Payments Market Statistics and Insights, 2026
- Market Size Statistics
- Cards and Payments in Australia is estimated at $ 860.17 Billion.
- The market size is expected to grow to $ 1025.35 Billion by 2032.
- Market to register a CAGR of around 2.54% during 2026-32.
- Instrument Type Shares
- Cards grabbed market share of 85%.
- Cards to witness a volume CAGR of around 0.78%.
- Competition
- More than 10 companies are actively engaged in producing Cards and Payments in Australia.
- Top 5 companies acquired 85% of the market share.
- HSBC Bank Australia Ltd, Heritage Bank Ltd, Diners Club Pty Ltd, Commonwealth Bank of Australia (CBA), Westpac Banking Corp etc., are few of the top companies.
- Card Type
- Contactless Smart Card grabbed 90% of the market.
Australia Cards and Payments Market Outlook
The market for payments and cards in Australia is expected to keep growing steadily, with market size growing from USD 860.17 billion to USD 1,025.35 billion by 2032. Growth will be moderate as End users move towards more convenient and digital-first payment options. Debit cards and electronic payment will continue to lead, with the reliance on credit cards slowing down as cost-of-living pressures decrease.
A distinguishing trend will be the extensive adoption of contactless smart cards, already taking almost 90% of the market. End users are increasingly opting for convenience and speed at the checkout, and digital wallets and electronic payments are solidifying their position as mainstream choices. Nevertheless, the rate of growth in digital payments indicates maturity, and there are signs that future innovation will play an important role in maintaining momentum.
E-commerce will continue to be one of the main drivers, with higher volumes occurring without the cardholder present. This is a permanent change in shopping habits, even as growth rates return to normal following the lockdown-fueled bonanza. Public transport ticketing initiatives, especially across states outside New South Wales, will continue to fuel contactless take-up, although closed-loop prepaid cards will continue to be relevant among some commuter demographics.
Ahead, the use of cash will keep on declining as Australia moves towards a near cashless society. The cards segment is expected to post a volume CAGR of approximately 0.78% on the back of high merchant acceptance and adapting digital infrastructure. Even with continued market consolidation by the big banks, End users needs for convenience and freedom in payment will frame the next growth phase.

Australia Cards and Payments Market Trend
Shift from Cash to Digital Payments
Even with a brief increase, cash usage in Australia remains on the decline as the nation inches further along the path toward a cashless economy. Ongoing consolidation of physical bank branches and ATMs restricts End users' access to cash, leading them toward use of bank cards and electronic payments.
Acceptance of Visa and Mastercard is close to 100%, and even when surcharges are sometimes applied, card usage is the preferred method for most End users, de-emphasizing the use of cash for goods and services. While still legally acceptable, the trend is away from End users use of cash, demonstrating the ongoing phasing out of cash in the Australia economy.
Australia Cards and Payments Market Opportunity
Public transport smart ticketing expansion
Australia public transportation will provide substantial opportunities for the payments and cards market as additional states move towards contactless ticketing. New South Wales already allows passengers to pay using debit or credit cards, or mobile wallets, instead of the Opal card. This progression offers greater convenience, quicker processing, and ease of digital payments.
Other jurisdictions are likely to follow suit, with Victoria scheduled to improve its systems and Queensland already implementing smart ticketing. With these upgrades on the way, tens of millions of passengers will move away from closed loop pre-paid cards to open loop systems that support bank cards and digital wallets. This change will enhance End users choice, encourage broader acceptance of contactless payments, and underpin long-term growth in the cards and payments markets, yet maintain an existence for closed loop cards for their security advantages.
Unlock Market Intelligence
Explore the market potential with our data-driven report
Australia Cards and Payments Market Segmentation Analysis

By Instrument Type
- Cards
- Mobile Wallets
- Cheques
- Others
The largest market share segment under By Instrument Type is Cards, which represented 85% of the Australia payments market. Debit and credit cards remain the favorite instruments among End users, with debit cards controlling daily transactions while credit cards are used mostly for necessities or emergencies. Personal funding remains robust, and although there has been temporary inflation-driven growth in the use of credit cards, End users are slowly returning to expenditure from their own resources. Charge cards continue to be niche, serving the rich with high-end benefits.
Cards are projected to have a volume CAGR of approximately 0.78% during the forecast period. Their universal acceptance coupled with the integration of digital wallets guarantees consistent usage despite the growing use of electronic payment methods. The superiority of cards indicates the continued demand for secure, convenient, and efficient payment tools in Australia
Top Companies in Australia Cards and Payments Market
The top companies operating in the market include HSBC Bank Australia Ltd, Heritage Bank Ltd, Diners Club Pty Ltd, Commonwealth Bank of Australia (CBA), Westpac Banking Corp, National Australia Bank Group (NAB), ANZ Banking Group Ltd, American Express Co, Qantas Group, WEX Australia Pty Ltd, etc., are the top players operating in the Australia Cards and Payments Market.
Frequently Asked Questions
Related Report
1. Market Segmentation
1.1. Research Scope
1.2. Research Methodology
1.3. Definitions and Assumptions
2. Executive Summary
3. Australia Cards and Payments Market Policies, Regulations, and Standards
4. Australia Cards and Payments Market Dynamics
4.1. Growth Factors
4.2. Challenges
4.3. Trends
4.4. Opportunities
5. Australia Cards and Payments Market Statistics, 2022-2032F
5.1. Market Size & Growth Outlook
5.1.1. By Revenues in US$ Million
5.2. Market Segmentation & Growth Outlook
5.2.1. By Instrument Type
5.2.1.1. Cards- Market Insights and Forecast 2022-2032, USD Million
5.2.1.1.1. Debit Card- Market Insights and Forecast 2022-2032, USD Million
5.2.1.1.2. Charge Card- Market Insights and Forecast 2022-2032, USD Million
5.2.1.1.3. ATM Card- Market Insights and Forecast 2022-2032, USD Million
5.2.1.1.4. Pre-Paid Card- Market Insights and Forecast 2022-2032, USD Million
5.2.1.1.5. Credit Card- Market Insights and Forecast 2022-2032, USD Million
5.2.1.1.6. Store Card- Market Insights and Forecast 2022-2032, USD Million
5.2.1.2. Mobile Wallets- Market Insights and Forecast 2022-2032, USD Million
5.2.1.3. Cheques- Market Insights and Forecast 2022-2032, USD Million
5.2.1.4. Others- Market Insights and Forecast 2022-2032, USD Million
5.2.2. By Card Type
5.2.2.1. Contact Smart Card- Market Insights and Forecast 2022-2032, USD Million
5.2.2.2. Contactless Smart Card- Market Insights and Forecast 2022-2032, USD Million
5.2.2.3. Non-Smart Card- Market Insights and Forecast 2022-2032, USD Million
5.2.3. By Type of Payments
5.2.3.1. B2B- Market Insights and Forecast 2022-2032, USD Million
5.2.3.2. B2C- Market Insights and Forecast 2022-2032, USD Million
5.2.3.3. C2C- Market Insights and Forecast 2022-2032, USD Million
5.2.3.4. C2B- Market Insights and Forecast 2022-2032, USD Million
5.2.3.4.1. E-commerce Shopping- Market Insights and Forecast 2022-2032, USD Million
5.2.3.4.2. Payment at POS Terminals- Market Insights and Forecast 2022-2032, USD Million
5.2.4. By Transaction Type
5.2.4.1. Domestic- Market Insights and Forecast 2022-2032, USD Million
5.2.4.2. Foreign- Market Insights and Forecast 2022-2032, USD Million
5.2.5. By Application
5.2.5.1. Food & Groceries- Market Insights and Forecast 2022-2032, USD Million
5.2.5.2. Health & Pharmacies- Market Insights and Forecast 2022-2032, USD Million
5.2.5.3. Travel & Tourism- Market Insights and Forecast 2022-2032, USD Million
5.2.5.4. Hospitality- Market Insights and Forecast 2022-2032, USD Million
5.2.5.5. Others (Media & Entertainment)- Market Insights and Forecast 2022-2032, USD Million
5.2.6. By Competitors
5.2.6.1. Competition Characteristics
5.2.6.2. Market Share & Analysis
6. Australia Cards Market Statistics, 2022-2032F
6.1. Market Size & Growth Outlook
6.1.1. By Revenues in US$ Million
6.2. Market Segmentation & Growth Outlook
6.2.1. By Card Type- Market Insights and Forecast 2022-2032, USD Million
6.2.2. By Type of Payments- Market Insights and Forecast 2022-2032, USD Million
6.2.3. By Transaction Type- Market Insights and Forecast 2022-2032, USD Million
6.2.4. By Application- Market Insights and Forecast 2022-2032, USD Million
7. Australia Mobile Wallets Market Statistics, 2022-2032F
7.1. Market Size & Growth Outlook
7.1.1. By Revenues in US$ Million
7.2. Market Segmentation & Growth Outlook
7.2.1. By Type of Payments- Market Insights and Forecast 2022-2032, USD Million
7.2.2. By Transaction Type- Market Insights and Forecast 2022-2032, USD Million
7.2.3. By Application- Market Insights and Forecast 2022-2032, USD Million
8. Australia Cheques Market Statistics, 2022-2032F
8.1. Market Size & Growth Outlook
8.1.1. By Revenues in US$ Million
8.2. Market Segmentation & Growth Outlook
8.2.1. By Type of Payments- Market Insights and Forecast 2022-2032, USD Million
8.2.2. By Transaction Type- Market Insights and Forecast 2022-2032, USD Million
8.2.3. By Application- Market Insights and Forecast 2022-2032, USD Million
9. Competitive Outlook
9.1. Company Profiles
9.1.1. Commonwealth Bank of Australia (CBA)
9.1.1.1. Business Description
9.1.1.2. Product Portfolio
9.1.1.3. Collaborations & Alliances
9.1.1.4. Recent Developments
9.1.1.5. Financial Details
9.1.1.6. Others
9.1.2. Westpac Banking Corp
9.1.2.1. Business Description
9.1.2.2. Product Portfolio
9.1.2.3. Collaborations & Alliances
9.1.2.4. Recent Developments
9.1.2.5. Financial Details
9.1.2.6. Others
9.1.3. National Australia Bank Group (NAB)
9.1.3.1. Business Description
9.1.3.2. Product Portfolio
9.1.3.3. Collaborations & Alliances
9.1.3.4. Recent Developments
9.1.3.5. Financial Details
9.1.3.6. Others
9.1.4. ANZ Banking Group Ltd
9.1.4.1. Business Description
9.1.4.2. Product Portfolio
9.1.4.3. Collaborations & Alliances
9.1.4.4. Recent Developments
9.1.4.5. Financial Details
9.1.4.6. Others
9.1.5. American Express Co
9.1.5.1. Business Description
9.1.5.2. Product Portfolio
9.1.5.3. Collaborations & Alliances
9.1.5.4. Recent Developments
9.1.5.5. Financial Details
9.1.5.6. Others
9.1.6. HSBC Bank Australia Ltd
9.1.6.1. Business Description
9.1.6.2. Product Portfolio
9.1.6.3. Collaborations & Alliances
9.1.6.4. Recent Developments
9.1.6.5. Financial Details
9.1.6.6. Others
9.1.7. Heritage Bank Ltd
9.1.7.1. Business Description
9.1.7.2. Product Portfolio
9.1.7.3. Collaborations & Alliances
9.1.7.4. Recent Developments
9.1.7.5. Financial Details
9.1.7.6. Others
9.1.8. Diners Club Pty Ltd
9.1.8.1. Business Description
9.1.8.2. Product Portfolio
9.1.8.3. Collaborations & Alliances
9.1.8.4. Recent Developments
9.1.8.5. Financial Details
9.1.8.6. Others
9.1.9. Qantas Group
9.1.9.1. Business Description
9.1.9.2. Product Portfolio
9.1.9.3. Collaborations & Alliances
9.1.9.4. Recent Developments
9.1.9.5. Financial Details
9.1.9.6. Others
9.1.10. WEX Australia Pty Ltd
9.1.10.1. Business Description
9.1.10.2. Product Portfolio
9.1.10.3. Collaborations & Alliances
9.1.10.4. Recent Developments
9.1.10.5. Financial Details
9.1.10.6. Others
10. Disclaimer
| Segment | Sub-Segment |
|---|---|
| By Instrument Type |
|
| By Card Type |
|
| By Type of Payments |
|
| By Transaction Type |
|
| By Application |
|
Research Methodology
This study followed a structured approach comprising four key phases to assess the size and scope of the electro-oxidation market. The process began with thorough secondary research to collect data on the target market, related markets, and broader industry context. These findings, along with preliminary assumptions and estimates, were then validated through extensive primary research involving industry experts from across the value chain. To calculate the overall market size, both top-down and bottom-up methodologies were employed. Finally, market segmentation and data triangulation techniques were applied to refine and validate segment-level estimations.
Secondary Research
The secondary research phase involved gathering data from a wide range of credible and published sources. This step helped in identifying industry trends, defining market segmentation, and understanding the market landscape and value chain.
Sources consulted during this phase included:
- Company annual reports, investor presentations, and press releases
- Industry white papers and certified publications
- Trade directories and market-recognized databases
- Articles from authoritative authors and reputable journals
- Gold and silver standard websites
Secondary research was critical in mapping out the industry's value chain and monetary flow, identifying key market segments, understanding regional variations, and tracking significant industry developments.
Other key sources:
- Financial disclosures
- Industry associations and trade bodies
- News outlets and business magazines
- Academic journals and research studies
- Paid industry databases
Primary Research
To validate secondary data and gain deeper market insights, primary research was conducted with key stakeholders across both the supply and demand sides of the market.
On the demand side, participants included decision-makers and influencers from end-user industries—such as CIOs, CTOs, and CSOs—who provided first-hand perspectives on market needs, product usage, and future expectations.
On the supply side, interviews were conducted with manufacturers, industry associations, and institutional participants to gather insights into current offerings, product pipelines, and market challenges.
Primary interviews provided critical inputs such as:
- Market size and revenue data
- Product and service breakdowns
- Market forecasts
- Regional and application-specific trends
Stakeholders consulted included:
- Leading OEM and solution providers
- Channel and distribution partners
- End users across various applications
- Independent consultants and industry specialists
Market Size Estimation and Data Triangulation
- Identifying Key Market Participants (Secondary Research)
- Goal: To identify the major players or companies in the target market. This typically involves using publicly available data sources such as industry reports, market research publications, and financial statements of companies.
- Tools: Reports from firms like Gartner, Forrester, Euromonitor, Statista, IBISWorld, and others. Public financial statements, news articles, and press releases from top market players.
- Extracting Earnings of Key Market Participants
- Goal: To estimate the earnings generated from the product or service being analyzed. This step helps in understanding the revenue potential of each market player in a specific geography.
- Methods: Earnings data can be gathered from:
- Publicly available financial reports (for listed companies).
- Interviews and primary data sources from professionals, such as Directors, VPs, SVPs, etc. This is especially useful for understanding more nuanced, internal data that isn't publicly disclosed.
- Annual reports and investor presentations of key players.
- Data Collation and Development of a Relevant Data Model
- Goal: To collate inputs from both primary and secondary sources into a structured, data-driven model for market estimation. This model will incorporate key market KPIs and any independent variables relevant to the market.
- Key KPIs: These could include:
- Market size, growth rate, and demand drivers.
- Industry-specific metrics like market share, average revenue per customer (ARPC), or average deal size.
- External variables, such as economic growth rates, inflation rates, or commodity prices, that could affect the market.
- Data Modeling: Based on this data, the market forecasts are developed for the next 5 years. A combination of trend analysis, scenario modeling, and statistical regression might be used to generate projections.
- Scenario Analysis
- Goal: To test different assumptions and validate how sensitive the market is to changes in key variables (e.g., market demand, regulatory changes, technological disruptions).
- Types of Scenarios:
- Base Case: Based on current assumptions and historical data.
- Best-Case Scenario: Assuming favorable market conditions, regulatory environments, and technological advancements.
- Worst-Case Scenario: Accounting for adverse factors, such as economic downturns, stricter regulations, or unexpected disruptions.


