Argentina Juice Market Report: Trends, Growth and Forecast (2026-2032)
By Category (100% Juice (Not from Concentrate, Reconstituted), Juice Drinks (up to 24% Juice), Nectars (High Concentration (40% to 50% fruit content), Medium Concentration (30% to 39% fruit content), Low Concentration (25% to 29% fruit content)), Vegetable Juice, Fruit and Vegetable Blends), By Nature (Conventional, Organic), By Packaging Material (Plastic, Glass, Metal, Others), By Packaging Type (PET Bottles, Aseptic Packages (Cartons), Glass Bottles, Metal Cans, Disposable Cups & Pouches), By Sales Channel (Off-Trade (Hypermarkets/ Supermarkets, Retail Outlets, Convenience Stores, Online Platforms), On-Trade) ... Read more
|
Major Players
|
Argentina Juice Market Statistics and Insights, 2026
- Market Size Statistics
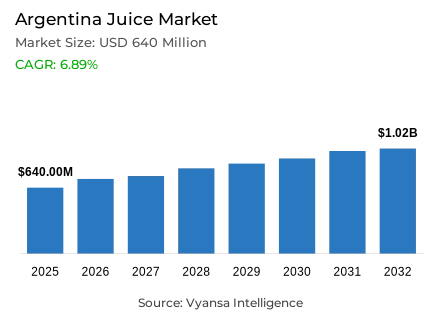
- Juice in Argentina is estimated at USD 640 million in 2025.
- The market size is expected to grow to USD 1.02 billion by 2032.
- Market to register a cagr of around 6.89% during 2026-32.
- Category Shares
- Nectars grabbed market share of 65%.
- Competition
- More than 15 companies are actively engaged in producing juice in Argentina.
- Top 5 companies acquired around 85% of the market share.
- Record CD SA, Arcor SAIC, Refres Now SA, Coca-Cola Argentina SA, El Carmen SA etc., are few of the top companies.
- Sales Channel
- Off-trade grabbed 80% of the market.
Argentina Juice Market Outlook
Argentina juice market is emerging from a period of severe inflation and economic contraction into a phase of health-led recovery. Following a sharp volume decline in 2024, the category rebounded in 2025 as economic conditions stabilised and consumers shifted toward more natural beverage choices. The market is projected to reach USD 640 million in 2025 and USD 1.02 billion by 2032, registering a CAGR of approximately 6.89% during 2026–2032.
Consumer behaviour reflects a balance between premiumisation and affordability. Demand for 100% not-from-concentrate juice is rising among middle- and high-income households due to health benefits and the absence of artificial additives. At the same time, nectars retain a 65% market share, remaining essential for budget-constrained families. As economic recovery continues, gradual trading up toward more natural juice-based products is expected.
Environmental pressures are also reshaping the category. Climate variability has affected fruit supply, particularly citrus, prompting manufacturers to adjust formulations by reducing orange content and introducing blends such as passion fruit and strawberry. Innovation is increasingly focused on functional benefits, including antioxidant- and vitamin-fortified juices and energy-enhancing ingredients such as ginger and green tea, packaged in convenient single-serve formats.
Retail dynamics continue to evolve, with growing modernisation and digital penetration. While neighbourhood stores remain relevant, discounters and hypermarkets are gaining share through broader assortments and private labels. Off-trade channels account for 80% of sales, reflecting the home-centric nature of juice consumption. Expanding retail online—via direct-to-consumer platforms and specialist health retailers—is further transforming purchasing behaviour across the country.

Argentina Juice Market Growth Driver
Health-Led Preference for Natural Juice
In Argentina, health and wellness factors are becoming increasingly important in juice purchasing decisions. Consumers are demanding products with simpler ingredient labels and those perceived as more natural, leading to increased attention toward 100% juice and not-from-concentrate variants compared to lower-juice alternatives. This preference is most evident among middle- and high-income households, which can prioritise perceived quality and nutritional value despite broader budget constraints.
This trend aligns with the country elevated diet-related risk profile. PAHO reports that overweight and obesity were prevalent among people aged 15 years and above in Argentina in 2022 68.4%. This health context heightens sensitivity to sugar and additive content, supporting the premium positioning of juice based on pure fruit content, minimal processing, and functional nutrition messaging.
Argentina Juice Market Challenge
Affordability Pressures Keep the Category Price-Sensitive
Juice demand remains highly price-sensitive, with many consumers downgrading or postponing purchases when prices rise. Under constrained budgets, low-juice options and promotional offers play a critical role, while high-end 100% juice becomes less accessible to the broader population. This dynamic limits impulse purchases and steers shoppers toward entry-price packs.
Macroeconomic conditions reinforce this caution. According to the National Institute of Statistics and Censuses (INDEC), consumer prices increased 117.8% in 2024. INDEC also reports that average total household income rose 87.8% in the first half of 2024, while the basic total basket (CBT) increased 119.3%, eroding real purchasing power. Reflecting this strain, 52.9% of residents across 31 urban agglomerations were living below the poverty line in the first half of 2024.
Unlock Market Intelligence
Explore the market potential with our data-driven report
Argentina Juice Market Trend
Digital Channels Gain Relevance in Everyday Shopping
Online grocery and marketplace shopping is becoming an increasingly frequent channel for juice purchases, particularly for consumers seeking quick price comparisons or broader access to pack sizes and flavours. Manufacturers and retailers are expanding official storefronts, delivery partnerships, and click-and-collect services to extend reach beyond traditional neighbourhood stores. These platforms also support premium discovery, enabling consumers to explore niche 100% juice and functional options.
This shift is underpinned by strong connectivity. According to INDEC’s MAUTIC survey, 93.7% of urban households had internet access in the fourth quarter of 2024, while overall internet penetration reached 89.7% among individuals aged four years and above. Mobile phone usage stood at 90.5%, structurally enabling digital promotion and app-based purchasing for beverage brands and retailers.
Argentina Juice Market Opportunity
Scope to Win with Reformulated, Better-for-You Offers
Juice manufacturers have a clear opportunity to add value by offering products that address health concerns while remaining affordable. These include 100% juice positioned around natural ingredients and blends with added functional components, such as vitamins or detox-style mixes, provided sugar levels remain controlled and ingredient lists remain simple. Single-serve formats also align well with school environments and impulse consumption, encouraging trial.
The easing inflationary environment provides greater scope for innovation and marketing investment. INDEC reports inflation at 31.5% in 2025, significantly lower than the triple-digit rate of 2024, slowing the pace of shelf price adjustments. Concurrently, Argentina’s Law 27,642 on the Promotion of Healthy Eating supports reformulation toward lower-sugar products and clearer labelling, enabling stronger differentiation across modern retail and retail online platforms.
Unlock Market Intelligence
Explore the market potential with our data-driven report
Argentina Juice Market Segmentation Analysis
By Category
- 100% Juice
- Not from Concentrate
- Reconstituted
- Juice Drinks (up to 24% Juice)
- Nectars
- High Concentration (40% to 50% fruit content)
- Medium Concentration (30% to 39% fruit content)
- Low Concentration (25% to 29% fruit content)
- Vegetable Juice
- Fruit and Vegetable Blends
The segment with highest market share under category is Nectars, accounting for approximately 65% of the market. This leadership reflects their affordability and flavour appeal among budget-conscious households during periods of economic volatility. While premium 100% juice is growing among higher-income consumers, nectars remain the primary choice for the wider population by balancing juice content with accessible pricing.
However, the category mix is gradually shifting as health and wellness priorities gain traction. Manufacturers are reformulating nectars to reduce sugar levels and adapt to climate-related supply constraints, particularly citrus shortages. Over the forecast period, nectars are expected to retain leadership but face increasing competitive pressure from 100% juice as clean-label preferences strengthen.

By Sales Channel
- Off-Trade
- Hypermarkets/ Supermarkets
- Retail Outlets
- Convenience Stores
- Online Platforms
- On-Trade
Off-trade is the dominant sales channel, accounting for approximately 80% of the market. This reflects the entrenched habit of at-home juice consumption, supported by extensive networks of traditional grocers (almacenes) and independent retailers. While these outlets provide everyday convenience, they face growing competition from discounters and hypermarkets leveraging promotions and private labels to attract price-sensitive shoppers.
retail online is emerging as a critical growth engine within the off-trade landscape. Supermarket platforms and specialist digital beverage stores are expanding rapidly, while producers increasingly deploy direct-to-consumer models to ensure full portfolio visibility. The combination of digital convenience and expanding modern retail formats into smaller cities ensures off-trade channels will remain the primary driver of market growth through 2032.
List of Companies Covered in Argentina Juice Market
The companies listed below are highly influential in the Argentina juice market, with a significant market share and a strong impact on industry developments.
- Record CD SA
- Arcor SAIC
- Refres Now SA
- Coca-Cola Argentina SA
- El Carmen SA
- RPB SA
- Babasal SRL
- Estancia Los Naranjos SA
- Patagonia Beverage SRL
- Las Brisas SA
Competitive Landscape
Juice market in Argentina remains relatively consolidated, led by Coca-Cola Argentina, whose strength is anchored in the Cepita brand and its dominant position in nectars. Cepita benefits from nationwide distribution, strong brand recognition, and ongoing reformulation toward reduced- and no-sugar options aligned with health trends. RPB SA and El Carmen SA remain relevant mid-tier players, competing primarily on price and mainstream flavours. At the premium end, Patagonian Beverage SRL has expanded share through its Purafrutta brand, leveraging wider supermarket access, health-led positioning, and organic credentials. Growing private label activity and stronger modern retail and e-commerce distribution are intensifying competition, particularly in 100% juice and wellness-oriented segments.
Frequently Asked Questions
Related Report
1. Market Segmentation
1.1. Research Scope
1.2. Research Methodology
1.3. Definitions and Assumptions
2. Executive Summary
3. Argentina Juice Market Policies, Regulations, and Standards
4. Argentina Juice Market Dynamics
4.1. Growth Factors
4.2. Challenges
4.3. Trends
4.4. Opportunities
5. Argentina Juice Market Statistics, 2022-2032F
5.1. Market Size & Growth Outlook
5.1.1.By Revenues in USD Million
5.1.2.By Quantity Sold in Million Litres
5.2. Market Segmentation & Growth Outlook
5.2.1.By Category
5.2.1.1. 100% Juice- Market Insights and Forecast 2022-2032, USD Million
5.2.1.1.1. Not from Concentrate- Market Insights and Forecast 2022-2032, USD Million
5.2.1.1.2. Reconstituted- Market Insights and Forecast 2022-2032, USD Million
5.2.1.2. Juice Drinks (up to 24% Juice)- Market Insights and Forecast 2022-2032, USD Million
5.2.1.3. Nectars- Market Insights and Forecast 2022-2032, USD Million
5.2.1.3.1. High Concentration (40% to 50% fruit content)- Market Insights and Forecast 2022-2032, USD Million
5.2.1.3.2. Medium Concentration (30% to 39% fruit content)- Market Insights and Forecast 2022-2032, USD Million
5.2.1.3.3. Low Concentration (25% to 29% fruit content)- Market Insights and Forecast 2022-2032, USD Million
5.2.1.4. Vegetable Juice- Market Insights and Forecast 2022-2032, USD Million
5.2.1.5. Fruit and Vegetable Blends- Market Insights and Forecast 2022-2032, USD Million
5.2.2.By Nature
5.2.2.1. Conventional- Market Insights and Forecast 2022-2032, USD Million
5.2.2.2. Organic- Market Insights and Forecast 2022-2032, USD Million
5.2.3.By Packaging Material
5.2.3.1. Plastic- Market Insights and Forecast 2022-2032, USD Million
5.2.3.2. Glass- Market Insights and Forecast 2022-2032, USD Million
5.2.3.3. Metal- Market Insights and Forecast 2022-2032, USD Million
5.2.3.4. Others- Market Insights and Forecast 2022-2032, USD Million
5.2.4.By Packaging Type
5.2.4.1. PET Bottles- Market Insights and Forecast 2022-2032, USD Million
5.2.4.2. Aseptic Packages (Cartons)- Market Insights and Forecast 2022-2032, USD Million
5.2.4.3. Glass Bottles- Market Insights and Forecast 2022-2032, USD Million
5.2.4.4. Metal Cans- Market Insights and Forecast 2022-2032, USD Million
5.2.4.5. Disposable Cups & Pouches- Market Insights and Forecast 2022-2032, USD Million
5.2.5.By Sales Channel
5.2.5.1. Off-Trade- Market Insights and Forecast 2022-2032, USD Million
5.2.5.1.1. Hypermarkets/ Supermarkets - Market Insights and Forecast 2022-2032, USD Million
5.2.5.1.2. Retail Outlets - Market Insights and Forecast 2022-2032, USD Million
5.2.5.1.3. Convenience Stores- Market Insights and Forecast 2022-2032, USD Million
5.2.5.1.4. Online Platforms- Market Insights and Forecast 2022-2032, USD Million
5.2.5.2. On-Trade- Market Insights and Forecast 2022-2032, USD Million
5.2.6.By Competitors
5.2.6.1. Competition Characteristics
5.2.6.2. Market Share & Analysis
6. Argentina 100% Juice Market Statistics, 2022-2032
6.1. Market Size & Growth Outlook
6.1.1.By Revenues in USD Million
6.1.2.By Quantity Sold in Million Litres
6.2. Market Segmentation & Growth Outlook
6.2.1.By Nature- Market Insights and Forecast 2022-2032, USD Million
6.2.2.By Packaging Material- Market Insights and Forecast 2022-2032, USD Million
6.2.3.By Packaging Type- Market Insights and Forecast 2022-2032, USD Million
6.2.4.By Sales Channel- Market Insights and Forecast 2022-2032, USD Million
7. Argentina Juice Drinks (up to 24% Juice) Market Statistics, 2022-2032
7.1. Market Size & Growth Outlook
7.1.1.By Revenues in USD Million
7.1.2.By Quantity Sold in Million Litres
7.2. Market Segmentation & Growth Outlook
7.2.1.By Nature- Market Insights and Forecast 2022-2032, USD Million
7.2.2.By Packaging Material- Market Insights and Forecast 2022-2032, USD Million
7.2.3.By Packaging Type- Market Insights and Forecast 2022-2032, USD Million
7.2.4.By Sales Channel- Market Insights and Forecast 2022-2032, USD Million
8. Argentina Nectars Market Statistics, 2022-2032
8.1. Market Size & Growth Outlook
8.1.1.By Revenues in USD Million
8.1.2.By Quantity Sold in Million Litres
8.2. Market Segmentation & Growth Outlook
8.2.1.By Nature- Market Insights and Forecast 2022-2032, USD Million
8.2.2.By Packaging Material- Market Insights and Forecast 2022-2032, USD Million
8.2.3.By Packaging Type- Market Insights and Forecast 2022-2032, USD Million
8.2.4.By Sales Channel- Market Insights and Forecast 2022-2032, USD Million
9. Argentina Vegetable Juice Market Statistics, 2022-2032
9.1. Market Size & Growth Outlook
9.1.1.By Revenues in USD Million
9.1.2.By Quantity Sold in Million Litres
9.2. Market Segmentation & Growth Outlook
9.2.1.By Nature- Market Insights and Forecast 2022-2032, USD Million
9.2.2.By Packaging Material- Market Insights and Forecast 2022-2032, USD Million
9.2.3.By Packaging Type- Market Insights and Forecast 2022-2032, USD Million
9.2.4.By Sales Channel- Market Insights and Forecast 2022-2032, USD Million
10. Argentina Fruit and Vegetable Blends Market Statistics, 2022-2032
10.1. Market Size & Growth Outlook
10.1.1. By Revenues in USD Million
10.1.2. By Quantity Sold in Million Litres
10.2. Market Segmentation & Growth Outlook
10.2.1. By Nature- Market Insights and Forecast 2022-2032, USD Million
10.2.2. By Packaging Material- Market Insights and Forecast 2022-2032, USD Million
10.2.3. By Packaging Type- Market Insights and Forecast 2022-2032, USD Million
10.2.4. By Sales Channel- Market Insights and Forecast 2022-2032, USD Million
11. Competitive Outlook
11.1. Company Profiles
11.1.1. Coca-Cola Argentina SA
11.1.1.1. Business Description
11.1.1.2. Product Portfolio
11.1.1.3. Collaborations & Alliances
11.1.1.4. Recent Developments
11.1.1.5. Financial Details
11.1.1.6. Others
11.1.2. El Carmen SA
11.1.2.1. Business Description
11.1.2.2. Product Portfolio
11.1.2.3. Collaborations & Alliances
11.1.2.4. Recent Developments
11.1.2.5. Financial Details
11.1.2.6. Others
11.1.3. RPB SA
11.1.3.1. Business Description
11.1.3.2. Product Portfolio
11.1.3.3. Collaborations & Alliances
11.1.3.4. Recent Developments
11.1.3.5. Financial Details
11.1.3.6. Others
11.1.4. Babasal SRL
11.1.4.1. Business Description
11.1.4.2. Product Portfolio
11.1.4.3. Collaborations & Alliances
11.1.4.4. Recent Developments
11.1.4.5. Financial Details
11.1.4.6. Others
11.1.5. Estancia Los Naranjos SA
11.1.5.1. Business Description
11.1.5.2. Product Portfolio
11.1.5.3. Collaborations & Alliances
11.1.5.4. Recent Developments
11.1.5.5. Financial Details
11.1.5.6. Others
11.1.6. Record CD SA
11.1.6.1. Business Description
11.1.6.2. Product Portfolio
11.1.6.3. Collaborations & Alliances
11.1.6.4. Recent Developments
11.1.6.5. Financial Details
11.1.6.6. Others
11.1.7. Arcor SAIC
11.1.7.1. Business Description
11.1.7.2. Product Portfolio
11.1.7.3. Collaborations & Alliances
11.1.7.4. Recent Developments
11.1.7.5. Financial Details
11.1.7.6. Others
11.1.8. Refres Now SA
11.1.8.1. Business Description
11.1.8.2. Product Portfolio
11.1.8.3. Collaborations & Alliances
11.1.8.4. Recent Developments
11.1.8.5. Financial Details
11.1.8.6. Others
11.1.9. Patagonia Beverage SRL
11.1.9.1. Business Description
11.1.9.2. Product Portfolio
11.1.9.3. Collaborations & Alliances
11.1.9.4. Recent Developments
11.1.9.5. Financial Details
11.1.9.6. Others
11.1.10. Las Brisas SA
11.1.10.1.Business Description
11.1.10.2.Product Portfolio
11.1.10.3.Collaborations & Alliances
11.1.10.4.Recent Developments
11.1.10.5.Financial Details
11.1.10.6.Others
12. Disclaimer
| Segment | Sub-Segment |
|---|---|
| By Category |
|
| By Nature |
|
| By Packaging Material |
|
| By Packaging Type |
|
| By Sales Channel |
|
Research Methodology
This study followed a structured approach comprising four key phases to assess the size and scope of the electro-oxidation market. The process began with thorough secondary research to collect data on the target market, related markets, and broader industry context. These findings, along with preliminary assumptions and estimates, were then validated through extensive primary research involving industry experts from across the value chain. To calculate the overall market size, both top-down and bottom-up methodologies were employed. Finally, market segmentation and data triangulation techniques were applied to refine and validate segment-level estimations.
Secondary Research
The secondary research phase involved gathering data from a wide range of credible and published sources. This step helped in identifying industry trends, defining market segmentation, and understanding the market landscape and value chain.
Sources consulted during this phase included:
- Company annual reports, investor presentations, and press releases
- Industry white papers and certified publications
- Trade directories and market-recognized databases
- Articles from authoritative authors and reputable journals
- Gold and silver standard websites
Secondary research was critical in mapping out the industry's value chain and monetary flow, identifying key market segments, understanding regional variations, and tracking significant industry developments.
Other key sources:
- Financial disclosures
- Industry associations and trade bodies
- News outlets and business magazines
- Academic journals and research studies
- Paid industry databases
Primary Research
To validate secondary data and gain deeper market insights, primary research was conducted with key stakeholders across both the supply and demand sides of the market.
On the demand side, participants included decision-makers and influencers from end-user industries—such as CIOs, CTOs, and CSOs—who provided first-hand perspectives on market needs, product usage, and future expectations.
On the supply side, interviews were conducted with manufacturers, industry associations, and institutional participants to gather insights into current offerings, product pipelines, and market challenges.
Primary interviews provided critical inputs such as:
- Market size and revenue data
- Product and service breakdowns
- Market forecasts
- Regional and application-specific trends
Stakeholders consulted included:
- Leading OEM and solution providers
- Channel and distribution partners
- End users across various applications
- Independent consultants and industry specialists
Market Size Estimation and Data Triangulation
- Identifying Key Market Participants (Secondary Research)
- Goal: To identify the major players or companies in the target market. This typically involves using publicly available data sources such as industry reports, market research publications, and financial statements of companies.
- Tools: Reports from firms like Gartner, Forrester, Euromonitor, Statista, IBISWorld, and others. Public financial statements, news articles, and press releases from top market players.
- Extracting Earnings of Key Market Participants
- Goal: To estimate the earnings generated from the product or service being analyzed. This step helps in understanding the revenue potential of each market player in a specific geography.
- Methods: Earnings data can be gathered from:
- Publicly available financial reports (for listed companies).
- Interviews and primary data sources from professionals, such as Directors, VPs, SVPs, etc. This is especially useful for understanding more nuanced, internal data that isn't publicly disclosed.
- Annual reports and investor presentations of key players.
- Data Collation and Development of a Relevant Data Model
- Goal: To collate inputs from both primary and secondary sources into a structured, data-driven model for market estimation. This model will incorporate key market KPIs and any independent variables relevant to the market.
- Key KPIs: These could include:
- Market size, growth rate, and demand drivers.
- Industry-specific metrics like market share, average revenue per customer (ARPC), or average deal size.
- External variables, such as economic growth rates, inflation rates, or commodity prices, that could affect the market.
- Data Modeling: Based on this data, the market forecasts are developed for the next 5 years. A combination of trend analysis, scenario modeling, and statistical regression might be used to generate projections.
- Scenario Analysis
- Goal: To test different assumptions and validate how sensitive the market is to changes in key variables (e.g., market demand, regulatory changes, technological disruptions).
- Types of Scenarios:
- Base Case: Based on current assumptions and historical data.
- Best-Case Scenario: Assuming favorable market conditions, regulatory environments, and technological advancements.
- Worst-Case Scenario: Accounting for adverse factors, such as economic downturns, stricter regulations, or unexpected disruptions.


