Global Anti-Aging Products Market Report: Trends, Growth and Forecast (2026-2032)
By Product Type (Creams & Moisturizers, Serums, Sunscreens/SPF Day Creams, Exfoliators/Peels, Masks, Targeted Treatments/Spot Correctors), By Claim/Benefit Type (Wrinkle & Fine-Line Reduction, Firming/Lifting Appearance, Hydration/Plumping, Brightening/Age-Spot Correction, Barrier Repair/Sensitive Mature Skin, Sun Protection/Photoaging Prevention), By Sales Channel (Retail Offline (Supermarkets/Hypermarkets, Pharmacy/Drugstores, Specialty Beauty Stores, Department Stores, Brand Exclusive Stores, Clinics/Salons/Spas, Other Offline Retail), Retail Online (Brand-Owned Websites, E-commerce Marketplaces, Online Beauty Retailers, Online Pharmacy Platforms, Social Commerce Platforms, Quick Commerce/On-Demand Delivery Platforms, Other Online Retail)), By Ingredient Platform (Retinoids, Hyaluronic Acid, Niacinamide, Vitamin C, Peptides, AHAs/BHAs, Ceramides, Botanical/Natural Actives, Others), By Age Group (18–34 Years, 35–54 Years, 55 Years & Above), By End User (Women, Men, Unisex), By Price Tier (Mass, Premium), By Region (North America, South America, Europe, Middle East & Africa, Asia Pacific) ... Read more
|
Major Players
|
Global Anti-Aging Products Market Statistics and Insights, 2026
- Market Size Statistics
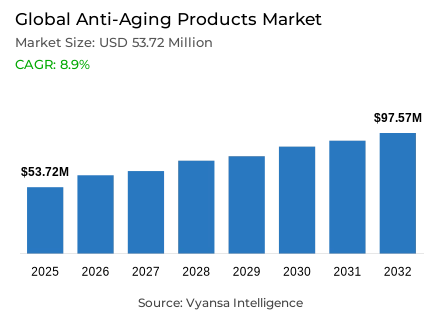
- Anti-aging products market size in Global was valued at USD 53.72 million in 2025 and is estimated at USD 58.5 million in 2026.
- The market size is expected to grow to USD 97.57 million by 2032.
- Market to register a CAGR of around 8.9% during 2026-32.
- Product Type Shares
- Creams & moisturizers grabbed market share of 25%.
- Competition
- More than 20 companies are actively engaged in producing anti-aging products.
- Top 5 companies acquired around 15% of the market share.
- Shiseido Company Limited , Avon Products Inc. , Oriflame Holding AG , L’Oreal S.A. , Unilever PLC etc., are few of the top companies.
- Claim/Benefit Type
- Wrinkle & fine-line reduction grabbed 30% of the market.
- Region
- Asia Pacific leads with a 36% share of the global market.
Global Anti-Aging Products Market Outlook
The global anti-aging products market was valued at USD 53.72 million in 2025, is projected to reach USD 58.5 million in 2026, and is expected to expand toward USD 97.57 million by 2032, underpinned by a steadily expanding older population whose demographic profile directly correlates with demand for visible skin improvements and anti-aging skincare solutions. Consumers across developed and emerging regions increasingly prioritize products that deliver firmness, hydration, texture refinement, and wrinkle reduction as integral components of daily skin-care routines. This structural demand remains commercially relevant not merely among aging populations but equally among middle-aged consumers who adopt preventive approaches earlier, creating consistent repeat purchasing behavior that sustains market expansion and underpins long-term industry momentum.
Evidence from authoritative sources underscores this trajectory. The United Nations documented in October 2025 that the global population aged over 60 has surpassed 1.2 billion more than double the figure recorded three decades prior. WHO corroborating data confirms that every geographic region is now experiencing concurrent growth in both absolute numbers and proportional representation of older persons. This universal demographic shift signals that population aging transcends traditional mature economies, functioning instead as a persistent global demand driver that reinforces sustained consumer investment in anti-aging creams, serums, and comprehensive preventive skin-care products across multiple market segments and consumer demographics worldwide.
Operating conditions reflect a market caught between rising consumer sophistication and intensifying operational complexity. Demand for targeted, science-backed formulations has displaced purely aesthetic messaging, compelling brands to articulate clearer functional positioning around wrinkles, firmness, texture maintenance, and visible skin health. Simultaneously, sustainability pressures have emerged as a formidable constraint, with anti-aging products facing heightened environmental scrutiny due to reliance on jars, tubes, pumps, cartons, and multi-layer packaging systems. This dual dynamic elevated consumer expectations coupled with regulatory and reputational pressures is reshaping product development and sourcing strategies, particularly within premium segments where packaging aesthetics remain commercially inseparable from brand positioning and market differentiation.
Digital transformation is simultaneously opening significant distribution and personalization opportunities within the industry. Online channels enable streamlined product comparison by ingredient profile, claim substantiation, and skin-concern specificity, supporting both initial discovery and repeat purchase acceleration. This capacity is especially consequential in age-care skincare, where consumer decision-making characteristically involves extended product evaluation and routine customization around visible outcomes. Consequently, e-commerce expansion and direct-to-consumer models are broadening access to both mass-market and premium anti-aging offerings while simultaneously creating pathways for algorithmic personalization, thereby extending brand reach across geographically dispersed consumer populations and enabling sustainable market growth.

Global Anti-Aging Products Market Growth Driver
Rising Older Population Supports Preventive Skin-Care Demand
Demographic expansion among older populations represents the primary structural driver of industry growth, as biological aging inevitably triggers visible skin changes that standardized skin-care routines alone cannot mitigate. Longer life expectancy across developed and emerging economies has simultaneously reinforced consumer interest in preventive skin health, extending product relevance beyond corrective applications to encompass proactive maintenance strategies. This shift has democratized anti-aging product consumption, moving it from niche premium positioning into mainstream daily skincare, thereby substantially broadening the addressable consumer base within the market and creating reliable, repeatable demand patterns independent of economic cycles or seasonal fluctuations.
Quantitative validation of this driver emerges from official demographic data. As stated by the United Nations in October 2025, the population cohort aged over 60 has exceeded 1.2 billion globally, representing a doubling over the preceding 30 years. WHO additional validation indicates that growth in both size and proportion of older persons is now universal across all geographic classifications, confirming that population aging functions as a genuinely global demand catalyst rather than a phenomenon limited to mature developed economies. These structural demographic trends ensure that market expansion will sustain itself through natural population dynamics independent of discretionary consumer spending, thereby providing a durable foundation for industry growth across forecast periods.
Global Anti-Aging Products Market Challenge
Plastic Packaging Pressure Raises Cost and Compliance Complexity
Environmental compliance has emerged as a critical operational constraint for anti-aging product manufacturers within the industry, driven by intensifying policy scrutiny and consumer demand for responsible material practices. The packaging infrastructure supporting anti-aging products jars, tubes, pumps, cartons, and multi-layered configurations faces mounting pressure to demonstrate recyclability, minimize plastic content, and communicate environmental claims with greater accuracy and transparency. For premium skincare brands where packaging aesthetics remain integral to brand identity and consumer perception, this market constraint creates a compounding challenge: redesigning packaging for environmental responsibility while preserving the visual and tactile premium positioning that justifies price premiums remains operationally and economically complex.
Data from environmental authorities highlights the urgency driving this constraint. As reported by United Nations Environment Programme (UNEP), the equivalent of 2,000 garbage trucks filled with plastic waste enters aquatic ecosystems daily, with annual leakage estimates reaching 19 to 23 million tonnes. These quantified environmental impacts are intensifying both regulatory pressure and consumer activism globally, compelling anti-aging product manufacturers to undertake comprehensive packaging redesigns, waste reduction initiatives, and material substitution strategies. Consequently, sustainability compliance functions simultaneously as a reputational requirement, an operating cost driver, and a product development bottleneck particularly acute in premium market segments where margin structures are traditionally narrower and where packaging investment represents a disproportionate percentage of total product cost.
Unlock Market Intelligence
Explore the market potential with our data-driven report
Global Anti-Aging Products Market Trend
Science-Backed Skin-Health Claims Gain Stronger Visibility
Product positioning across the anti-aging industry is undergoing systematic reorientation away from purely aesthetic messaging toward evidence-based, skin-health-led claims that address specific dermatological concerns with clinical precision. Consumers increasingly demand explicit functional language around wrinkles, firmness, barrier support, sensitivity mitigation, and texture improvement, displacing generalized "youthful appearance" positioning in favor of targeted, measurable benefit articulation within the market. This shift reflects deepened consumer sophistication regarding active ingredients, formulation science, and visible efficacy verification, compelling brands to emphasize dermatological credibility and clinical substantiation as foundational elements of product communication strategy and market differentiation.
Supporting this industry-wide positioning trend, WHO's 2025 resolution on skin diseases emphasized that the Global Burden of Disease Study identified 4.69 billion incident cases of skin and subcutaneous diseases globally, generating 41.9 million disability-adjusted life years and ranking skin conditions among the top 10 causes of worldwide disability. This public health framing legitimizes and reinforces the scientific repositioning of anti-aging products from cosmetic indulgence toward functional skin-maintenance solutions addressing documented medical and dermatological needs. Consequently, brands that successfully articulate their offerings within this clinical framework emphasizing barrier support, texture normalization, and visible health metrics are positioned to command consumer trust, justify premium pricing, and sustain competitive differentiation within an increasingly sophisticated market landscape.
Global Anti-Aging Products Market Opportunity
Digital Access Expands Reach for Personalized Age-Care Products
Digital connectivity and e-commerce infrastructure create substantial untapped opportunity for anti-aging product manufacturers within the industry, particularly through ingredient-based comparison tools, personalized recommendation engines, and consumer education platforms that simplify product discovery and routine customization. Online channels enable consumers to evaluate active ingredients, price positioning, and claimed benefits prior to purchase, supporting both initial market entry and accelerated repeat buying cycles. This capacity is singularly consequential within age-care skincare, where consumer decision-making inherently involves extended evaluation periods and routine personalization around specific visible concerns, thereby rendering digital intelligence and personalization infrastructure strategically valuable for market participation and sustainable growth.
Validated market data confirms the practical expansion of digital opportunity. According to the World Bank, 74% of the global population accessed the internet in 2025, with penetration reaching 94% in high-income economies, 92% in Europe and Central Asia, and 84% in Latin America and the Caribbean. This ubiquitous digital access is rendering online discovery and replenishment increasingly practical across major consumer regions, enabling anti-aging brands to expand reach beyond traditional retail infrastructure, support algorithmic personalization, and improve routine product access for geographically dispersed consumer bases. Consequently, brands investing in digital infrastructure, AI-driven skincare customization, and direct-to-consumer platforms are positioned to capture disproportionate share of emerging market opportunity and sustain competitive advantage through enhanced consumer engagement and retention.
Global Anti-Aging Products Market Regional Analysis

By Region
- North America
- South America
- Europe
- Middle East & Africa
- Asia Pacific
Asia Pacific commands the dominant regional market position within the global anti-aging products industry, commanding 36% share through its combination of exceptionally large urban populations, deeply embedded skincare usage patterns, and rapidly expanding digital infrastructure. The region's commercial advantage reflects structural characteristics that directly amplify anti-aging products market demand: enormous city-based consumer concentrations, established beauty routines centered on skincare maintenance, pollution-driven skin damage concerns, and increasingly accessible e-commerce platforms enabling convenient product discovery and replenishment. This convergence of demographic scale, cultural product acceptance, and digital accessibility creates a market environment uniquely favorable to anti-aging product positioning across price points and benefit categories throughout the region.
Official demographic and connectivity data substantiates Asia-Pacific's regional leadership. UN DESA data confirms that 19 of the world's 33 megacities are located in Asia in 2025, with Jakarta, Dhaka, and Tokyo respectively housing nearly 42 million, 40 million, and 33 million residents. World Bank internet penetration data indicates that digital access reaches 88% in East Asia and the Pacific and 68% in South Asia as of 2025. This combination of unprecedented urban concentration and rising digital connectivity renders Asia-Pacific the most commercially attractive regional market for anti-aging products, as massive city-based consumer populations can access, compare, and repurchase products through expanding online channels, thereby sustaining consistent demand across mass-market and premium segments throughout the industry.
Unlock Market Intelligence
Explore the market potential with our data-driven report
Global Anti-Aging Products Market Segmentation Analysis
By Product Type
- Creams & Moisturizers
- Serums
- Sunscreens/SPF Day Creams
- Exfoliators/Peels
- Masks
- Targeted Treatments/Spot Correctors
Creams and moisturizers constitute the highest-performing product category within the global anti-aging products market, commanding 25% share due to their alignment with daily skincare routines, broad consumer familiarity, and multifunctional benefit delivery. This segment leadership within the market reflects the category's inherent convenience advantages: simple application protocols, compatibility with both diurnal and nocturnal use, and demonstrated capacity to deliver visible moisture support, texture smoothness, and comfort perception simultaneously. Consumer preference for leave-on anti-aging creams and serums that consolidate hydration and wrinkle-care positioning into singular products reinforces the category's structural dominance, as does the demonstrated consumer willingness to integrate creams and moisturizers into preventive skincare regimens independent of age or prior product experience.
Demographic and urbanization data substantiate this segment's commercial prominence. As documented by United Nations Department of Economic and Social Affairs (UN DESA), cities shelter 45% of the global population of 8.2 billion in 2025, with 33 megacities now constituting primary consumption centers. Large urban populations characteristically exhibit faster, routine-driven skincare adoption patterns that favor convenient, repeatedly-applied formats, thereby positioning anti-aging creams and moisturizers as ideally suited to daily-use dynamics and routine integration across diverse consumer demographics. The category's compatibility with day-and-night application, minimal user friction, and broad consumer recognition across multiple geographic regions and age cohorts collectively sustain its market leadership position within the industry, ensuring that creams and moisturizers will remain foundational to anti-aging product portfolios and consumer skincare routines.

By Claim/Benefit Type
- Wrinkle & Fine-Line Reduction
- Firming/Lifting Appearance
- Hydration/Plumping
- Brightening/Age-Spot Correction
- Barrier Repair/Sensitive Mature Skin
- Sun Protection/Photoaging Prevention
Wrinkle and fine-line reduction claims capture the highest-performing benefit positioning within the global anti-aging products market, commanding 30% share due to their status as the most visually recognizable and consumer-understood manifestation of skin aging. Visible facial lines remain the dominant consideration influencing anti-aging product selection, as they represent tangible, observable skin changes that consumers can monitor and measure over time, thereby validating perceived product efficacy and justifying continued market investment. The commercial strength of this benefit positioning reflects its inherent consumer appeal: wrinkle reduction and fine-line treatments are immediately comprehensible, visually verifiable, and intrinsically linked to consumer perceptions of youthfulness, making them the most strategically effective claim architecture across both preventive and corrective skincare applications within the competitive market.
Ultraviolet exposure science reinforces the clinical and commercial relevance of wrinkle reduction positioning within the industry. As documented by the World Health Organization, UV-A radiation penetrates dermal layers deeply, affecting connective tissue and vascular structures through mechanisms that progressively diminish skin elasticity and accelerate visible aging manifestations. WHO supplementary data indicates that excessive UV exposure generates approximately 1.2 million new non-melanoma skin cancer diagnoses and 325,000 melanomas annually, alongside associated mortality figures of 64,000 and 57,000 respectively. These quantified health impacts strengthen consumer linkage between visible aging signs and cumulative sun damage, thereby amplifying the commercial relevance of wrinkle reduction products and substantiating their positioning as functionally protective solutions addressing documented dermatological consequences within the market.
Market Players in Global Anti-Aging Products Market
These market players maintain a significant presence in the Global anti-aging products market sector and contribute to its ongoing evolution.
- Shiseido Company Limited
- Avon Products Inc.
- Oriflame Holding AG
- L’Oreal S.A.
- Unilever PLC
- Beiersdorf AG
- The Procter & Gamble Company
- The Estee Lauder Companies Inc.
- Revlon Inc.
- Age Sciences Inc.
- Johnson & Johnson
- Coty Inc.
- Amorepacific Corporation
- Natura & Co Holding S.A.
- Kao Corporation
Market News & Updates
- L’Oréal S.A., 2026:
In January 2026, L’Oréal unveiled its new LED Face Mask at CES 2026. The company said the device targets visible aging signs. These include fine lines, sagging, and uneven skin tone. L’Oréal also said it uses red and near-infrared light technology. The launch matters because anti-aging is expanding beyond creams and serums. It supports stronger convergence between skincare, devices, and beauty technology globally. This can widen premium anti-aging demand and intensify innovation-led competition.
- The Estée Lauder Companies Inc., 2026:
In April 2026, Estée Lauder announced two peer-reviewed skin longevity publications. The company said they marked a milestone in skin longevity science. In February 2026, it also presented new findings at IMCAS. These findings covered sirtuin and exosome research in skincare science. This matters because skin longevity is becoming central to anti-aging positioning. It strengthens science-backed product claims and premium category differentiation globally. It may also push rivals toward deeper clinical validation and advanced actives.
Frequently Asked Questions
Related Report
- Market Segmentation
- Research Scope
- Research Methodology
- Definitions and Assumptions
- Executive Summary
- Global Anti-Aging Products Market Policies, Regulations, and Standards
- Global Anti-Aging Products Market Dynamics
- Growth Factors
- Challenges
- Trends
- Opportunities
- Global Anti-Aging Products Market Statistics, 2022-2032F
- Market Size & Growth Outlook
- By Revenues in USD Million
- Market Segmentation & Growth Outlook
- By Product Type
- Creams & Moisturizers- Market Insights and Forecast 2022-2032, USD Million
- Serums- Market Insights and Forecast 2022-2032, USD Million
- Sunscreens/SPF Day Creams- Market Insights and Forecast 2022-2032, USD Million
- Exfoliators/Peels- Market Insights and Forecast 2022-2032, USD Million
- Masks- Market Insights and Forecast 2022-2032, USD Million
- Targeted Treatments/Spot Correctors- Market Insights and Forecast 2022-2032, USD Million
- By Claim/Benefit Type
- Wrinkle & Fine-Line Reduction- Market Insights and Forecast 2022-2032, USD Million
- Firming/Lifting Appearance- Market Insights and Forecast 2022-2032, USD Million
- Hydration/Plumping- Market Insights and Forecast 2022-2032, USD Million
- Brightening/Age-Spot Correction- Market Insights and Forecast 2022-2032, USD Million
- Barrier Repair/Sensitive Mature Skin- Market Insights and Forecast 2022-2032, USD Million
- Sun Protection/Photoaging Prevention- Market Insights and Forecast 2022-2032, USD Million
- By Sales Channel
- Retail Offline- Market Insights and Forecast 2022-2032, USD Million
- Supermarkets/Hypermarkets- Market Insights and Forecast 2022-2032, USD Million
- Pharmacy/Drugstores- Market Insights and Forecast 2022-2032, USD Million
- Specialty Beauty Stores- Market Insights and Forecast 2022-2032, USD Million
- Department Stores- Market Insights and Forecast 2022-2032, USD Million
- Brand Exclusive Stores- Market Insights and Forecast 2022-2032, USD Million
- Clinics/Salons/Spas- Market Insights and Forecast 2022-2032, USD Million
- Other Offline Retail- Market Insights and Forecast 2022-2032, USD Million
- Retail Online- Market Insights and Forecast 2022-2032, USD Million
- Brand-Owned Websites- Market Insights and Forecast 2022-2032, USD Million
- E-commerce Marketplaces- Market Insights and Forecast 2022-2032, USD Million
- Online Beauty Retailers- Market Insights and Forecast 2022-2032, USD Million
- Online Pharmacy Platforms- Market Insights and Forecast 2022-2032, USD Million
- Social Commerce Platforms- Market Insights and Forecast 2022-2032, USD Million
- Quick Commerce/On-Demand Delivery Platforms- Market Insights and Forecast 2022-2032, USD Million
- Other Online Retail- Market Insights and Forecast 2022-2032, USD Million
- Retail Offline- Market Insights and Forecast 2022-2032, USD Million
- By Ingredient Platform
- Retinoids- Market Insights and Forecast 2022-2032, USD Million
- Hyaluronic Acid- Market Insights and Forecast 2022-2032, USD Million
- Niacinamide- Market Insights and Forecast 2022-2032, USD Million
- Vitamin C- Market Insights and Forecast 2022-2032, USD Million
- Peptides- Market Insights and Forecast 2022-2032, USD Million
- AHAs/BHAs- Market Insights and Forecast 2022-2032, USD Million
- Ceramides- Market Insights and Forecast 2022-2032, USD Million
- Botanical/Natural Actives- Market Insights and Forecast 2022-2032, USD Million
- Others- Market Insights and Forecast 2022-2032, USD Million
- By Age Group
- 18–34 Years- Market Insights and Forecast 2022-2032, USD Million
- 35–54 Years- Market Insights and Forecast 2022-2032, USD Million
- 55 Years & Above- Market Insights and Forecast 2022-2032, USD Million
- By End User
- Women- Market Insights and Forecast 2022-2032, USD Million
- Men- Market Insights and Forecast 2022-2032, USD Million
- Unisex- Market Insights and Forecast 2022-2032, USD Million
- By Price Tier
- Mass- Market Insights and Forecast 2022-2032, USD Million
- Premium- Market Insights and Forecast 2022-2032, USD Million
- By Region
- North America
- South America
- Europe
- Middle East & Africa
- Asia Pacific
- By Competitors
- Competition Characteristics
- Market Share & Analysis
- By Product Type
- Market Size & Growth Outlook
- North America Anti-Aging Products Market Statistics, 2022-2032F
- Market Size & Growth Outlook
- By Revenues in USD Million
- Market Segmentation & Growth Outlook
- By Product Type- Market Insights and Forecast 2022-2032, USD Million
- By Claim/Benefit Type- Market Insights and Forecast 2022-2032, USD Million
- By Sales Channel- Market Insights and Forecast 2022-2032, USD Million
- By Ingredient Platform- Market Insights and Forecast 2022-2032, USD Million
- By Age Group- Market Insights and Forecast 2022-2032, USD Million
- By End User- Market Insights and Forecast 2022-2032, USD Million
- By Price Tier- Market Insights and Forecast 2022-2032, USD Million
- By Country
- US
- Canada
- Rest of North America
- US Anti-Aging Products Market Statistics, 2022-2032F
- Market Size & Growth Outlook
- By Revenues in USD Million
- Market Segmentation & Growth Outlook
- By Product Type- Market Insights and Forecast 2022-2032, USD Million
- By Claim/Benefit Type- Market Insights and Forecast 2022-2032, USD Million
- By Sales Channel- Market Insights and Forecast 2022-2032, USD Million
- By Ingredient Platform- Market Insights and Forecast 2022-2032, USD Million
- By Age Group- Market Insights and Forecast 2022-2032, USD Million
- By End User- Market Insights and Forecast 2022-2032, USD Million
- By Price Tier- Market Insights and Forecast 2022-2032, USD Million
- Market Size & Growth Outlook
- Canada Anti-Aging Products Market Statistics, 2022-2032F
- Market Size & Growth Outlook
- By Revenues in USD Million
- Market Segmentation & Growth Outlook
- By Product Type- Market Insights and Forecast 2022-2032, USD Million
- By Claim/Benefit Type- Market Insights and Forecast 2022-2032, USD Million
- By Sales Channel- Market Insights and Forecast 2022-2032, USD Million
- By Ingredient Platform- Market Insights and Forecast 2022-2032, USD Million
- By Age Group- Market Insights and Forecast 2022-2032, USD Million
- By End User- Market Insights and Forecast 2022-2032, USD Million
- By Price Tier- Market Insights and Forecast 2022-2032, USD Million
- Market Size & Growth Outlook
- Market Size & Growth Outlook
- South America Anti-Aging Products Market Statistics, 2022-2032F
- Market Size & Growth Outlook
- By Revenues in USD Million
- Market Segmentation & Growth Outlook
- By Product Type- Market Insights and Forecast 2022-2032, USD Million
- By Claim/Benefit Type- Market Insights and Forecast 2022-2032, USD Million
- By Sales Channel- Market Insights and Forecast 2022-2032, USD Million
- By Ingredient Platform- Market Insights and Forecast 2022-2032, USD Million
- By Age Group- Market Insights and Forecast 2022-2032, USD Million
- By End User- Market Insights and Forecast 2022-2032, USD Million
- By Price Tier- Market Insights and Forecast 2022-2032, USD Million
- By Country
- Brazil
- Argentina
- Colombia
- Chile
- Rest of South America
- Brazil Anti-Aging Products Market Statistics, 2022-2032F
- Market Size & Growth Outlook
- By Revenues in USD Million
- Market Segmentation & Growth Outlook
- By Product Type- Market Insights and Forecast 2022-2032, USD Million
- By Claim/Benefit Type- Market Insights and Forecast 2022-2032, USD Million
- By Sales Channel- Market Insights and Forecast 2022-2032, USD Million
- By Ingredient Platform- Market Insights and Forecast 2022-2032, USD Million
- By Age Group- Market Insights and Forecast 2022-2032, USD Million
- By End User- Market Insights and Forecast 2022-2032, USD Million
- By Price Tier- Market Insights and Forecast 2022-2032, USD Million
- Market Size & Growth Outlook
- Argentina Anti-Aging Products Market Statistics, 2022-2032F
- Market Size & Growth Outlook
- By Revenues in USD Million
- Market Segmentation & Growth Outlook
- By Product Type- Market Insights and Forecast 2022-2032, USD Million
- By Claim/Benefit Type- Market Insights and Forecast 2022-2032, USD Million
- By Sales Channel- Market Insights and Forecast 2022-2032, USD Million
- By Ingredient Platform- Market Insights and Forecast 2022-2032, USD Million
- By Age Group- Market Insights and Forecast 2022-2032, USD Million
- By End User- Market Insights and Forecast 2022-2032, USD Million
- By Price Tier- Market Insights and Forecast 2022-2032, USD Million
- Market Size & Growth Outlook
- Colombia Anti-Aging Products Market Statistics, 2022-2032F
- Market Size & Growth Outlook
- By Revenues in USD Million
- Market Segmentation & Growth Outlook
- By Product Type- Market Insights and Forecast 2022-2032, USD Million
- By Claim/Benefit Type- Market Insights and Forecast 2022-2032, USD Million
- By Sales Channel- Market Insights and Forecast 2022-2032, USD Million
- By Ingredient Platform- Market Insights and Forecast 2022-2032, USD Million
- By Age Group- Market Insights and Forecast 2022-2032, USD Million
- By End User- Market Insights and Forecast 2022-2032, USD Million
- By Price Tier- Market Insights and Forecast 2022-2032, USD Million
- Market Size & Growth Outlook
- Chile Anti-Aging Products Market Statistics, 2022-2032F
- Market Size & Growth Outlook
- By Revenues in USD Million
- Market Segmentation & Growth Outlook
- By Product Type- Market Insights and Forecast 2022-2032, USD Million
- By Claim/Benefit Type- Market Insights and Forecast 2022-2032, USD Million
- By Sales Channel- Market Insights and Forecast 2022-2032, USD Million
- By Ingredient Platform- Market Insights and Forecast 2022-2032, USD Million
- By Age Group- Market Insights and Forecast 2022-2032, USD Million
- By End User- Market Insights and Forecast 2022-2032, USD Million
- By Price Tier- Market Insights and Forecast 2022-2032, USD Million
- Market Size & Growth Outlook
- Market Size & Growth Outlook
- Europe Anti-Aging Products Market Statistics, 2022-2032F
- Market Size & Growth Outlook
- By Revenues in USD Million
- Market Segmentation & Growth Outlook
- By Product Type- Market Insights and Forecast 2022-2032, USD Million
- By Claim/Benefit Type- Market Insights and Forecast 2022-2032, USD Million
- By Sales Channel- Market Insights and Forecast 2022-2032, USD Million
- By Ingredient Platform- Market Insights and Forecast 2022-2032, USD Million
- By Age Group- Market Insights and Forecast 2022-2032, USD Million
- By End User- Market Insights and Forecast 2022-2032, USD Million
- By Price Tier- Market Insights and Forecast 2022-2032, USD Million
- By Country
- Germany
- UK
- Netherlands
- Switzerland
- France
- Italy
- Spain
- Rest of Europe
- Germany Anti-Aging Products Market Statistics, 2022-2032F
- Market Size & Growth Outlook
- By Revenues in USD Million
- Market Segmentation & Growth Outlook
- By Product Type- Market Insights and Forecast 2022-2032, USD Million
- By Claim/Benefit Type- Market Insights and Forecast 2022-2032, USD Million
- By Sales Channel- Market Insights and Forecast 2022-2032, USD Million
- By Ingredient Platform- Market Insights and Forecast 2022-2032, USD Million
- By Age Group- Market Insights and Forecast 2022-2032, USD Million
- By End User- Market Insights and Forecast 2022-2032, USD Million
- By Price Tier- Market Insights and Forecast 2022-2032, USD Million
- Market Size & Growth Outlook
- UK Anti-Aging Products Market Statistics, 2022-2032F
- Market Size & Growth Outlook
- By Revenues in USD Million
- Market Segmentation & Growth Outlook
- By Product Type- Market Insights and Forecast 2022-2032, USD Million
- By Claim/Benefit Type- Market Insights and Forecast 2022-2032, USD Million
- By Sales Channel- Market Insights and Forecast 2022-2032, USD Million
- By Ingredient Platform- Market Insights and Forecast 2022-2032, USD Million
- By Age Group- Market Insights and Forecast 2022-2032, USD Million
- By End User- Market Insights and Forecast 2022-2032, USD Million
- By Price Tier- Market Insights and Forecast 2022-2032, USD Million
- Market Size & Growth Outlook
- Netherlands Anti-Aging Products Market Statistics, 2022-2032F
- Market Size & Growth Outlook
- By Revenues in USD Million
- Market Segmentation & Growth Outlook
- By Product Type- Market Insights and Forecast 2022-2032, USD Million
- By Claim/Benefit Type- Market Insights and Forecast 2022-2032, USD Million
- By Sales Channel- Market Insights and Forecast 2022-2032, USD Million
- By Ingredient Platform- Market Insights and Forecast 2022-2032, USD Million
- By Age Group- Market Insights and Forecast 2022-2032, USD Million
- By End User- Market Insights and Forecast 2022-2032, USD Million
- By Price Tier- Market Insights and Forecast 2022-2032, USD Million
- Market Size & Growth Outlook
- Switzerland Anti-Aging Products Market Statistics, 2022-2032F
- Market Size & Growth Outlook
- By Revenues in USD Million
- Market Segmentation & Growth Outlook
- By Product Type- Market Insights and Forecast 2022-2032, USD Million
- By Claim/Benefit Type- Market Insights and Forecast 2022-2032, USD Million
- By Sales Channel- Market Insights and Forecast 2022-2032, USD Million
- By Ingredient Platform- Market Insights and Forecast 2022-2032, USD Million
- By Age Group- Market Insights and Forecast 2022-2032, USD Million
- By End User- Market Insights and Forecast 2022-2032, USD Million
- By Price Tier- Market Insights and Forecast 2022-2032, USD Million
- Market Size & Growth Outlook
- France Anti-Aging Products Market Statistics, 2022-2032F
- Market Size & Growth Outlook
- By Revenues in USD Million
- Market Segmentation & Growth Outlook
- By Product Type- Market Insights and Forecast 2022-2032, USD Million
- By Claim/Benefit Type- Market Insights and Forecast 2022-2032, USD Million
- By Sales Channel- Market Insights and Forecast 2022-2032, USD Million
- By Ingredient Platform- Market Insights and Forecast 2022-2032, USD Million
- By Age Group- Market Insights and Forecast 2022-2032, USD Million
- By End User- Market Insights and Forecast 2022-2032, USD Million
- By Price Tier- Market Insights and Forecast 2022-2032, USD Million
- Market Size & Growth Outlook
- Italy Anti-Aging Products Market Statistics, 2022-2032F
- Market Size & Growth Outlook
- By Revenues in USD Million
- Market Segmentation & Growth Outlook
- By Product Type- Market Insights and Forecast 2022-2032, USD Million
- By Claim/Benefit Type- Market Insights and Forecast 2022-2032, USD Million
- By Sales Channel- Market Insights and Forecast 2022-2032, USD Million
- By Ingredient Platform- Market Insights and Forecast 2022-2032, USD Million
- By Age Group- Market Insights and Forecast 2022-2032, USD Million
- By End User- Market Insights and Forecast 2022-2032, USD Million
- By Price Tier- Market Insights and Forecast 2022-2032, USD Million
- Market Size & Growth Outlook
- Spain Anti-Aging Products Market Statistics, 2022-2032F
- Market Size & Growth Outlook
- By Revenues in USD Million
- Market Segmentation & Growth Outlook
- By Product Type- Market Insights and Forecast 2022-2032, USD Million
- By Claim/Benefit Type- Market Insights and Forecast 2022-2032, USD Million
- By Sales Channel- Market Insights and Forecast 2022-2032, USD Million
- By Ingredient Platform- Market Insights and Forecast 2022-2032, USD Million
- By Age Group- Market Insights and Forecast 2022-2032, USD Million
- By End User- Market Insights and Forecast 2022-2032, USD Million
- By Price Tier- Market Insights and Forecast 2022-2032, USD Million
- Market Size & Growth Outlook
- Market Size & Growth Outlook
- Middle East & Africa Anti-Aging Products Market Statistics, 2022-2032F
- Market Size & Growth Outlook
- By Revenues in USD Million
- Market Segmentation & Growth Outlook
- By Product Type- Market Insights and Forecast 2022-2032, USD Million
- By Claim/Benefit Type- Market Insights and Forecast 2022-2032, USD Million
- By Sales Channel- Market Insights and Forecast 2022-2032, USD Million
- By Ingredient Platform- Market Insights and Forecast 2022-2032, USD Million
- By Age Group- Market Insights and Forecast 2022-2032, USD Million
- By End User- Market Insights and Forecast 2022-2032, USD Million
- By Price Tier- Market Insights and Forecast 2022-2032, USD Million
- By Country
- Saudi Arabia
- UAE
- South Africa
- Israel
- Turkey
- Rest of Middle East & Africa
- Saudi Arabia Anti-Aging Products Market Statistics, 2022-2032F
- Market Size & Growth Outlook
- By Revenues in USD Million
- Market Segmentation & Growth Outlook
- By Product Type- Market Insights and Forecast 2022-2032, USD Million
- By Claim/Benefit Type- Market Insights and Forecast 2022-2032, USD Million
- By Sales Channel- Market Insights and Forecast 2022-2032, USD Million
- By Ingredient Platform- Market Insights and Forecast 2022-2032, USD Million
- By Age Group- Market Insights and Forecast 2022-2032, USD Million
- By End User- Market Insights and Forecast 2022-2032, USD Million
- By Price Tier- Market Insights and Forecast 2022-2032, USD Million
- Market Size & Growth Outlook
- UAE Anti-Aging Products Market Statistics, 2022-2032F
- Market Size & Growth Outlook
- By Revenues in USD Million
- Market Segmentation & Growth Outlook
- By Product Type- Market Insights and Forecast 2022-2032, USD Million
- By Claim/Benefit Type- Market Insights and Forecast 2022-2032, USD Million
- By Sales Channel- Market Insights and Forecast 2022-2032, USD Million
- By Ingredient Platform- Market Insights and Forecast 2022-2032, USD Million
- By Age Group- Market Insights and Forecast 2022-2032, USD Million
- By End User- Market Insights and Forecast 2022-2032, USD Million
- By Price Tier- Market Insights and Forecast 2022-2032, USD Million
- Market Size & Growth Outlook
- South Africa Anti-Aging Products Market Statistics, 2022-2032F
- Market Size & Growth Outlook
- By Revenues in USD Million
- Market Segmentation & Growth Outlook
- By Product Type- Market Insights and Forecast 2022-2032, USD Million
- By Claim/Benefit Type- Market Insights and Forecast 2022-2032, USD Million
- By Sales Channel- Market Insights and Forecast 2022-2032, USD Million
- By Ingredient Platform- Market Insights and Forecast 2022-2032, USD Million
- By Age Group- Market Insights and Forecast 2022-2032, USD Million
- By End User- Market Insights and Forecast 2022-2032, USD Million
- By Price Tier- Market Insights and Forecast 2022-2032, USD Million
- Market Size & Growth Outlook
- Israel Anti-Aging Products Market Statistics, 2022-2032F
- Market Size & Growth Outlook
- By Revenues in USD Million
- Market Segmentation & Growth Outlook
- By Product Type- Market Insights and Forecast 2022-2032, USD Million
- By Claim/Benefit Type- Market Insights and Forecast 2022-2032, USD Million
- By Sales Channel- Market Insights and Forecast 2022-2032, USD Million
- By Ingredient Platform- Market Insights and Forecast 2022-2032, USD Million
- By Age Group- Market Insights and Forecast 2022-2032, USD Million
- By End User- Market Insights and Forecast 2022-2032, USD Million
- By Price Tier- Market Insights and Forecast 2022-2032, USD Million
- Market Size & Growth Outlook
- Turkey Anti-Aging Products Market Statistics, 2022-2032F
- Market Size & Growth Outlook
- By Revenues in USD Million
- Market Segmentation & Growth Outlook
- By Product Type- Market Insights and Forecast 2022-2032, USD Million
- By Claim/Benefit Type- Market Insights and Forecast 2022-2032, USD Million
- By Sales Channel- Market Insights and Forecast 2022-2032, USD Million
- By Ingredient Platform- Market Insights and Forecast 2022-2032, USD Million
- By Age Group- Market Insights and Forecast 2022-2032, USD Million
- By End User- Market Insights and Forecast 2022-2032, USD Million
- By Price Tier- Market Insights and Forecast 2022-2032, USD Million
- Market Size & Growth Outlook
- Market Size & Growth Outlook
- Asia Pacific Anti-Aging Products Market Statistics, 2022-2032F
- Market Size & Growth Outlook
- By Revenues in USD Million
- Market Segmentation & Growth Outlook
- By Product Type- Market Insights and Forecast 2022-2032, USD Million
- By Claim/Benefit Type- Market Insights and Forecast 2022-2032, USD Million
- By Sales Channel- Market Insights and Forecast 2022-2032, USD Million
- By Ingredient Platform- Market Insights and Forecast 2022-2032, USD Million
- By Age Group- Market Insights and Forecast 2022-2032, USD Million
- By End User- Market Insights and Forecast 2022-2032, USD Million
- By Price Tier- Market Insights and Forecast 2022-2032, USD Million
- By Country
- China
- India
- Japan
- South Korea
- Indonesia
- Singapore
- Rest of Asia Pacific
- China Anti-Aging Products Market Statistics, 2022-2032F
- Market Size & Growth Outlook
- By Revenues in USD Million
- Market Segmentation & Growth Outlook
- By Product Type- Market Insights and Forecast 2022-2032, USD Million
- By Claim/Benefit Type- Market Insights and Forecast 2022-2032, USD Million
- By Sales Channel- Market Insights and Forecast 2022-2032, USD Million
- By Ingredient Platform- Market Insights and Forecast 2022-2032, USD Million
- By Age Group- Market Insights and Forecast 2022-2032, USD Million
- By End User- Market Insights and Forecast 2022-2032, USD Million
- By Price Tier- Market Insights and Forecast 2022-2032, USD Million
- Market Size & Growth Outlook
- India Anti-Aging Products Market Statistics, 2022-2032F
- Market Size & Growth Outlook
- By Revenues in USD Million
- Market Segmentation & Growth Outlook
- By Product Type- Market Insights and Forecast 2022-2032, USD Million
- By Claim/Benefit Type- Market Insights and Forecast 2022-2032, USD Million
- By Sales Channel- Market Insights and Forecast 2022-2032, USD Million
- By Ingredient Platform- Market Insights and Forecast 2022-2032, USD Million
- By Age Group- Market Insights and Forecast 2022-2032, USD Million
- By End User- Market Insights and Forecast 2022-2032, USD Million
- By Price Tier- Market Insights and Forecast 2022-2032, USD Million
- Market Size & Growth Outlook
- Japan Anti-Aging Products Market Statistics, 2022-2032F
- Market Size & Growth Outlook
- By Revenues in USD Million
- Market Segmentation & Growth Outlook
- By Product Type- Market Insights and Forecast 2022-2032, USD Million
- By Claim/Benefit Type- Market Insights and Forecast 2022-2032, USD Million
- By Sales Channel- Market Insights and Forecast 2022-2032, USD Million
- By Ingredient Platform- Market Insights and Forecast 2022-2032, USD Million
- By Age Group- Market Insights and Forecast 2022-2032, USD Million
- By End User- Market Insights and Forecast 2022-2032, USD Million
- By Price Tier- Market Insights and Forecast 2022-2032, USD Million
- Market Size & Growth Outlook
- South Korea Anti-Aging Products Market Statistics, 2022-2032F
- Market Size & Growth Outlook
- By Revenues in USD Million
- Market Segmentation & Growth Outlook
- By Product Type- Market Insights and Forecast 2022-2032, USD Million
- By Claim/Benefit Type- Market Insights and Forecast 2022-2032, USD Million
- By Sales Channel- Market Insights and Forecast 2022-2032, USD Million
- By Ingredient Platform- Market Insights and Forecast 2022-2032, USD Million
- By Age Group- Market Insights and Forecast 2022-2032, USD Million
- By End User- Market Insights and Forecast 2022-2032, USD Million
- By Price Tier- Market Insights and Forecast 2022-2032, USD Million
- Market Size & Growth Outlook
- Indonesia Anti-Aging Products Market Statistics, 2022-2032F
- Market Size & Growth Outlook
- By Revenues in USD Million
- Market Segmentation & Growth Outlook
- By Product Type- Market Insights and Forecast 2022-2032, USD Million
- By Claim/Benefit Type- Market Insights and Forecast 2022-2032, USD Million
- By Sales Channel- Market Insights and Forecast 2022-2032, USD Million
- By Ingredient Platform- Market Insights and Forecast 2022-2032, USD Million
- By Age Group- Market Insights and Forecast 2022-2032, USD Million
- By End User- Market Insights and Forecast 2022-2032, USD Million
- By Price Tier- Market Insights and Forecast 2022-2032, USD Million
- Market Size & Growth Outlook
- Singapore Anti-Aging Products Market Statistics, 2022-2032F
- Market Size & Growth Outlook
- By Revenues in USD Million
- Market Segmentation & Growth Outlook
- By Product Type- Market Insights and Forecast 2022-2032, USD Million
- By Claim/Benefit Type- Market Insights and Forecast 2022-2032, USD Million
- By Sales Channel- Market Insights and Forecast 2022-2032, USD Million
- By Ingredient Platform- Market Insights and Forecast 2022-2032, USD Million
- By Age Group- Market Insights and Forecast 2022-2032, USD Million
- By End User- Market Insights and Forecast 2022-2032, USD Million
- By Price Tier- Market Insights and Forecast 2022-2032, USD Million
- Market Size & Growth Outlook
- Market Size & Growth Outlook
- Competitive Outlook
- Company Profiles
- L’Oréal S.A.
- Business Description
- Product Portfolio
- Collaborations & Alliances
- Recent Developments
- Financial Details
- Others
- Unilever PLC
- Business Description
- Product Portfolio
- Collaborations & Alliances
- Recent Developments
- Financial Details
- Others
- Beiersdorf AG
- Business Description
- Product Portfolio
- Collaborations & Alliances
- Recent Developments
- Financial Details
- Others
- The Procter & Gamble Company
- Business Description
- Product Portfolio
- Collaborations & Alliances
- Recent Developments
- Financial Details
- Others
- The Estée Lauder Companies Inc.
- Business Description
- Product Portfolio
- Collaborations & Alliances
- Recent Developments
- Financial Details
- Others
- Shiseido Company, Limited
- Business Description
- Product Portfolio
- Collaborations & Alliances
- Recent Developments
- Financial Details
- Others
- Avon Products Inc.
- Business Description
- Product Portfolio
- Collaborations & Alliances
- Recent Developments
- Financial Details
- Others
- Oriflame Holding AG
- Business Description
- Product Portfolio
- Collaborations & Alliances
- Recent Developments
- Financial Details
- Others
- Revlon, Inc.
- Business Description
- Product Portfolio
- Collaborations & Alliances
- Recent Developments
- Financial Details
- Others
- Age Sciences Inc.
- Business Description
- Product Portfolio
- Collaborations & Alliances
- Recent Developments
- Financial Details
- Others
- Johnson & Johnson
- Business Description
- Product Portfolio
- Collaborations & Alliances
- Recent Developments
- Financial Details
- Others
- Coty Inc.
- Business Description
- Product Portfolio
- Collaborations & Alliances
- Recent Developments
- Financial Details
- Others
- Amorepacific Corporation
- Business Description
- Product Portfolio
- Collaborations & Alliances
- Recent Developments
- Financial Details
- Others
- Natura & Co Holding S.A.
- Business Description
- Product Portfolio
- Collaborations & Alliances
- Recent Developments
- Financial Details
- Others
- Kao Corporation
- Business Description
- Product Portfolio
- Collaborations & Alliances
- Recent Developments
- Financial Details
- Others
- L’Oréal S.A.
- Company Profiles
- Disclaimer
| Segment | Sub-Segment |
|---|---|
| By Product Type |
|
| By Claim/Benefit Type |
|
| By Sales Channel |
|
| By Ingredient Platform |
|
| By Age Group |
|
| By End User |
|
| By Price Tier |
|
| By Region |
|
Research Methodology
This study followed a structured approach comprising four key phases to assess the size and scope of the electro-oxidation market. The process began with thorough secondary research to collect data on the target market, related markets, and broader industry context. These findings, along with preliminary assumptions and estimates, were then validated through extensive primary research involving industry experts from across the value chain. To calculate the overall market size, both top-down and bottom-up methodologies were employed. Finally, market segmentation and data triangulation techniques were applied to refine and validate segment-level estimations.
Secondary Research
The secondary research phase involved gathering data from a wide range of credible and published sources. This step helped in identifying industry trends, defining market segmentation, and understanding the market landscape and value chain.
Sources consulted during this phase included:
- Company annual reports, investor presentations, and press releases
- Industry white papers and certified publications
- Trade directories and market-recognized databases
- Articles from authoritative authors and reputable journals
- Gold and silver standard websites
Secondary research was critical in mapping out the industry's value chain and monetary flow, identifying key market segments, understanding regional variations, and tracking significant industry developments.
Other key sources:
- Financial disclosures
- Industry associations and trade bodies
- News outlets and business magazines
- Academic journals and research studies
- Paid industry databases
Primary Research
To validate secondary data and gain deeper market insights, primary research was conducted with key stakeholders across both the supply and demand sides of the market.
On the demand side, participants included decision-makers and influencers from end-user industries—such as CIOs, CTOs, and CSOs—who provided first-hand perspectives on market needs, product usage, and future expectations.
On the supply side, interviews were conducted with manufacturers, industry associations, and institutional participants to gather insights into current offerings, product pipelines, and market challenges.
Primary interviews provided critical inputs such as:
- Market size and revenue data
- Product and service breakdowns
- Market forecasts
- Regional and application-specific trends
Stakeholders consulted included:
- Leading OEM and solution providers
- Channel and distribution partners
- End users across various applications
- Independent consultants and industry specialists
Market Size Estimation and Data Triangulation
- Identifying Key Market Participants (Secondary Research)
- Goal: To identify the major players or companies in the target market. This typically involves using publicly available data sources such as industry reports, market research publications, and financial statements of companies.
- Tools: Reports from firms like Gartner, Forrester, Euromonitor, Statista, IBISWorld, and others. Public financial statements, news articles, and press releases from top market players.
- Extracting Earnings of Key Market Participants
- Goal: To estimate the earnings generated from the product or service being analyzed. This step helps in understanding the revenue potential of each market player in a specific geography.
- Methods: Earnings data can be gathered from:
- Publicly available financial reports (for listed companies).
- Interviews and primary data sources from professionals, such as Directors, VPs, SVPs, etc. This is especially useful for understanding more nuanced, internal data that isn't publicly disclosed.
- Annual reports and investor presentations of key players.
- Data Collation and Development of a Relevant Data Model
- Goal: To collate inputs from both primary and secondary sources into a structured, data-driven model for market estimation. This model will incorporate key market KPIs and any independent variables relevant to the market.
- Key KPIs: These could include:
- Market size, growth rate, and demand drivers.
- Industry-specific metrics like market share, average revenue per customer (ARPC), or average deal size.
- External variables, such as economic growth rates, inflation rates, or commodity prices, that could affect the market.
- Data Modeling: Based on this data, the market forecasts are developed for the next 5 years. A combination of trend analysis, scenario modeling, and statistical regression might be used to generate projections.
- Scenario Analysis
- Goal: To test different assumptions and validate how sensitive the market is to changes in key variables (e.g., market demand, regulatory changes, technological disruptions).
- Types of Scenarios:
- Base Case: Based on current assumptions and historical data.
- Best-Case Scenario: Assuming favorable market conditions, regulatory environments, and technological advancements.
- Worst-Case Scenario: Accounting for adverse factors, such as economic downturns, stricter regulations, or unexpected disruptions.


