US Water & Wastewater Pump Market Report: Trends, Growth and Forecast (2026-2032)
By Pump Type (Centrifugal Pumps (End Suction, Split Case, Vertical (Turbine, Axial Pump, Mixed Flow Pump), Submersible Pump), Positive Displacement Pumps (Progressing Cavity, Diaphragm, Gear Pump, Others)), By Application (Water, Wastewater), By End User (Industrial Water & Wastewater, Municipal Water & Wastewater) ... Read more

|
Major Players
|
US Water & Wastewater Pump Market Statistics and Insights, 2026
- Market Size Statistics
- Water & Wastewater Pump in US is estimated at $ 1.75 Billion.
- The market size is expected to grow to $ 2.01 Billion by 2032.
- Market to register a CAGR of around 2% during 2026-32.
- Pump Type Segment
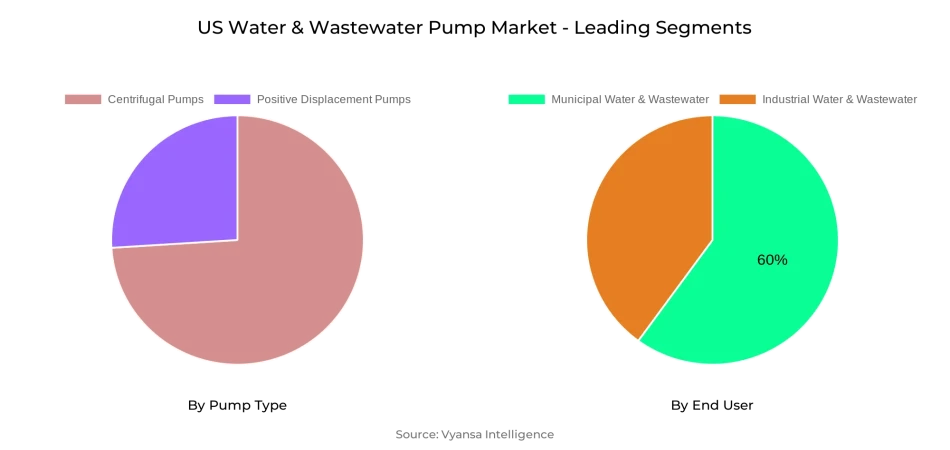
- Centrifugal Pumps continues to dominate the market.
- Competition
- More than 10 companies are actively engaged in producing Water & Wastewater Pump in US.
- Top 5 companies acquired the maximum share of the market.
- ITT, IDEX, Dover, Flowserve, Sulzer AG etc., are few of the top companies.
- End User
- Municipal Water & Wastewater grabbed 60% of the market.
US Water & Wastewater Pump Market Outlook
The US Water & Wastewater Pump market is poised for consistent growth, with the market being worth $1.75 billion in 2025 and reaching $2.01 billion by 2032. This growth is driven by the necessity to replace outdated infrastructure as the typical US water-network pipe is 45 years old, and certain cast-iron pipes have been in operation for more than a century. Water main breaks is costing $2.6 billion a year and wastewater treatment plants already operating at an average of 81% capacity mean that demand for high-end pumping systems will continue to be strong through 2026–2032.
Environmental regulations also propel pump replacements and upgrades nationwide. The EPA's increasingly stringent standards, such as new PFAS regulations, are compelling utilities—particularly smaller water systems—to weigh compliance expense against service affordability. Utilities alone spent more than $3 billion in 2019 to replace 4,700 miles of pipe, highlighting the cost of these regulations. Municipal systems, 60% of the market, are still the largest end user due to their need for high-capacity pumps for water treatment, distribution, and wastewater collection.
Paralleling this is technological change, as the market gets transformed. Intelligent pumping systems with IoT sensors, real-time monitoring, and predictive maintenance decrease water losses by as much as 30% and lower energy consumption by as much as 50%. Such systems, combined with machine learning and integration into 5G, are being increasingly rolled out as utilities look for cost-effectiveness and operational consistency. These innovations keep pumps not just addressing short-term infrastructure demands but also enable long-term goals of modernization.
Of pump types, centrifugal pumps lead the market because of their flexibility, affordability, and established performance under continuous-duty use. Their flexibility in design, simplicity of maintenance, and long history of reliability establish them as the best choice for the majority of water and wastewater projects. While that, the industrial category is the most rapidly expanding end user, propelled by tighter environmental regulations and greater incorporation of water recycling technologies, especially for markets like pharmaceuticals, food, and chemicals.

US Water & Wastewater Pump Market Growth Driver
Aging Infrastructure Drives Critical Replacement Demand
The US water infrastructure reflects a critical replacement crisis that continues to drive market growth. Research at Utah State University has found the typical US water-network pipe to be 45 years old, with some cast-iron pipes reaching over 100 years. The EPA forecasts water-pipe replacement rates will reach their peak in 2035 at 16,000 to 20,000 miles per year—four times today's replacement level. This infrastructure degradation generates enormous pumping system replacement demands throughout municipal and industrial plants.
The extent of water main failures illustrates the urgent character of this driver. North America suffers around 260,000 water main breaks every year, costing $2.6 billion to repair. Moreover, wastewater treatment facilities across the country are operating at a mean of 81% of their design capacity, with 15% already at or above capacity levels. Such aging infrastructures call for ongoing pump replacement and upgrades to ensure operational dependability and regulatory compliance, generating persistent market demand up to 2032
US Water & Wastewater Pump Market Challenge
Regulatory Compliance Creates Cost Pressures
Federal and state environmental regulations are a persistent challenge to water and wastewater plants throughout the United States. The EPA has made water quality standards more complicated year by year, with new PFAS regulations the potential cause for a tripling of capital expenditures from 2021 to 2025. Municipal systems experience a big load on the bank, with utilities paying more than $3 billion in 2019 to replace nearly 4,700 miles of pipe nationwide.
The regulatory framework becomes especially burdensome for smaller water utilities. Based on Nature journal research, 489,836 homes have no complete plumbing, and 1,165 community water systems are in Serious Violation status under the Safe Drinking Water Act. Small groundwater systems with 10,000 or fewer residents account for 98% of lead and copper violations. These compliance demands put pressure on operational budgets and force tough choices between achieving regulatory compliance and keeping affordable customer service rates.
Unlock Market Intelligence
Explore the market potential with our data-driven report
US Water & Wastewater Pump Market Trend
Smart Technology Integration Transforms Operations
The water sector witnesses aggressive implementation of smart pumping systems that encompass IoT sensors, real-time monitoring, and predictive maintenance features. Smart water management estimates indicate the IoT water market growing with systems lowering water losses by up to 30%. Variable frequency drives allow pumps to save energy up to 50% in comparison to fixed-speed systems. Such technologies enable plants to observe parameters such as pressure, temperature, and flow in real time while they also forecast maintenance requirements.
Sophisticated automation becomes more common as plants pursue operational efficiency benefits. Smart pump technology includes machine learning algorithms and cognitive intelligence to translate performance information. The use of 5G networks facilitates more detailed data gathering from previously challenging-to-monitor locations, enabling utilities to respond and avoid issues earlier than legacy systems. This evolution in technology sets smart pumping solutions as critical building blocks for contemporary water management infrastructure through 2032.
US Water & Wastewater Pump Market Opportunity
Climate Resilience Creates Expansion Opportunities
Severe weather conditions and climate change effects create major prospects for sophisticated pumping systems in water infrastructure. The EPA estimates 2 trillion gallons of treated drinking water are lost every year because of old infrastructure, which is enough to supply 30 million homes. Climate change flooding increasingly exposes water treatment facilities, especially those in low areas near water bodies. Such conditions generate demand for flood-resistant pumping systems and redundant infrastructure.
Unlock Market Intelligence
Explore the market potential with our data-driven report
US Water & Wastewater Pump Market Segmentation Analysis
By Pump Type
- Centrifugal Pumps
- Positive Displacement Pumps
The most dominant market share under the pump type category is held by centrifugal pumps, which remain the market leader. Centrifugal pumps have been able to retain their leadership because they are versatile, dependable, and affordable for a wide range of water and wastewater applications. These pumps perform well in high-flow, low-to-medium head applications typical of most municipal water distribution and wastewater collection systems.
Centrifugal pumps provide several benefits that continue to support their market supremacy, such as reduced up-front capital, easier maintenance needs, and established performance in continuous-duty service. Their high degree of design flexibility enables tailoring for particular system needs, and standardized parts guarantee easily obtained replacement units and serviceability. Established maturity of the technology equips operators with deep operation experience and established best practices, lending strength to centrifugal pumps' status as the preferred product for most water infrastructure uses.
By End User
- Industrial Water & Wastewater
- Municipal Water & Wastewater
The most market-share chunk under end user falls under Municipal Water & Wastewater, which took 60% market share. This is because of the large infrastructure needs of public water systems that serve millions of Americans every day. Municipal systems need reliable high-capacity water treatment, distribution, collection, and wastewater processing operations in their service areas.
Industrial Water & Wastewater is the fastest-growing end-user industry with a CAGR of 3.25%. Industrial growth is a result of increased manufacturing operations, tighter environmental compliance, and expanded use of water recycling technologies. Demand comes from industries like pharmaceuticals, food processing, chemicals, and power generation for specialized pumping applications that meet strict process demands and regulatory requirements and support sustainability efforts and operational efficiency enhancement.
Top Companies in US Water & Wastewater Pump Market
The top companies operating in the market include ITT, IDEX, Dover, Flowserve, Sulzer AG, KSB, Xylem, Grundfos, Ebara, SPX Flow, etc., are the top players operating in the US Water & Wastewater Pump Market.
Frequently Asked Questions
Related Report
1. Market Segmentation
1.1. Research Scope
1.2. Research Methodology
1.3. Definitions and Assumptions
2. Executive Summary
3. US Water & Wastewater Pump Market Policies, Regulations, and Standards
4. US Water & Wastewater Pump Market Dynamics
4.1. Growth Factors
4.2. Challenges
4.3. Trends
4.4. Opportunities
5. US Water & Wastewater Pump Market Statistics, 2022-2032F
5.1. Market Size & Growth Outlook
5.1.1.By Revenues in US$ Million
5.2. Market Segmentation & Growth Outlook
5.2.1.By Pump Type
5.2.1.1. Centrifugal Pumps- Market Insights and Forecast 2022-2032, USD Million
5.2.1.1.1. End Suction- Market Insights and Forecast 2022-2032, USD Million
5.2.1.1.2. Split Case- Market Insights and Forecast 2022-2032, USD Million
5.2.1.1.3. Vertical- Market Insights and Forecast 2022-2032, USD Million
5.2.1.1.3.1. Turbine- Market Insights and Forecast 2022-2032, USD Million
5.2.1.1.3.2. Axial Pump- Market Insights and Forecast 2022-2032, USD Million
5.2.1.1.3.3. Mixed Flow Pump- Market Insights and Forecast 2022-2032, USD Million
5.2.1.1.4. Submersible Pump- Market Insights and Forecast 2022-2032, USD Million
5.2.1.2. Positive Displacement Pumps- Market Insights and Forecast 2022-2032, USD Million
5.2.1.2.1. Progressing Cavity- Market Insights and Forecast 2022-2032, USD Million
5.2.1.2.2. Diaphragm- Market Insights and Forecast 2022-2032, USD Million
5.2.1.2.3. Gear Pump- Market Insights and Forecast 2022-2032, USD Million
5.2.1.2.4. Others- Market Insights and Forecast 2022-2032, USD Million
5.2.2.By Application
5.2.2.1. Water- Market Insights and Forecast 2022-2032, USD Million
5.2.2.2. Wastewater- Market Insights and Forecast 2022-2032, USD Million
5.2.3.By End User
5.2.3.1. Industrial Water & Wastewater- Market Insights and Forecast 2022-2032, USD Million
5.2.3.2. Municipal Water & Wastewater- Market Insights and Forecast 2022-2032, USD Million
5.2.4.By Competitors
5.2.4.1. Competition Characteristics
5.2.4.2. Market Share & Analysis
6. US Centrifugal Water & Wastewater Pump Market Statistics, 2020-2030F
6.1. Market Size & Growth Outlook
6.1.1.By Revenues in US$ Million
6.2. Market Segmentation & Growth Outlook
6.2.1.By Pump Type- Market Insights and Forecast 2022-2032, USD Million
6.2.2.By Application- Market Insights and Forecast 2022-2032, USD Million
6.2.3.By End User- Market Insights and Forecast 2022-2032, USD Million
7. US Positive Displacement Water & Wastewater Pump Market Statistics, 2020-2030F
7.1. Market Size & Growth Outlook
7.1.1.By Revenues in US$ Million
7.2. Market Segmentation & Growth Outlook
7.2.1.By Pump Type- Market Insights and Forecast 2022-2032, USD Million
7.2.2.By Application- Market Insights and Forecast 2022-2032, USD Million
7.2.3.By End User- Market Insights and Forecast 2022-2032, USD Million
8. Competitive Outlook
8.1. Company Profiles
8.1.1.Flowserve Corporation
8.1.1.1. Business Description
8.1.1.2. Product Portfolio
8.1.1.3. Collaborations & Alliances
8.1.1.4. Recent Developments
8.1.1.5. Financial Details
8.1.1.6. Others
8.1.2.Ebara Corporation
8.1.2.1. Business Description
8.1.2.2. Product Portfolio
8.1.2.3. Collaborations & Alliances
8.1.2.4. Recent Developments
8.1.2.5. Financial Details
8.1.2.6. Others
8.1.3.WILO SE
8.1.3.1. Business Description
8.1.3.2. Product Portfolio
8.1.3.3. Collaborations & Alliances
8.1.3.4. Recent Developments
8.1.3.5. Financial Details
8.1.3.6. Others
8.1.4.Sulzer Limited
8.1.4.1. Business Description
8.1.4.2. Product Portfolio
8.1.4.3. Collaborations & Alliances
8.1.4.4. Recent Developments
8.1.4.5. Financial Details
8.1.4.6. Others
8.1.5.Grundfos Holding A/S
8.1.5.1. Business Description
8.1.5.2. Product Portfolio
8.1.5.3. Collaborations & Alliances
8.1.5.4. Recent Developments
8.1.5.5. Financial Details
8.1.5.6. Others
8.1.6.Xylem Inc.
8.1.6.1. Business Description
8.1.6.2. Product Portfolio
8.1.6.3. Collaborations & Alliances
8.1.6.4. Recent Developments
8.1.6.5. Financial Details
8.1.6.6. Others
8.1.7.KSB SE & Co. KGaA
8.1.7.1. Business Description
8.1.7.2. Product Portfolio
8.1.7.3. Collaborations & Alliances
8.1.7.4. Recent Developments
8.1.7.5. Financial Details
8.1.7.6. Others
8.1.8.Kirloskar Brothers Limited (KBL)
8.1.8.1. Business Description
8.1.8.2. Product Portfolio
8.1.8.3. Collaborations & Alliances
8.1.8.4. Recent Developments
8.1.8.5. Financial Details
8.1.8.6. Others
8.1.9.Franklin Electric
8.1.9.1. Business Description
8.1.9.2. Product Portfolio
8.1.9.3. Collaborations & Alliances
8.1.9.4. Recent Developments
8.1.9.5. Financial Details
8.1.9.6. Others
8.1.10. Pentair PLC
8.1.10.1. Business Description
8.1.10.2. Product Portfolio
8.1.10.3. Collaborations & Alliances
8.1.10.4. Recent Developments
8.1.10.5. Financial Details
8.1.10.6. Others
9. Disclaimer
| Segment | Sub-Segment |
|---|---|
| By Pump Type |
|
| By Application |
|
| By End User |
|
Research Methodology
This study followed a structured approach comprising four key phases to assess the size and scope of the electro-oxidation market. The process began with thorough secondary research to collect data on the target market, related markets, and broader industry context. These findings, along with preliminary assumptions and estimates, were then validated through extensive primary research involving industry experts from across the value chain. To calculate the overall market size, both top-down and bottom-up methodologies were employed. Finally, market segmentation and data triangulation techniques were applied to refine and validate segment-level estimations.
Secondary Research
The secondary research phase involved gathering data from a wide range of credible and published sources. This step helped in identifying industry trends, defining market segmentation, and understanding the market landscape and value chain.
Sources consulted during this phase included:
- Company annual reports, investor presentations, and press releases
- Industry white papers and certified publications
- Trade directories and market-recognized databases
- Articles from authoritative authors and reputable journals
- Gold and silver standard websites
Secondary research was critical in mapping out the industry's value chain and monetary flow, identifying key market segments, understanding regional variations, and tracking significant industry developments.
Other key sources:
- Financial disclosures
- Industry associations and trade bodies
- News outlets and business magazines
- Academic journals and research studies
- Paid industry databases
Primary Research
To validate secondary data and gain deeper market insights, primary research was conducted with key stakeholders across both the supply and demand sides of the market.
On the demand side, participants included decision-makers and influencers from end-user industries—such as CIOs, CTOs, and CSOs—who provided first-hand perspectives on market needs, product usage, and future expectations.
On the supply side, interviews were conducted with manufacturers, industry associations, and institutional participants to gather insights into current offerings, product pipelines, and market challenges.
Primary interviews provided critical inputs such as:
- Market size and revenue data
- Product and service breakdowns
- Market forecasts
- Regional and application-specific trends
Stakeholders consulted included:
- Leading OEM and solution providers
- Channel and distribution partners
- End users across various applications
- Independent consultants and industry specialists
Market Size Estimation and Data Triangulation
- Identifying Key Market Participants (Secondary Research)
- Goal: To identify the major players or companies in the target market. This typically involves using publicly available data sources such as industry reports, market research publications, and financial statements of companies.
- Tools: Reports from firms like Gartner, Forrester, Euromonitor, Statista, IBISWorld, and others. Public financial statements, news articles, and press releases from top market players.
- Extracting Earnings of Key Market Participants
- Goal: To estimate the earnings generated from the product or service being analyzed. This step helps in understanding the revenue potential of each market player in a specific geography.
- Methods: Earnings data can be gathered from:
- Publicly available financial reports (for listed companies).
- Interviews and primary data sources from professionals, such as Directors, VPs, SVPs, etc. This is especially useful for understanding more nuanced, internal data that isn't publicly disclosed.
- Annual reports and investor presentations of key players.
- Data Collation and Development of a Relevant Data Model
- Goal: To collate inputs from both primary and secondary sources into a structured, data-driven model for market estimation. This model will incorporate key market KPIs and any independent variables relevant to the market.
- Key KPIs: These could include:
- Market size, growth rate, and demand drivers.
- Industry-specific metrics like market share, average revenue per customer (ARPC), or average deal size.
- External variables, such as economic growth rates, inflation rates, or commodity prices, that could affect the market.
- Data Modeling: Based on this data, the market forecasts are developed for the next 5 years. A combination of trend analysis, scenario modeling, and statistical regression might be used to generate projections.
- Scenario Analysis
- Goal: To test different assumptions and validate how sensitive the market is to changes in key variables (e.g., market demand, regulatory changes, technological disruptions).
- Types of Scenarios:
- Base Case: Based on current assumptions and historical data.
- Best-Case Scenario: Assuming favorable market conditions, regulatory environments, and technological advancements.
- Worst-Case Scenario: Accounting for adverse factors, such as economic downturns, stricter regulations, or unexpected disruptions.


