US Leisure & Business Travel Booking Market Report: Trends, Growth and Forecast (2026-2032)
By Travel Sales Type (Leisure Travel, Business Travel), By Booking Channel (Offline Booking, Online Booking), By Booking Method (Travel Intermediaries, Direct Suppliers) ... Read more

|
Major Players
|
US Leisure & Business Travel Booking Market Statistics and Insights, 2026
- Market Size Statistics
- Leisure & Business Travel Booking in US is estimated at $ 777.29 Billion.
- The market size is expected to grow to $ 917.35 Billion by 2032.
- Market to register a CAGR of around 2.4% during 2026-32.
- Travel Sales Type Shares
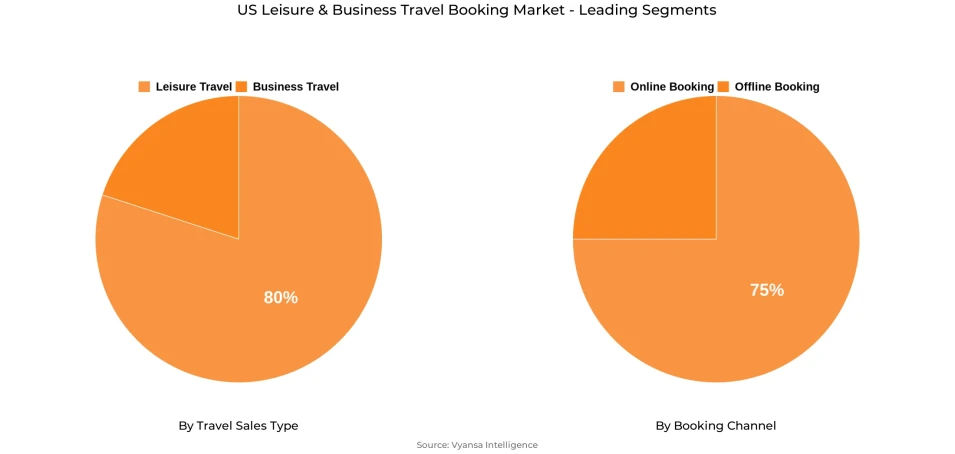
- Leisure Travel grabbed market share of 80%.
- Competition
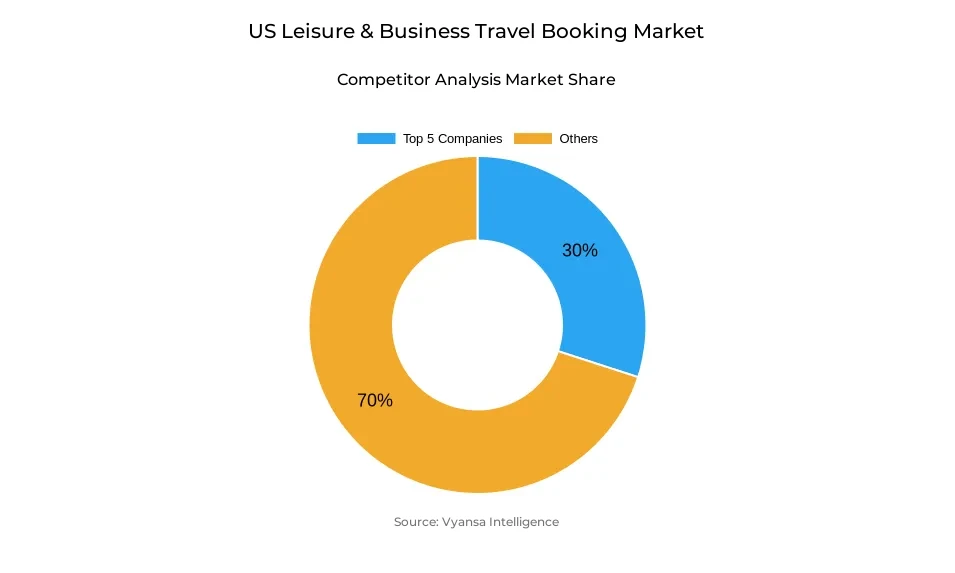
- US Leisure & Business Travel Booking Market is currently being catered to by more than 10 companies.
- Top 5 companies acquired 30% of the market share.
- AAA Travel, Travel Leaders Group LLC, Flight Centre USA Inc, Expedia Group Inc, American Express Co etc., are few of the top companies.
- Booking Channel
- Online Booking grabbed 75% of the market.
US Leisure & Business Travel Booking Market Outlook
The US Leisure & Business Travel Booking market is worth $777.29 billion in 2024 and is expected to reach $917.35 billion by 2032. Online booking leads the way with 75% market share, indicating end users' preference for digital convenience and value through loyalty. Inflation has affected end user spending, but most end users still value travel, even restructuring other costs or debt in order to afford vacations. end users are extending travel seasons, searching for lesser-known destinations advertised on social media, and taking advantage of value via loyalty programs, credit card promotions, and direct booking rewards.
Aside from affordability, end users increasingly expect distinctive and customised experiences. Younger travelers especially appreciate interactive and social experiences, from food and cultural packages to niche offerings such as sports- or entertainment-focused cruises. Travel companies and OTAs are meeting this with carefully curated packages that prioritize exclusivity and appeal to groups of like-interest travelers. The high performance of sites such as Viator indicates the strength behind experience-centric bookings.
Meanwhile, competition is growing more heated with Google Travel growing in influence. Through its introduction of sophisticated AI into its search and book platforms, Google provides personalized itineraries and one-click planning, threatening to disrupt conventional OTAs. This AI-powered ease, together with chat-based support products, is transforming client expectations and may reinvent booking behaviors within the forecast period.
Going forward, airlines, hotels, and credit card issuers will be driving bookings more with loyalty and reward programs. end users become more willing to shop across several channels—direct, OTA, and credit card sites—depending on where they perceive greatest value. Those firms that can combine flexibility, personalisation, and incentives driven by loyalty will be best placed to capitalize on growth in the US booking market between 2032.
US Leisure & Business Travel Booking Market Growth Driver
Increased Use of Multi-Booking Channels
US travelers are booking more and more through various means like OTAs, credit card travel systems, and direct book sites, depending on where they get the best value, rewards, and service. Most end users are lured back to OTAs for bargains, but younger travelers use credit card travel systems more and more to maximize points and promotions. Some travelers are sticking with direct book, spurred on by special services provided by the sites.
This emerging blend of booking behaviors fuels competition between platforms, compelling OTAs, credit card schemes, and direct bookers to innovate and enhance their loyalty programs. As end users increasingly seek flexibility, incentives, and convenience, travel businesses are forced to enhance their propositions. This dynamic spurs market growth and influences the changing face of US travel booking.
US Leisure & Business Travel Booking Market Trend
Experience-Driven Travel Among Younger US Travellers
In the US, younger travellers are prioritising experiences over material possessions, seeking trips that offer social interaction and immersive activities. Independent travelers usually seek group-based holidays where they can interact with new people as they visit new places. Travel agents and operators are meeting the demand by providing special packages for specialized interest groups, where social interaction is balanced with new activities that reflect their interests.
Examples range from Evyssa Vacations' pickleball European river cruises to MSC Cruises' 7-night F1-themed cruises in Qatar, with passengers indulging in themed events and exclusive race access. These experiences appeal to price-sensitive end users who are prepared to pay more for intimate, memorable experiences. The increasing popularity of experience-centric booking sites, like Viator, signals the trend towards experiential travel, as US end users increasingly look for holidays providing one-of-a-kind, once-in-a-lifetime experiences over conventional holiday choices.
Unlock Market Intelligence
Explore the market potential with our data-driven report
US Leisure & Business Travel Booking Market Opportunity
AI-Powered Travel Planning
AI-driven travel planning is creating significant growth opportunities in the US market. Applications such as Google Travel are employing sophisticated search and generative AI capabilities to enable end users to plan personalized journeys according to budget, interests, and destination. With flight, hotel, and activity search blended with booking, reviews, and itinerary recommendations, these tools make it easier for end users to plan a trip and offer tailored experiences that end users increasingly demand.
For travel intermediaries, the adoption of AI-based solutions offers the opportunity to carve a niche among competitors and reach technology-friendly end users. Through the provision of handpicked itineraries and hassle-free booking experiences, OTAs and travel brands can maximize customer interaction, stay relevant in the face of giant platforms such as Google, and catch the convenience-hungry and customized travel solution-seeking traveller. AI adoption becomes the pivotal force to gain market share and make the brand stronger in the US leisure and business traveller booking marketplace.
Unlock Market Intelligence
Explore the market potential with our data-driven report
US Leisure & Business Travel Booking Market Segmentation Analysis
By Travel Sales Type
- Leisure Travel
- Business Travel
The segment with highest market share under Travel Sales Type is Leisure Travel, which took 80% of the market. End users still prioritize travel experience despite increased prices, valuing and expecting unique experiences. Most travellers are ready to pay extra for customized or culturally enriching trips, like sampling local food, enjoying cultural events, or paying for specialized activity-based packages.
Leisure travelers are becoming more willing to be flexible on their traveling dates and places, frequently going for off-peak seasons or secondary destinations in order to achieve maximum value. They also reserve through more than one booking channel, such as direct hotel or airline bookings, in order to enjoy loyalty programs and promotions. This segment propels the market since end users continuously spend money on trips that are both memorable and represent good value.
By Booking Channel
- Offline Booking
- Online Booking
The segment with highest market share under Booking Channel is Online Booking, which holds a market share of 75%. Travelers are attracted to online platforms due to the ease of price comparison, reviews, and personalizing itineraries. end users resort to online resources to discover offers, optimise loyalty rewards, and organise bespoke experiences, thus online booking is a mode preferred by all segments.
Online booking also serves travelers interested in distinctive or experiential experiences, such as specialized packages, experiential accommodation, or interest-driven journeys. AI-powered search and itinerary planning integration further enhances the channel for end users to conveniently construct tailor-made trips within budget. Online booking continues to be at the core of the market because it is convenient, flexible, and can deliver value.
Top Companies in US Leisure & Business Travel Booking Market
The top companies operating in the market include AAA Travel, Travel Leaders Group LLC, Flight Centre USA Inc, Expedia Group Inc, American Express Co, Booking.com BV, BCD Travel, Carlson Cos Inc, Corporate Travel Management Ltd, Classic Vacations Inc, etc., are the top players operating in the US Leisure & Business Travel Booking Market.
Frequently Asked Questions
Related Report
1. Market Segmentation
1.1. Research Scope
1.2. Research Methodology
1.3. Definitions and Assumptions
2. Executive Summary
3. US Leisure & Business Travel Booking Market Policies, Regulations, and Standards
4. US Leisure & Business Travel Booking Market Dynamics
4.1. Growth Factors
4.2. Challenges
4.3. Trends
4.4. Opportunities
5. US Leisure & Business Travel Booking Market Statistics, 2022-2032F
5.1. Market Size & Growth Outlook
5.1.1. By Revenues in US$ Million
5.2. Market Segmentation & Growth Outlook
5.2.1. By Travel Sales Type
5.2.1.1. Leisure Travel- Market Insights and Forecast 2022-2032, USD Million
5.2.1.2. Business Travel- Market Insights and Forecast 2022-2032, USD Million
5.2.2. By Booking Channel
5.2.2.1. Offline Booking- Market Insights and Forecast 2022-2032, USD Million
5.2.2.2. Online Booking- Market Insights and Forecast 2022-2032, USD Million
5.2.3. By Booking Method
5.2.3.1. Travel Intermediaries- Market Insights and Forecast 2022-2032, USD Million
5.2.3.2. Direct Suppliers- Market Insights and Forecast 2022-2032, USD Million
5.2.4. By Competitors
5.2.4.1. Competition Characteristics
5.2.4.2. Market Share & Analysis
6. US Leisure Travel Booking Market Statistics, 2022-2032F
6.1. Market Size & Growth Outlook
6.1.1. By Revenues in US$ Million
6.2. Market Segmentation & Growth Outlook
6.2.1. By Travel Sales Type- Market Insights and Forecast 2022-2032, USD Million
6.2.1.1. Leisure Air Travel- Market Insights and Forecast 2022-2032, USD Million
6.2.1.2. Leisure Car Rental- Market Insights and Forecast 2022-2032, USD Million
6.2.1.3. Leisure Cruise- Market Insights and Forecast 2022-2032, USD Million
6.2.1.4. Leisure Experiences and Attractions- Market Insights and Forecast 2022-2032, USD Million
6.2.1.5. Leisure Lodging- Market Insights and Forecast 2022-2032, USD Million
6.2.2. By Booking Channel- Market Insights and Forecast 2022-2032, USD Million
6.2.3. By Booking Method- Market Insights and Forecast 2022-2032, USD Million
7. US Business Travel Booking Market Statistics, 2022-2032F
7.1. Market Size & Growth Outlook
7.1.1. By Revenues in US$ Million
7.2. Market Segmentation & Growth Outlook
7.2.1. By Travel Sales Type- Market Insights and Forecast 2022-2032, USD Million
7.2.1.1. Business Air Travel- Market Insights and Forecast 2022-2032, USD Million
7.2.1.2. Business Car Rental- Market Insights and Forecast 2022-2032, USD Million
7.2.1.3. Business Lodging- Market Insights and Forecast 2022-2032, USD Million
7.2.1.4. Others- Market Insights and Forecast 2022-2032, USD Million
7.2.2. By Booking Channel- Market Insights and Forecast 2022-2032, USD Million
7.2.3. By Booking Method- Market Insights and Forecast 2022-2032, USD Million
8. Competitive Outlook
8.1. Company Profiles
8.1.1. Expedia Group Inc
8.1.1.1. Business Description
8.1.1.2. Service Portfolio
8.1.1.3. Collaborations & Alliances
8.1.1.4. Recent Developments
8.1.1.5. Financial Details
8.1.1.6. Others
8.1.2. American Express Co
8.1.2.1. Business Description
8.1.2.2. Service Portfolio
8.1.2.3. Collaborations & Alliances
8.1.2.4. Recent Developments
8.1.2.5. Financial Details
8.1.2.6. Others
8.1.3. Booking.com BV
8.1.3.1. Business Description
8.1.3.2. Service Portfolio
8.1.3.3. Collaborations & Alliances
8.1.3.4. Recent Developments
8.1.3.5. Financial Details
8.1.3.6. Others
8.1.4. BCD Travel
8.1.4.1. Business Description
8.1.4.2. Service Portfolio
8.1.4.3. Collaborations & Alliances
8.1.4.4. Recent Developments
8.1.4.5. Financial Details
8.1.4.6. Others
8.1.5. Carlson Cos Inc
8.1.5.1. Business Description
8.1.5.2. Service Portfolio
8.1.5.3. Collaborations & Alliances
8.1.5.4. Recent Developments
8.1.5.5. Financial Details
8.1.5.6. Others
8.1.6. AAA Travel
8.1.6.1. Business Description
8.1.6.2. Service Portfolio
8.1.6.3. Collaborations & Alliances
8.1.6.4. Recent Developments
8.1.6.5. Financial Details
8.1.6.6. Others
8.1.7. Travel Leaders Group LLC
8.1.7.1. Business Description
8.1.7.2. Service Portfolio
8.1.7.3. Collaborations & Alliances
8.1.7.4. Recent Developments
8.1.7.5. Financial Details
8.1.7.6. Others
8.1.8. Flight Centre USA Inc
8.1.8.1. Business Description
8.1.8.2. Service Portfolio
8.1.8.3. Collaborations & Alliances
8.1.8.4. Recent Developments
8.1.8.5. Financial Details
8.1.8.6. Others
8.1.9. Corporate Travel Management Ltd
8.1.9.1. Business Description
8.1.9.2. Service Portfolio
8.1.9.3. Collaborations & Alliances
8.1.9.4. Recent Developments
8.1.9.5. Financial Details
8.1.9.6. Others
8.1.10. Classic Vacations Inc
8.1.10.1. Business Description
8.1.10.2. Service Portfolio
8.1.10.3. Collaborations & Alliances
8.1.10.4. Recent Developments
8.1.10.5. Financial Details
8.1.10.6. Others
9. Disclaimer
| Segment | Sub-Segment |
|---|---|
| By Travel Sales Type |
|
| By Booking Channel |
|
| By Booking Method |
|
Research Methodology
This study followed a structured approach comprising four key phases to assess the size and scope of the electro-oxidation market. The process began with thorough secondary research to collect data on the target market, related markets, and broader industry context. These findings, along with preliminary assumptions and estimates, were then validated through extensive primary research involving industry experts from across the value chain. To calculate the overall market size, both top-down and bottom-up methodologies were employed. Finally, market segmentation and data triangulation techniques were applied to refine and validate segment-level estimations.
Secondary Research
The secondary research phase involved gathering data from a wide range of credible and published sources. This step helped in identifying industry trends, defining market segmentation, and understanding the market landscape and value chain.
Sources consulted during this phase included:
- Company annual reports, investor presentations, and press releases
- Industry white papers and certified publications
- Trade directories and market-recognized databases
- Articles from authoritative authors and reputable journals
- Gold and silver standard websites
Secondary research was critical in mapping out the industry's value chain and monetary flow, identifying key market segments, understanding regional variations, and tracking significant industry developments.
Other key sources:
- Financial disclosures
- Industry associations and trade bodies
- News outlets and business magazines
- Academic journals and research studies
- Paid industry databases
Primary Research
To validate secondary data and gain deeper market insights, primary research was conducted with key stakeholders across both the supply and demand sides of the market.
On the demand side, participants included decision-makers and influencers from end-user industries—such as CIOs, CTOs, and CSOs—who provided first-hand perspectives on market needs, product usage, and future expectations.
On the supply side, interviews were conducted with manufacturers, industry associations, and institutional participants to gather insights into current offerings, product pipelines, and market challenges.
Primary interviews provided critical inputs such as:
- Market size and revenue data
- Product and service breakdowns
- Market forecasts
- Regional and application-specific trends
Stakeholders consulted included:
- Leading OEM and solution providers
- Channel and distribution partners
- End users across various applications
- Independent consultants and industry specialists
Market Size Estimation and Data Triangulation
- Identifying Key Market Participants (Secondary Research)
- Goal: To identify the major players or companies in the target market. This typically involves using publicly available data sources such as industry reports, market research publications, and financial statements of companies.
- Tools: Reports from firms like Gartner, Forrester, Euromonitor, Statista, IBISWorld, and others. Public financial statements, news articles, and press releases from top market players.
- Extracting Earnings of Key Market Participants
- Goal: To estimate the earnings generated from the product or service being analyzed. This step helps in understanding the revenue potential of each market player in a specific geography.
- Methods: Earnings data can be gathered from:
- Publicly available financial reports (for listed companies).
- Interviews and primary data sources from professionals, such as Directors, VPs, SVPs, etc. This is especially useful for understanding more nuanced, internal data that isn't publicly disclosed.
- Annual reports and investor presentations of key players.
- Data Collation and Development of a Relevant Data Model
- Goal: To collate inputs from both primary and secondary sources into a structured, data-driven model for market estimation. This model will incorporate key market KPIs and any independent variables relevant to the market.
- Key KPIs: These could include:
- Market size, growth rate, and demand drivers.
- Industry-specific metrics like market share, average revenue per customer (ARPC), or average deal size.
- External variables, such as economic growth rates, inflation rates, or commodity prices, that could affect the market.
- Data Modeling: Based on this data, the market forecasts are developed for the next 5 years. A combination of trend analysis, scenario modeling, and statistical regression might be used to generate projections.
- Scenario Analysis
- Goal: To test different assumptions and validate how sensitive the market is to changes in key variables (e.g., market demand, regulatory changes, technological disruptions).
- Types of Scenarios:
- Base Case: Based on current assumptions and historical data.
- Best-Case Scenario: Assuming favorable market conditions, regulatory environments, and technological advancements.
- Worst-Case Scenario: Accounting for adverse factors, such as economic downturns, stricter regulations, or unexpected disruptions.


