US Alcoholic Drinks Market Report: Trends, Growth and Forecast (2026-2032)
By Type (Beer, Cider/Perry, RTDs, Spirits, Wine), By Alcohol Content (High, Medium, Low), By Flavor (Unflavored, Flavored), By Packaging Type (Glass Bottles, Tins, Plastic Bottles, Others), By Sales Channel (On-Trade, Off-Trade (Retail Offline, Retail Online)) ... Read more

|
Major Players
|
US Alcoholic Drinks Market Statistics and Insights, 2026
- Market Size Statistics
- Alcoholic Drinks in US is estimated at $ 322.03 Billion.
- The market size is expected to grow to $ 345.88 Billion by 2032.
- Market to register a CAGR of around 1.03% during 2026-32.
- Type Shares
- Spirits grabbed market share of 35%.
- Spirits to witness a volume CAGR of around 0.44%.
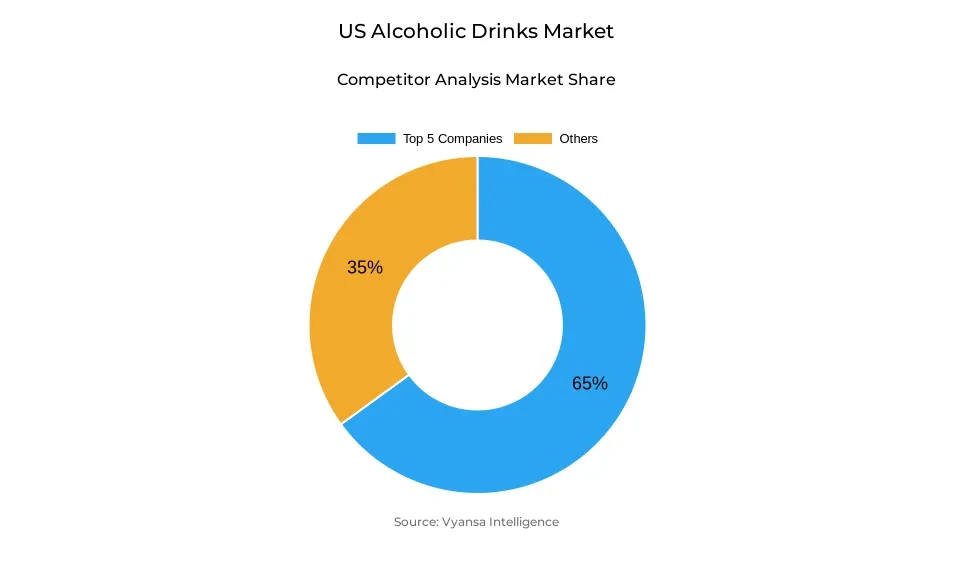
- Competition
- More than 10 companies are actively engaged in producing Alcoholic Drinks in US.
- Top 5 companies acquired 65% of the market share.
- Mark Anthony Group Inc, Boston Beer Co Inc,Diageo Plc, Anheuser-Busch InBev NV, Molson Coors Brewing Co etc., are few of the top companies.
- Sales Channel
- Off-Trade grabbed 53% of the market.
US Alcoholic Drinks Market Outlook
The US Alcoholic Drinks market is forecast to grow moderately during the forecasting period, with market value rising from a forecasted USD 322.03 billion in 2025 to USD 345.88 billion in 2032. Volume sales are set to flatline, in line with ongoing cautious end users expenditure and the ongoing nature of cost-of-living pressures. End users will continue to be choosy in their buying, opting for budget or premium alternatives based on incomes, with non-alcoholic and low-alcohol drinks ongoing gains as health-conscious alternatives.
Beer will retain its leading share with strong demand for malt-flavored and spirit-based Ready-to-Drink (RTD) products. RTDs will continue to be a growth driver, with convenience, innovation, and aspirational drinking at an affordable price. Spirits will experience a moderate volume CAGR of approximately 0.44%, with tequila, mezcal, and other high-end spirits continuing to gain traction even in the face of possible headwinds from tariffs and inflation. Wine and cider will experience slower growth, mostly regional and niche.
Off-trade outlets are projected to maintain their dominant position, covering approximately 53% of market sales. Speciality and liquor outlets will remain the choice for premium price-segment products, and contemporary grocery and convenience retailing will gain from changing end users tastes for single-serve packaging and convenience consumption. The on-trade market, comprising restaurants and bars, might still struggle as end users prefer value-oriented and experience-based occasions.
Innovation will be at the core of success, with premiumisation, flavour diversity, and sustainability guiding new product development. Local craft producers and no- and low-alcohol extensions will thrive by addressing changing tastes and occasion-based usage. Market trends overall point to a steady but conservative growth path fueled by innovation, tactical channel emphasis, and sensitivity to evolving end users behavior.
US Alcoholic Drinks Market Growth Driver
Health and Wellness Consciousness
Health and wellness awareness is a big influencer that is driving US alcoholic drinks market end users towards certain choices. end users are increasingly opting for moderation, seeking products with reduced calories, less carb content, and healthier positioning. This trend increases the demand for low-alcohol and non-alcoholic options and lighter RTDs, enabling end users to benefit from the social life of alcohol without contradicting their wellness objectives.
Brands react to this tendency by introducing innovative alternatives that cater to these expectations, including zero-alcohol beers and wellness-focused spirit-based RTDs. Mindful drinking emphasis makes end users more interested in quality and healthier options than in quantity. Consequently, health and wellbeing become at the forefront of product innovation and buying behavior, guaranteeing sustained impact on market dynamics.
US Alcoholic Drinks Market Trend
Premiumisation and Experiential Consumption
Premiumisation and experiential drinking are leading trends in the US Alcoholic Drinks market. end users increasingly seek out exceptional taste, premium ingredients, and convenient RTD packaging. Spirit-led products, tequila, mezcal, and Mexican lager capture this trend of seeking out premium experiences with aspirational status and convenience in equal measure. Brands emphasize creating special drinking experiences that extend beyond mainstream consumption through flavor innovation and lifestyle resonance.
Experiential consumption, such as culturally rich events, pop-up bars, and bespoke on-trade products, remains on the rise among Millennials and Gen Z. They appreciate distinctive social experiences and are prepared to pay for specialty products enhancing their occasions. This trend fuels innovation in both the alcoholic and non-Alcoholic Drinks markets while affirming the value of quality, flavor, and varied experiences in driving market growth.
Unlock Market Intelligence
Explore the market potential with our data-driven report
US Alcoholic Drinks Market Opportunity
Growth in Non-Alcoholic and RTD Products
The growth of non-alcoholic and RTD offerings is a central driver for the US alcoholic drind market. As wellness and moderation preference increases, brands can leverage portfolio expansion with new, low- and zero-alcohol, innovative products. These items provide convenience, variety, and aspirational occasions for consumption, allowing companies to reach a wider range of end users and new occasions.
Non-alcoholic drinks also open the route to on-trade growth, where special events and occasion-based drinking can drive take-up. Through flavor development, sustainability, and innovative packaging, brands are well-positioned to capitalize on changing end users tastes. Growth in the future is likely to be strongest in companies that provide differentiated experiences while responding to wellness priorities, allowing sustainable growth even in a volume-flat market.
Unlock Market Intelligence
Explore the market potential with our data-driven report
US Alcoholic Drinks Market Segmentation Analysis

By Type
- Beer
- Cider/Perry
- RTDs
- Spirits
- Wine
The segment with highest market share under type segment is Spirits with 35% of the US Alcoholic Drinks Market. Spirits are a driving force behind premiumisation trends, as end users turn to tequila, mezcal, and premium products that marry convenience and aspirational consumption. This segment has seen constant innovation in RTDs, ready-to-drink cocktails, and distinctive flavour profiles, maintaining high levels of engagement despite volume inactivity elsewhere in categories.
Spirits are poised to see a volume CAGR of about 0.44% growth on the back of end users demand for premium and specialty products as well as prospects from low- and non-alcoholic extensions. Quality-focused, unique, and sustainable brands will be best placed to take advantage of this end users demand and drive value in an uncertain market environment.
By Sales Channel
- On-Trade
- Off-Trade
The segment with highest market share under sales channel is Off-Trade with a share of 53% of the market. Off-trade channels such as supermarkets, liquor stores, and convenience retailers prevail because of on-trade access restrictions, high unit prices of spirits, and increasing end users choice for at-home consumption in the face of economic pressures.
The channel is advantaged by single-serve SKUs like 19.2oz and 24oz cans of beer and RTDs, and mini spirit serves, targeting convenience-seeking end users. Ongoing innovation in packaging, health-focused products, and affordable pricing strategies enable Off-Trade to remain a central distribution channel for Alcoholic Drinks in the US.
Top Companies in US Alcoholic Drinks Market
The top companies operating in the market include Mark Anthony Group Inc, Boston Beer Co Inc, Diageo Plc, Anheuser-Busch InBev NV, Molson Coors Brewing Co, Constellation Brands Inc, E&J Gallo Winery Inc, Heineken NV, Blue Ribbon Intermediate Holdings LLC, Wine Group Inc, The, etc., are the top players operating in the US Alcoholic Drinks Market.
Frequently Asked Questions
Related Report
1. Market Segmentation
1.1. Research Scope
1.2. Research Methodology
1.3. Definitions and Assumptions
2. Executive Summary
3. US Alcoholic Drinks Market Policies, Regulations, and Standards
4. US Alcoholic Drinks Market Dynamics
4.1. Growth Factors
4.2. Challenges
4.3. Trends
4.4. Opportunities
5. US Alcoholic Drinks Market Statistics, 2022-2032F
5.1. Market Size & Growth Outlook
5.1.1. By Revenues in US$ Million
5.1.2. By Quantity Sold in Million Litres
5.2. Market Segmentation & Growth Outlook
5.2.1. By Type
5.2.1.1. Beer- Market Insights and Forecast 2022-2032, USD Million
5.2.1.2. Cider/Perry- Market Insights and Forecast 2022-2032, USD Million
5.2.1.3. RTDs- Market Insights and Forecast 2022-2032, USD Million
5.2.1.4. Spirits- Market Insights and Forecast 2022-2032, USD Million
5.2.1.5. Wine- Market Insights and Forecast 2022-2032, USD Million
5.2.2. By Alcohol Content
5.2.2.1. High- Market Insights and Forecast 2022-2032, USD Million
5.2.2.2. Medium- Market Insights and Forecast 2022-2032, USD Million
5.2.2.3. Low- Market Insights and Forecast 2022-2032, USD Million
5.2.3. By Flavor
5.2.3.1. Unflavored- Market Insights and Forecast 2022-2032, USD Million
5.2.3.2. Flavored- Market Insights and Forecast 2022-2032, USD Million
5.2.4. By Packaging Type
5.2.4.1. Glass Bottles- Market Insights and Forecast 2022-2032, USD Million
5.2.4.2. Tins- Market Insights and Forecast 2022-2032, USD Million
5.2.4.3. Plastic Bottles- Market Insights and Forecast 2022-2032, USD Million
5.2.4.4. Others- Market Insights and Forecast 2022-2032, USD Million
5.2.5. By Sales Channel
5.2.5.1. On-Trade- Market Insights and Forecast 2022-2032, USD Million
5.2.5.2. Off-Trade- Market Insights and Forecast 2022-2032, USD Million
5.2.5.2.1. Retail Offline- Market Insights and Forecast 2022-2032, USD Million
5.2.5.2.2. Retail Online- Market Insights and Forecast 2022-2032, USD Million
5.2.6. By Competitors
5.2.6.1. Competition Characteristics
5.2.6.2. Market Share & Analysis
6. US Beer Market Statistics, 2022-2032F
6.1. Market Size & Growth Outlook
6.1.1. By Revenues in US$ Million
6.1.2. By Quantity Sold in Million Litres
6.2. Market Segmentation & Growth Outlook
6.2.1. By Alcohol Content- Market Insights and Forecast 2022-2032, USD Million
6.2.2. By Flavor- Market Insights and Forecast 2022-2032, USD Million
6.2.3. By Packaging Type- Market Insights and Forecast 2022-2032, USD Million
6.2.4. By Sales Channel- Market Insights and Forecast 2022-2032, USD Million
7. US Cider/Perry Market Statistics, 2022-2032F
7.1. Market Size & Growth Outlook
7.1.1. By Revenues in US$ Million
7.1.2. By Quantity Sold in Million Litres
7.2. Market Segmentation & Growth Outlook
7.2.1. By Alcohol Content- Market Insights and Forecast 2022-2032, USD Million
7.2.2. By Flavor- Market Insights and Forecast 2022-2032, USD Million
7.2.3. By Packaging Type- Market Insights and Forecast 2022-2032, USD Million
7.2.4. By Sales Channel- Market Insights and Forecast 2022-2032, USD Million
8. US Ready-to-Drink Market Statistics, 2022-2032F
8.1. Market Size & Growth Outlook
8.1.1. By Revenues in US$ Million
8.1.2. By Quantity Sold in Million Litres
8.2. Market Segmentation & Growth Outlook
8.2.1. By Alcohol Content- Market Insights and Forecast 2022-2032, USD Million
8.2.2. By Flavor- Market Insights and Forecast 2022-2032, USD Million
8.2.3. By Packaging Type- Market Insights and Forecast 2022-2032, USD Million
8.2.4. By Sales Channel- Market Insights and Forecast 2022-2032, USD Million
9. US Spirits Market Statistics, 2022-2032F
9.1. Market Size & Growth Outlook
9.1.1. By Revenues in US$ Million
9.1.2. By Quantity Sold in Million Litres
9.2. Market Segmentation & Growth Outlook
9.2.1. By Alcohol Content- Market Insights and Forecast 2022-2032, USD Million
9.2.2. By Flavor- Market Insights and Forecast 2022-2032, USD Million
9.2.3. By Packaging Type- Market Insights and Forecast 2022-2032, USD Million
9.2.4. By Sales Channel- Market Insights and Forecast 2022-2032, USD Million
10. US Wine Market Statistics, 2022-2032F
10.1.Market Size & Growth Outlook
10.1.1. By Revenues in US$ Million
10.1.2. By Quantity Sold in Million Litres
10.2.Market Segmentation & Growth Outlook
10.2.1. By Alcohol Content- Market Insights and Forecast 2022-2032, USD Million
10.2.2. By Flavor- Market Insights and Forecast 2022-2032, USD Million
10.2.3. By Packaging Type- Market Insights and Forecast 2022-2032, USD Million
10.2.4. By Sales Channel- Market Insights and Forecast 2022-2032, USD Million
11. Competitive Outlook
11.1.Company Profiles
11.1.1. Anheuser-Busch InBev NV
11.1.1.1. Business Description
11.1.1.2. Product Portfolio
11.1.1.3. Collaborations & Alliances
11.1.1.4. Recent Developments
11.1.1.5. Financial Details
11.1.1.6. Others
11.1.2. Molson Coors Brewing Co
11.1.2.1. Business Description
11.1.2.2. Product Portfolio
11.1.2.3. Collaborations & Alliances
11.1.2.4. Recent Developments
11.1.2.5. Financial Details
11.1.2.6. Others
11.1.3. Constellation Brands Inc
11.1.3.1. Business Description
11.1.3.2. Product Portfolio
11.1.3.3. Collaborations & Alliances
11.1.3.4. Recent Developments
11.1.3.5. Financial Details
11.1.3.6. Others
11.1.4. E&J Gallo Winery Inc
11.1.4.1. Business Description
11.1.4.2. Product Portfolio
11.1.4.3. Collaborations & Alliances
11.1.4.4. Recent Developments
11.1.4.5. Financial Details
11.1.4.6. Others
11.1.5. Heineken NV
11.1.5.1. Business Description
11.1.5.2. Product Portfolio
11.1.5.3. Collaborations & Alliances
11.1.5.4. Recent Developments
11.1.5.5. Financial Details
11.1.5.6. Others
11.1.6. Mark Anthony Group Inc
11.1.6.1. Business Description
11.1.6.2. Product Portfolio
11.1.6.3. Collaborations & Alliances
11.1.6.4. Recent Developments
11.1.6.5. Financial Details
11.1.6.6. Others
11.1.7. Boston Beer Co Inc
11.1.7.1. Business Description
11.1.7.2. Product Portfolio
11.1.7.3. Collaborations & Alliances
11.1.7.4. Recent Developments
11.1.7.5. Financial Details
11.1.7.6. Others
11.1.8. Diageo Plc
11.1.8.1. Business Description
11.1.8.2. Product Portfolio
11.1.8.3. Collaborations & Alliances
11.1.8.4. Recent Developments
11.1.8.5. Financial Details
11.1.8.6. Others
11.1.9. Blue Ribbon Intermediate Holdings LLC
11.1.9.1. Business Description
11.1.9.2. Product Portfolio
11.1.9.3. Collaborations & Alliances
11.1.9.4. Recent Developments
11.1.9.5. Financial Details
11.1.9.6. Others
11.1.10. Wine Group Inc
11.1.10.1. Business Description
11.1.10.2. Product Portfolio
11.1.10.3. Collaborations & Alliances
11.1.10.4. Recent Developments
11.1.10.5. Financial Details
11.1.10.6. Others
12. Disclaimer
| Segment | Sub-Segment |
|---|---|
| By Type |
|
| By Alcohol Content |
|
| By Flavor |
|
| By Packaging Type |
|
| By Sales Channel |
|
Research Methodology
This study followed a structured approach comprising four key phases to assess the size and scope of the electro-oxidation market. The process began with thorough secondary research to collect data on the target market, related markets, and broader industry context. These findings, along with preliminary assumptions and estimates, were then validated through extensive primary research involving industry experts from across the value chain. To calculate the overall market size, both top-down and bottom-up methodologies were employed. Finally, market segmentation and data triangulation techniques were applied to refine and validate segment-level estimations.
Secondary Research
The secondary research phase involved gathering data from a wide range of credible and published sources. This step helped in identifying industry trends, defining market segmentation, and understanding the market landscape and value chain.
Sources consulted during this phase included:
- Company annual reports, investor presentations, and press releases
- Industry white papers and certified publications
- Trade directories and market-recognized databases
- Articles from authoritative authors and reputable journals
- Gold and silver standard websites
Secondary research was critical in mapping out the industry's value chain and monetary flow, identifying key market segments, understanding regional variations, and tracking significant industry developments.
Other key sources:
- Financial disclosures
- Industry associations and trade bodies
- News outlets and business magazines
- Academic journals and research studies
- Paid industry databases
Primary Research
To validate secondary data and gain deeper market insights, primary research was conducted with key stakeholders across both the supply and demand sides of the market.
On the demand side, participants included decision-makers and influencers from end-user industries—such as CIOs, CTOs, and CSOs—who provided first-hand perspectives on market needs, product usage, and future expectations.
On the supply side, interviews were conducted with manufacturers, industry associations, and institutional participants to gather insights into current offerings, product pipelines, and market challenges.
Primary interviews provided critical inputs such as:
- Market size and revenue data
- Product and service breakdowns
- Market forecasts
- Regional and application-specific trends
Stakeholders consulted included:
- Leading OEM and solution providers
- Channel and distribution partners
- End users across various applications
- Independent consultants and industry specialists
Market Size Estimation and Data Triangulation
- Identifying Key Market Participants (Secondary Research)
- Goal: To identify the major players or companies in the target market. This typically involves using publicly available data sources such as industry reports, market research publications, and financial statements of companies.
- Tools: Reports from firms like Gartner, Forrester, Euromonitor, Statista, IBISWorld, and others. Public financial statements, news articles, and press releases from top market players.
- Extracting Earnings of Key Market Participants
- Goal: To estimate the earnings generated from the product or service being analyzed. This step helps in understanding the revenue potential of each market player in a specific geography.
- Methods: Earnings data can be gathered from:
- Publicly available financial reports (for listed companies).
- Interviews and primary data sources from professionals, such as Directors, VPs, SVPs, etc. This is especially useful for understanding more nuanced, internal data that isn't publicly disclosed.
- Annual reports and investor presentations of key players.
- Data Collation and Development of a Relevant Data Model
- Goal: To collate inputs from both primary and secondary sources into a structured, data-driven model for market estimation. This model will incorporate key market KPIs and any independent variables relevant to the market.
- Key KPIs: These could include:
- Market size, growth rate, and demand drivers.
- Industry-specific metrics like market share, average revenue per customer (ARPC), or average deal size.
- External variables, such as economic growth rates, inflation rates, or commodity prices, that could affect the market.
- Data Modeling: Based on this data, the market forecasts are developed for the next 5 years. A combination of trend analysis, scenario modeling, and statistical regression might be used to generate projections.
- Scenario Analysis
- Goal: To test different assumptions and validate how sensitive the market is to changes in key variables (e.g., market demand, regulatory changes, technological disruptions).
- Types of Scenarios:
- Base Case: Based on current assumptions and historical data.
- Best-Case Scenario: Assuming favorable market conditions, regulatory environments, and technological advancements.
- Worst-Case Scenario: Accounting for adverse factors, such as economic downturns, stricter regulations, or unexpected disruptions.


