Spain Footwear Market Report: Trends, Growth and Forecast (2026-2032)
By Category (Children's Footwear (Infants (0-9 Months) Foot Length (CM) (8.3-8.9, 9.2-9.5, 10.1-10.5), Toddlers (9 Months - 4 Years) Foot Length (CM) (10.8, 11.4-11.7, 12.1-12.7, 13.0-13.3, 14.0-14.3, 14.6-15.2, 15.6-15.9, 16.5), Little Kids (4-7 Years) Foot Length (CM) (16.8, 17.1-17.8, 18.1-18.4, 19.1-19.4, 19.7-20.6, 21.0-21.6), Big Kids (7-12 Years) Foot Length (CM) (21.9, 22.2-23.5, 24.1-24.8)), Women's Footwear (Foot Length (CM) (20.8, 21.3-21.6, 22.2-22.5, 23.0-23.8, 24.1-24.6, 25.1-25.9, 26.2-26.7, 27.6)), Men's Footwear (Foot Length (CM) (23.5, 24.1-24.8, 25.4-25.7, 26.0-26.7, 27.0-27.9, 28.3-28.6, 29.4, 30.2, 31.0-31.8))), By Product Type (Casual, Athletic/Sports, Formal, Others), By Sales Channel (Retail Online, Retail Offline), By Material (Leather, Textile, Rubber, Synthetic, Canvas), By Price (Mass, Premium), By Footwear Type (Shoes (Sneakers, Boots), Sandals & Slippers (Flip-Flops)), By Application (Conventional Footwear (Daily Wear, Work/Office Wear, Outdoor & Adventure, Sports & Fitness, Party/Occasion Wear), Functional/Therapeutic Footwear (Therapeutic/Orthopedic, Medicated Slippers, Acupressure Slippers)) ... Read more
|
Major Players
|
Spain Footwear Market Statistics and Insights, 2026
- Market Size Statistics
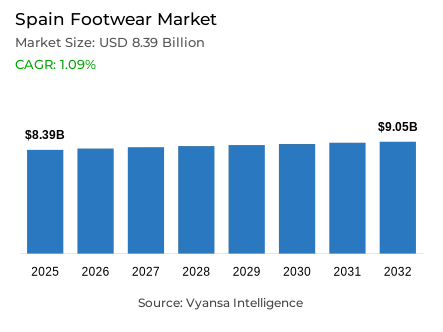
- Footwear market size in Spain was estimated at USD 8.39 billion in 2025.
- The market size is expected to grow to USD 9.05 billion by 2032.
- Market to register a CAGR of around 1.09% during 2026-32.
- Category Shares
- Women's footwear grabbed market share of 54%.
- Competition
- More than 20 companies are actively engaged in producing footwear in Spain.
- Top 5 companies acquired around 25% of the market share.
- Lidl Supermercados SAU, Alcampo SA, Bershka BSK España SA, American Nike SL, Zara España SA etc., are few of the top companies.
- Sales Channel
- Retail offline grabbed 80% of the market.
Spain Footwear Market Outlook
The Spain footwear market is expected to show a stable growth during the forecast period, which will be largely determined by conservative end user spending habits and changing lifestyle priorities. The market is estimated to be USD 8.39 billion in 2025 and is expected to be USD 9.05 billion in 2032, which means that the compound annual growth rate is about 1.09%. Though footwear is expected to increase both in volume and value, the performance of the market will be limited because Spain end user will extend their replacement cycle and reduce discretionary spending due to increased interest rates and strain on disposable income. end user spending is shifting towards experiential consumption rather than material goods, thus restricting rapid market growth.
Women’s footwear is expected to be the leading category, with approximately 54% of the total market value, as casual, athleisure, and leisure-oriented footwear will continue to be in demand. The loosening of dress codes in the workplace and the ongoing popularity of home-based work systems support the need for comfortable and fashionable footwear. Sports and casual shoes that combine fashion and functionality will perform better than formal footwear segments, but children’s footwear will be constrained by structural factors due to decreasing birth rates.
end user behaviour will continue to be influenced by price sensitivity during the forecast period. A significant percentage of end user will switch to own-label and low-cost brands or postpone purchases. Although sustainability factors remain relevant, they will not override price considerations unless eco-friendly products are priced competitively. However, demand for locally made footwear and circular economy models such as repair, resale, and upcycling is expected to grow gradually, especially among younger and more environmentally conscious end user groups.
From a distribution perspective, retail offline will still represent about 80% of footwear sales volume, as Spain end user continue to prefer in-store browsing and fitting experiences. Nevertheless, retail retail online will gain incremental market share due to convenience, free delivery services, and favourable return policies. Overall, the Spain footwear market will remain stable rather than dynamic, shaped by value-seeking behaviour, fashion casualisation, and slow structural change through 2032.

Spain Footwear Market Growth Driver
Economic Pressure Limits Discretionary Footwear Spending
Macroeconomic indicators suggest that softer growth in real household expenditure in Spain is limiting discretionary outlays on non-essential goods, including footwear.The INE Household Budget Survey 2024 showed that average household spending rose by 4.4% in 2024, but most of this growth was driven by necessities, while discretionary purchases of fashion and footwear lagged due to tight household budgets.
At the same time, household savings increased significantly as end user navigated economic uncertainty. In 2024, Spain households raised their gross savings rate to 13.6% of gross disposable income, compared to 12.0% in 2023, indicating higher precautionary behaviour and reduced willingness to spend on discretionary items like new footwear.
Spain Footwear Market Challenge
Cost Sensitivity and High Unemployment Challenge Footwear Demand
The footwear market faces a structural challenge from persistent household cost sensitivity. Spain’s unemployment rate remains a constraint on end user confidence: the Spain Labour Force Survey (EPA) in late 2025 reported an unemployment rate of 9.93%, one of the highest in the European Union, limiting discretionary spending power and extending footwear replacement cycles.
With wage growth remaining below cost-of-living increases, many end user prioritise essential spending. This dynamic reduces footwear purchase frequency and increases trading down to lower-priced products, suppressing overall market volume growth and placing pressure on mid-priced and premium footwear segments.
Unlock Market Intelligence
Explore the market potential with our data-driven report
Spain Footwear Market Trend
Casual and Active Lifestyle Preferences Sustains Athleisure Footwear
The informalisation of dress codes and the growing popularity of active lifestyles continue to support demand for comfortable and sport-inspired footwear. While Spain-specific physical activity data remains limited, the WHO Physical Activity Fact Sheet for Spain 2024 highlights ongoing national public health initiatives aimed at increasing activity levels and reducing sedentary behaviour, indirectly supporting demand for athleisure footwear.
At the European level, the Eurobarometer on Sport and Physical Activity reports that 38% of Europeans exercise at least once a week, a behavioural pattern likely reflected in Spain. This trend sustains consistent demand for sports and lifestyle footwear categories.
Spain Footwear Market Opportunity
Demographic and Sustainability Awareness Presents Premium Positioning Opportunity
Strategic opportunities in Spain footwear market are shaped by demographic ageing and rising environmental awareness. The OECD/European Commission Health at a Glance: Europe 2024 reports that individuals aged 65 and above accounted for over 21% of the population in 2023, supporting long-term demand for comfort-focused and ergonomic footwear.
Simultaneously, sustainability awareness is increasing among Spain end user. While Spain-specific sustainable purchasing statistics remain limited for 2024, EU-wide research highlights growing health- and environment-conscious consumption patterns. These trends can translate into premium sustainable footwear demand, provided pricing aligns with end user expectations.
Unlock Market Intelligence
Explore the market potential with our data-driven report
Spain Footwear Market Segmentation Analysis
By Category
- Children's Footwear
- Infants (0-9 Months) Foot Length (CM)
- 8.3-8.9
- 9.2-9.5
- 10.1-10.5
- Toddlers (9 Months - 4 Years) Foot Length (CM)
- 10.8
- 11.4-11.7
- 12.1-12.7
- 13.0-13.3
- 14.0-14.3
- 14.6-15.2
- 15.6-15.9
- 16.5
- Little Kids (4-7 Years) Foot Length (CM)
- 16.8
- 17.1-17.8
- 18.1-18.4
- 19.1-19.4
- 19.7-20.6
- 21.0-21.6
- Big Kids (7-12 Years) Foot Length (CM)
- 21.9
- 22.2-23.5
- 24.1-24.8
- Infants (0-9 Months) Foot Length (CM)
- Women's Footwear
- Foot Length (CM)
- 20.8
- 21.3-21.6
- 22.2-22.5
- 23.0-23.8
- 24.1-24.6
- 25.1-25.9
- 26.2-26.7
- 27.6
- Foot Length (CM)
- Men's Footwear
- Foot Length (CM)
- 23.5
- 24.1-24.8
- 25.4-25.7
- 26.0-26.7
- 27.0-27.9
- 28.3-28.6
- 29.4
- 30.2
- 31.0-31.8
- Foot Length (CM)
Women’s footwear holds the largest share in the category segmentation, accounting for around 54% of total market value during the forecast period. This reflects sustained demand for versatile footwear suitable for work, leisure, and social occasions. Continued casualisation of dress norms in Spain supports steady demand for trainers, sneakers, and leisure footwear within this segment.
Despite price sensitivity, women’s footwear benefits from higher replacement frequency compared to men’s footwear, reinforcing its leading position. From 2026–32, the segment is expected to remain dominant as brands balance affordability with fashion appeal. Campus sneakers and athleisure footwear will remain major volume drivers, with social media and peer influence continuing to shape purchasing behaviour.

By Sales Channel
- Retail Online
- Retail Offline
Retail offline remains the dominant sales channel, accounting for approximately 80% of total footwear sales in Spain. Physical stores remain central to purchasing decisions, allowing end user to assess fit, comfort, and quality before purchase. Apparel and footwear specialists continue to drive offline sales across price tiers, including private labels and international brands.
During 2026–32, retail offline is expected to maintain leadership despite steady growth in retail online. Economic uncertainty reinforces reliance on in-store promotions, discounts, and seasonal sales. Sports goods retailers are also expanding offline presence, supported by continued end user interest in casual and sports footwear categories.
List of Companies Covered in Spain Footwear Market
The companies listed below are highly influential in the Spain footwear market, with a significant market share and a strong impact on industry developments.
- Lidl Supermercados SAU
- Alcampo SA
- Bershka BSK España SA
- American Nike SL
- Zara España SA
- adidas España SA
- Centros Comerciales Carrefour SA
- Decathlon España SA
- New Balance España SL
- Primark Tiendas SLU
Competitive Landscape
Spain footwear market remains fragmented and highly competitive, shaped by global sportswear brands, fast-fashion players, private labels, and niche local specialists. Nike retained its leadership position in 2024, supported by strong brand recognition and demand for athleisure footwear, although its relatively high prices led to some loss of share. Zara emerged as a strong challenger by offering affordable, trend-driven footwear suited to multiple occasions, appealing to price-conscious consumers. Private labels from retailers such as Carrefour and Lidl gained traction amid trading-down behaviour. Alongside these players, local brands such as Camper, HOFF, and Yuccs strengthened their presence through casual designs and sustainability-led positioning. Competition is increasingly influenced by price sensitivity, casualisation, and selective innovation rather than volume expansion.
Frequently Asked Questions
Related Report
1. Market Segmentation
1.1. Research Scope
1.2. Research Methodology
1.3. Definitions and Assumptions
2. Executive Summary
3. Spain Footwear Market Policies, Regulations, and Standards
4. Spain Footwear Market Dynamics
4.1. Growth Factors
4.2. Challenges
4.3. Trends
4.4. Opportunities
5. Spain Footwear Market Statistics, 2022-2032F
5.1. Market Size & Growth Outlook
5.1.1.By Revenues in USD Million
5.1.2.By Units Sold in Thousand Units
5.2. Market Segmentation & Growth Outlook
5.2.1.By Category
5.2.1.1. Children's Footwear- Market Insights and Forecast 2022-2032, USD Million
5.2.1.1.1. Infants (0-9 Months) Foot Length (CM)- Market Insights and Forecast 2022-2032, USD Million
5.2.1.1.1.1. 8.3-8.9- Market Insights and Forecast 2022-2032, USD Million
5.2.1.1.1.2. 9.2-9.5- Market Insights and Forecast 2022-2032, USD Million
5.2.1.1.1.3. 10.1-10.5- Market Insights and Forecast 2022-2032, USD Million
5.2.1.1.2. Toddlers (9 Months - 4 Years) Foot Length (CM)- Market Insights and Forecast 2022-2032, USD Million
5.2.1.1.2.1. 10.8- Market Insights and Forecast 2022-2032, USD Million
5.2.1.1.2.2. 11.4-11.7- Market Insights and Forecast 2022-2032, USD Million
5.2.1.1.2.3. 12.1-12.7- Market Insights and Forecast 2022-2032, USD Million
5.2.1.1.2.4. 13.0-13.3- Market Insights and Forecast 2022-2032, USD Million
5.2.1.1.2.5. 14.0-14.3- Market Insights and Forecast 2022-2032, USD Million
5.2.1.1.2.6. 14.6-15.2- Market Insights and Forecast 2022-2032, USD Million
5.2.1.1.2.7. 15.6-15.9- Market Insights and Forecast 2022-2032, USD Million
5.2.1.1.2.8. 16.5- Market Insights and Forecast 2022-2032, USD Million
5.2.1.1.3. Little Kids (4-7 Years) Foot Length (CM)- Market Insights and Forecast 2022-2032, USD Million
5.2.1.1.3.1. 16.8- Market Insights and Forecast 2022-2032, USD Million
5.2.1.1.3.2. 17.1-17.8- Market Insights and Forecast 2022-2032, USD Million
5.2.1.1.3.3. 18.1-18.4- Market Insights and Forecast 2022-2032, USD Million
5.2.1.1.3.4. 19.1-19.4- Market Insights and Forecast 2022-2032, USD Million
5.2.1.1.3.5. 19.7-20.6- Market Insights and Forecast 2022-2032, USD Million
5.2.1.1.3.6. 21.0-21.6- Market Insights and Forecast 2022-2032, USD Million
5.2.1.1.4. Big Kids (7-12 Years) Foot Length (CM)- Market Insights and Forecast 2022-2032, USD Million
5.2.1.1.4.1. 21.9- Market Insights and Forecast 2022-2032, USD Million
5.2.1.1.4.2. 22.2-23.5- Market Insights and Forecast 2022-2032, USD Million
5.2.1.1.4.3. 24.1-24.8- Market Insights and Forecast 2022-2032, USD Million
5.2.1.2. Women's Footwear- Market Insights and Forecast 2022-2032, USD Million
5.2.1.2.1. Foot Length (CM)- Market Insights and Forecast 2022-2032, USD Million
5.2.1.2.1.1. 20.8- Market Insights and Forecast 2022-2032, USD Million
5.2.1.2.1.2. 21.3-21.6- Market Insights and Forecast 2022-2032, USD Million
5.2.1.2.1.3. 22.2-22.5- Market Insights and Forecast 2022-2032, USD Million
5.2.1.2.1.4. 23.0-23.8- Market Insights and Forecast 2022-2032, USD Million
5.2.1.2.1.5. 24.1-24.6- Market Insights and Forecast 2022-2032, USD Million
5.2.1.2.1.6. 25.1-25.9- Market Insights and Forecast 2022-2032, USD Million
5.2.1.2.1.7. 26.2-26.7- Market Insights and Forecast 2022-2032, USD Million
5.2.1.2.1.8. 27.6- Market Insights and Forecast 2022-2032, USD Million
5.2.1.3. Men's Footwear- Market Insights and Forecast 2022-2032, USD Million
5.2.1.3.1. Foot Length (CM)- Market Insights and Forecast 2022-2032, USD Million
5.2.1.3.1.1. 23.5- Market Insights and Forecast 2022-2032, USD Million
5.2.1.3.1.2. 24.1-24.8- Market Insights and Forecast 2022-2032, USD Million
5.2.1.3.1.3. 25.4-25.7- Market Insights and Forecast 2022-2032, USD Million
5.2.1.3.1.4. 26.0-26.7- Market Insights and Forecast 2022-2032, USD Million
5.2.1.3.1.5. 27.0-27.9- Market Insights and Forecast 2022-2032, USD Million
5.2.1.3.1.6. 28.3-28.6- Market Insights and Forecast 2022-2032, USD Million
5.2.1.3.1.7. 29.4- Market Insights and Forecast 2022-2032, USD Million
5.2.1.3.1.8. 30.2- Market Insights and Forecast 2022-2032, USD Million
5.2.1.3.1.9. 31.0-31.8- Market Insights and Forecast 2022-2032, USD Million
5.2.2.By Product Type
5.2.2.1. Casual- Market Insights and Forecast 2022-2032, USD Million
5.2.2.2. Athletic/Sports- Market Insights and Forecast 2022-2032, USD Million
5.2.2.3. Formal- Market Insights and Forecast 2022-2032, USD Million
5.2.2.4. Others- Market Insights and Forecast 2022-2032, USD Million
5.2.3.By Sales Channel
5.2.3.1. Retail Online- Market Insights and Forecast 2022-2032, USD Million
5.2.3.2. Retail Offline- Market Insights and Forecast 2022-2032, USD Million
5.2.4.By Material
5.2.4.1. Leather- Market Insights and Forecast 2022-2032, USD Million
5.2.4.2. Textile- Market Insights and Forecast 2022-2032, USD Million
5.2.4.3. Rubber- Market Insights and Forecast 2022-2032, USD Million
5.2.4.4. Synthetic- Market Insights and Forecast 2022-2032, USD Million
5.2.4.5. Canvas- Market Insights and Forecast 2022-2032, USD Million
5.2.5.By Price
5.2.5.1. Mass- Market Insights and Forecast 2022-2032, USD Million
5.2.5.2. Premium- Market Insights and Forecast 2022-2032, USD Million
5.2.6.By Footwear Type
5.2.6.1. Shoes- Market Insights and Forecast 2022-2032, USD Million
5.2.6.1.1. Sneakers- Market Insights and Forecast 2022-2032, USD Million
5.2.6.1.2. Boots- Market Insights and Forecast 2022-2032, USD Million
5.2.6.2. Sandals & Slippers- Market Insights and Forecast 2022-2032, USD Million
5.2.6.2.1. Flip-Flops- Market Insights and Forecast 2022-2032, USD Million
5.2.7.By Application
5.2.7.1. Conventional Footwear- Market Insights and Forecast 2022-2032, USD Million
5.2.7.1.1. Daily Wear- Market Insights and Forecast 2022-2032, USD Million
5.2.7.1.2. Work/Office Wear- Market Insights and Forecast 2022-2032, USD Million
5.2.7.1.3. Outdoor & Adventure- Market Insights and Forecast 2022-2032, USD Million
5.2.7.1.4. Sports & Fitness- Market Insights and Forecast 2022-2032, USD Million
5.2.7.1.5. Party/Occasion Wear- Market Insights and Forecast 2022-2032, USD Million
5.2.7.2. Functional/Therapeutic Footwear- Market Insights and Forecast 2022-2032, USD Million
5.2.7.2.1. Therapeutic/Orthopedic- Market Insights and Forecast 2022-2032, USD Million
5.2.7.2.2. Medicated Slippers- Market Insights and Forecast 2022-2032, USD Million
5.2.7.2.3. Acupressure Slippers- Market Insights and Forecast 2022-2032, USD Million
5.2.8.By Competitors
5.2.8.1. Competition Characteristics
5.2.8.2. Market Share & Analysis
6. Spain Children's Footwear Market Statistics, 2022-2032
6.1. Market Size & Growth Outlook
6.1.1.By Revenues in USD Million
6.1.2.By Units Sold in Thousand Units
6.2. Market Segmentation & Growth Outlook
6.2.1.By Category- Market Insights and Forecast 2022-2032, USD Million
6.2.2.By Product Type- Market Insights and Forecast 2022-2032, USD Million
6.2.3.By Sales Channel- Market Insights and Forecast 2022-2032, USD Million
6.2.4.By Material- Market Insights and Forecast 2022-2032, USD Million
6.2.5.By Price- Market Insights and Forecast 2022-2032, USD Million
6.2.6.By Footwear Type- Market Insights and Forecast 2022-2032, USD Million
6.2.7.By Application- Market Insights and Forecast 2022-2032, USD Million
7. Spain Women's Footwear Market Statistics, 2022-2032
7.1. Market Size & Growth Outlook
7.1.1.By Revenues in USD Million
7.1.2.By Units Sold in Thousand Units
7.2. Market Segmentation & Growth Outlook
7.2.1.By Category- Market Insights and Forecast 2022-2032, USD Million
7.2.2.By Product Type- Market Insights and Forecast 2022-2032, USD Million
7.2.3.By Sales Channel- Market Insights and Forecast 2022-2032, USD Million
7.2.4.By Material- Market Insights and Forecast 2022-2032, USD Million
7.2.5.By Price- Market Insights and Forecast 2022-2032, USD Million
7.2.6.By Footwear Type- Market Insights and Forecast 2022-2032, USD Million
7.2.7.By Application- Market Insights and Forecast 2022-2032, USD Million
8. Spain Men's Footwear Market Statistics, 2022-2032
8.1. Market Size & Growth Outlook
8.1.1.By Revenues in USD Million
8.1.2.By Units Sold in Thousand Units
8.2. Market Segmentation & Growth Outlook
8.2.1.By Category- Market Insights and Forecast 2022-2032, USD Million
8.2.2.By Product Type- Market Insights and Forecast 2022-2032, USD Million
8.2.3.By Sales Channel- Market Insights and Forecast 2022-2032, USD Million
8.2.4.By Material- Market Insights and Forecast 2022-2032, USD Million
8.2.5.By Price- Market Insights and Forecast 2022-2032, USD Million
8.2.6.By Footwear Type- Market Insights and Forecast 2022-2032, USD Million
8.2.7.By Application- Market Insights and Forecast 2022-2032, USD Million
9. Competitive Outlook
9.1. Company Profiles
9.1.1.American Nike SL
9.1.1.1. Business Description
9.1.1.2. Product Portfolio
9.1.1.3. Collaborations & Alliances
9.1.1.4. Recent Developments
9.1.1.5. Financial Details
9.1.1.6. Others
9.1.2.Zara España SA
9.1.2.1. Business Description
9.1.2.2. Product Portfolio
9.1.2.3. Collaborations & Alliances
9.1.2.4. Recent Developments
9.1.2.5. Financial Details
9.1.2.6. Others
9.1.3.adidas España SA
9.1.3.1. Business Description
9.1.3.2. Product Portfolio
9.1.3.3. Collaborations & Alliances
9.1.3.4. Recent Developments
9.1.3.5. Financial Details
9.1.3.6. Others
9.1.4.Centros Comerciales Carrefour SA
9.1.4.1. Business Description
9.1.4.2. Product Portfolio
9.1.4.3. Collaborations & Alliances
9.1.4.4. Recent Developments
9.1.4.5. Financial Details
9.1.4.6. Others
9.1.5.Decathlon España SA
9.1.5.1. Business Description
9.1.5.2. Product Portfolio
9.1.5.3. Collaborations & Alliances
9.1.5.4. Recent Developments
9.1.5.5. Financial Details
9.1.5.6. Others
9.1.6.Lidl Supermercados SAU
9.1.6.1. Business Description
9.1.6.2. Product Portfolio
9.1.6.3. Collaborations & Alliances
9.1.6.4. Recent Developments
9.1.6.5. Financial Details
9.1.6.6. Others
9.1.7.Alcampo SA
9.1.7.1. Business Description
9.1.7.2. Product Portfolio
9.1.7.3. Collaborations & Alliances
9.1.7.4. Recent Developments
9.1.7.5. Financial Details
9.1.7.6. Others
9.1.8.Bershka BSK España SA
9.1.8.1. Business Description
9.1.8.2. Product Portfolio
9.1.8.3. Collaborations & Alliances
9.1.8.4. Recent Developments
9.1.8.5. Financial Details
9.1.8.6. Others
9.1.9.New Balance España SL
9.1.9.1. Business Description
9.1.9.2. Product Portfolio
9.1.9.3. Collaborations & Alliances
9.1.9.4. Recent Developments
9.1.9.5. Financial Details
9.1.9.6. Others
9.1.10. Primark Tiendas SLU
9.1.10.1. Business Description
9.1.10.2. Product Portfolio
9.1.10.3. Collaborations & Alliances
9.1.10.4. Recent Developments
9.1.10.5. Financial Details
9.1.10.6. Others
10. Disclaimer
| Segment | Sub-Segment |
|---|---|
| By Category |
|
| By Product Type |
|
| By Sales Channel |
|
| By Material |
|
| By Price |
|
| By Footwear Type |
|
| By Application |
|
Research Methodology
This study followed a structured approach comprising four key phases to assess the size and scope of the electro-oxidation market. The process began with thorough secondary research to collect data on the target market, related markets, and broader industry context. These findings, along with preliminary assumptions and estimates, were then validated through extensive primary research involving industry experts from across the value chain. To calculate the overall market size, both top-down and bottom-up methodologies were employed. Finally, market segmentation and data triangulation techniques were applied to refine and validate segment-level estimations.
Secondary Research
The secondary research phase involved gathering data from a wide range of credible and published sources. This step helped in identifying industry trends, defining market segmentation, and understanding the market landscape and value chain.
Sources consulted during this phase included:
- Company annual reports, investor presentations, and press releases
- Industry white papers and certified publications
- Trade directories and market-recognized databases
- Articles from authoritative authors and reputable journals
- Gold and silver standard websites
Secondary research was critical in mapping out the industry's value chain and monetary flow, identifying key market segments, understanding regional variations, and tracking significant industry developments.
Other key sources:
- Financial disclosures
- Industry associations and trade bodies
- News outlets and business magazines
- Academic journals and research studies
- Paid industry databases
Primary Research
To validate secondary data and gain deeper market insights, primary research was conducted with key stakeholders across both the supply and demand sides of the market.
On the demand side, participants included decision-makers and influencers from end-user industries—such as CIOs, CTOs, and CSOs—who provided first-hand perspectives on market needs, product usage, and future expectations.
On the supply side, interviews were conducted with manufacturers, industry associations, and institutional participants to gather insights into current offerings, product pipelines, and market challenges.
Primary interviews provided critical inputs such as:
- Market size and revenue data
- Product and service breakdowns
- Market forecasts
- Regional and application-specific trends
Stakeholders consulted included:
- Leading OEM and solution providers
- Channel and distribution partners
- End users across various applications
- Independent consultants and industry specialists
Market Size Estimation and Data Triangulation
- Identifying Key Market Participants (Secondary Research)
- Goal: To identify the major players or companies in the target market. This typically involves using publicly available data sources such as industry reports, market research publications, and financial statements of companies.
- Tools: Reports from firms like Gartner, Forrester, Euromonitor, Statista, IBISWorld, and others. Public financial statements, news articles, and press releases from top market players.
- Extracting Earnings of Key Market Participants
- Goal: To estimate the earnings generated from the product or service being analyzed. This step helps in understanding the revenue potential of each market player in a specific geography.
- Methods: Earnings data can be gathered from:
- Publicly available financial reports (for listed companies).
- Interviews and primary data sources from professionals, such as Directors, VPs, SVPs, etc. This is especially useful for understanding more nuanced, internal data that isn't publicly disclosed.
- Annual reports and investor presentations of key players.
- Data Collation and Development of a Relevant Data Model
- Goal: To collate inputs from both primary and secondary sources into a structured, data-driven model for market estimation. This model will incorporate key market KPIs and any independent variables relevant to the market.
- Key KPIs: These could include:
- Market size, growth rate, and demand drivers.
- Industry-specific metrics like market share, average revenue per customer (ARPC), or average deal size.
- External variables, such as economic growth rates, inflation rates, or commodity prices, that could affect the market.
- Data Modeling: Based on this data, the market forecasts are developed for the next 5 years. A combination of trend analysis, scenario modeling, and statistical regression might be used to generate projections.
- Scenario Analysis
- Goal: To test different assumptions and validate how sensitive the market is to changes in key variables (e.g., market demand, regulatory changes, technological disruptions).
- Types of Scenarios:
- Base Case: Based on current assumptions and historical data.
- Best-Case Scenario: Assuming favorable market conditions, regulatory environments, and technological advancements.
- Worst-Case Scenario: Accounting for adverse factors, such as economic downturns, stricter regulations, or unexpected disruptions.


