Southeast Asia Ride Gear Market Report: Trends, Growth and Forecast (2026-2032)
By Product Type (Helmets (Protective Clothing, Jackets, Pants, Riding Suits, Base Layers & Rainwear), Gloves, Footwear, Body Armor/Protective Pads (Knee Guards, Elbow Guards, Back Protectors, Chest Protectors), Riding Accessories (Riding Goggles, Neck Braces, Hydration Packs)), By Material (Leather, Textile, Synthetic Materials, Carbon Fiber, Mesh, Composite Materials), By Distribution Channel (Retail Online, Retail Offline (Specialty Stores, Multi-brand Retail Stores, OEM/Authorized Dealers)), By Vehicle Type (Motorcycle, Scooter, ATV/Dirt Bike), By Riding Application (Daily Commuting, Touring/Long-Distance Riding, Racing/Track Riding, Adventure Riding, Off-Road/Motocross, Recreational Riding), By Price Range (Economy, Mid-Range, Premium), By Gender (Men, Women, Unisex), By Country (Philippines, Singapore, Indonesia, Malaysia, Thailand, Vietnam, Rest of Southeast Asia) ... Read more
|
Major Players
|
Southeast Asia Ride Gear Market Statistics and Insights, 2026
- Market Size Statistics
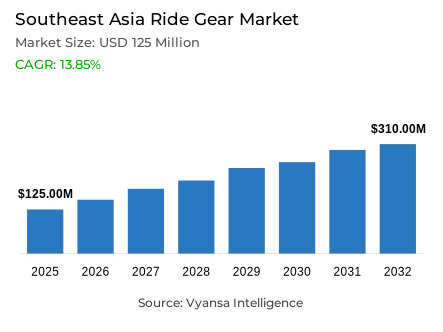
- Ride gear market size in Southeast Asia was valued at USD 125 million in 2025 and is estimated at USD 150.15 million in 2026.
- The market size is expected to grow to USD 310 million by 2032.
- Market to register a CAGR of around 13.85% during 2026-32.
- Product Type Shares
- Helmets grabbed market share of 45%.
- Competition
- More than 15 companies are actively engaged in producing ride gear in Southeast Asia.
- Top 5 companies acquired around 20% of the market share.
- Shoei, AGV, Bell, Alpinestars, Dainese etc., are few of the top companies.
- Vehicle Type
- Motorcycle grabbed 80% of the market.
- Country
- Indonesia emerges as the leading market.
Southeast Asia Ride Gear Market Outlook
The Southeast Asia Ride Gear Market was valued at USD 125 million in 2025 and is projected to grow from USD 150.15 million in 2026 to USD 310 million by 2032, reflecting a CAGR of 13.85% during the forecast period. This strong growth is fuelled by the fact that the region depends heavily on two-wheelers to commute, logistics, and move around. The high rate of urbanisation and heavy traffic in cities expose riders to road hazards, and the use of protective equipment is slowly becoming a necessity rather than a luxury item in the growing economies of Southeast Asia.
Safety awareness and enforcement remain the primary catalysts for purchase behaviour, with helmets accounting for approximately 45% of total market share. Governments are enhancing helmet compliance regulations to enhance road safety results. As an illustration, the National Police of Thailand in their Safe Roads Project mandates the use of helmets by both riders and passengers with fines of up to 2000 baht imposed in case of violation and tougher enforcement beginning on 1 June 2025. In Vietnam, joint initiatives between the Vietnam Association of Motorcycle Manufacturers (VAMM), the Ministry of Education and Training (MOET) and the National Traffic Safety Committee (NTSC) have educated millions of riders on the importance of certified helmets as safety gear.
Motorcycles dominate the vehicle landscape, accounting for around 80% of ride‑gear demand. Motorcycles are still the most common mode of transport in commuting and short distance travel in most of the Southeast Asian nations. This causes the replacement of helmets and simple protective equipment to be replaced frequently because of wear, accidents and daily use. There is also a growing trend of riders moving away to low-quality or fake products to certified protective gear that has superior safety performance and longevity.
In the region, Indonesia stands out as the most promising market because of its very huge two-wheeler fleet. According to the data provided by the Indonesian National Police, which is registered by the Badan Pusat Statistik (BPS), there were 139,450,013 motorcycles in 2024, which is one of the most significant groups of riders in the world. This size can accommodate first-time buyers as well as high frequency replacement of helmets and other protective gears. With the increase in enforcement campaigns and safety awareness, the market will grow steadily in Southeast Asia, and certified and affordable ride gear will become an increasingly important factor in preventing road-traffic injuries.

Southeast Asia Ride Gear Market Growth DriverTwo-Wheeler Dominance Maintains Core Ride Gear Demand
Two-wheelers continue to be the main form of personal transportation in much of Southeast Asia, which provides a significant and consistent demand base of ride gear. Indonesia demonstrates the magnitude of this mobility ecosystem. Badan Pusat Statistik (BPS) according to the statistics of the Indonesian National Police, the country had 139,450,013 motorcycles in 2024, which proves the enormous amount of daily riders who need helmets and other protective equipment.
The same is the case with Vietnam. According to the Vietnam National Traffic Safety Committee (NTSC), in 2023, there are about 74 million motorcycles and mopeds in service, and 52 million motorcycle driving licences have been issued. As the number of people in cities grows and the intensity of mobility increases, motorcycles continue to be the most popular mode of transport in commuting and traveling over short distances. This high reliance guarantees continued demand of helmets and other necessary protective gear via replacement and compliance-based upgrades.
Southeast Asia Ride Gear Market ChallengeLapses in Safety Compliance and Low-quality Gear
Although the number of riders is high, the ride-gear market in Southeast Asia is still faced with a significant challenge of inconsistent safety compliance. The data on road safety indicates the magnitude of the problem. According to the Department of Disease Control (DDC) of Thailand, there were 17 477 road traffic deaths in 2024, with 14 144 of them being motorcycle-related, and the average number of road traffic deaths was 17 428 per year between 2020 and 2024.
The burden of accidents is also depicted through healthcare data. In 2022, Thailand’s Health Data Center recorded 1 060 566 people receiving medical treatment for road accidents, with estimated healthcare costs of 7 827 980 864 baht annually, approximately 80% of which were linked to motorcycle accidents. Safety compliance remains inconsistent, as the DDC also reports that 84% of hospitalised motorcyclists between 2020 and 2024 were not wearing helmets, and riders without helmets experienced head injuries eight times more frequently than those wearing helmets.
Unlock Market Intelligence
Explore the market potential with our data-driven report
Southeast Asia Ride Gear Market TrendImplementation and Rider Education is More Organized
Governments in Southeast Asia are stepping up enforcement and education to enhance helmet compliance. In Thailand, the National Police “Safe Roads Project” focuses on roads with high accident rates and areas near schools, requiring 100% helmet compliance for riders and passengers. The penalties may be fines up to 2000 baht, and the punishment is twice in case the passenger is not wearing a helmet. These measures were enforced strictly starting in June 2025.
Education programmes also contribute significantly towards safer riding. In Vietnam, the National Traffic Safety Committee reports that helmet‑wearing rates reach 90% among adults and 80% among children when travelling by motorcycle. VAMM, MOET, and NTSC have organized training activities that have educated about 13 million learners on road safety since 2014, and Honda has conducted rider training programmes that have reached about 17 million people each year since 2019 to 2023. These programs strengthen the use of helmets as a safety measure.
Southeast Asia Ride Gear Market OpportunityCertified and Child-Fit Protective Gea
The seriousness of motorcycle injuries underscores the importance of certified protective equipment. The statistics provided by the Department of Disease Control in Thailand indicate that riders who are not wearing helmets are eight times more likely to sustain head injuries compared to those who wear them. This fact reinforces the argument of certified helmets and other protective equipment that should be used to enhance the safety of the riders.
The under-served user groups, especially children, also have a lot of growth potential. In Vietnam, helmet usage among adults reaches 90%, while usage among children is lower at around 80% when travelling by motorcycle. This loophole gives the manufacturers a chance to launch child-specific helmets, educational programmes, and school-based safety programs that encourage correct fit and use. Affordable, comfortable, and tested safety standards are thus brands that can grow in the large rider base in Southeast Asia.
Southeast Asia Ride Gear Market Country Analysis
By Country
- Philippines
- Singapore
- Indonesia
- Malaysia
- Thailand
- Vietnam
- Rest of Southeast Asia
Indonesia is the biggest national market of ride gear in Southeast Asia with its huge two-wheeler fleet. The country has a population of 139 450 013 motorcycles in 2024, which is the number of riders, as indicated by Badan Pusat Statistik. This huge following ensures a consistent demand of helmets and protective equipment both in the first time buyers and in the replacement cycle.
The role of protective gear is also supported by road safety statistics. In 2024, there were 150, 906 road accidents in Indonesia, which led to 26,839 deaths, 16,601 serious injuries, and 183,995 minor injuries. These statistics underscore the fact that riders are still exposed to traffic hazards and the importance of certified protective equipment. With the increasing safety awareness and the tightening of the enforcement, Indonesia will likely continue to be the demand center of ride gear in Southeast Asia.
Unlock Market Intelligence
Explore the market potential with our data-driven report
Southeast Asia Ride Gear Market Segmentation Analysis
By Product Type
- Helmets
- Protective Clothing
- Jackets
- Pants
- Riding Suits
- Base Layers & Rainwear
- Gloves
- Footwear
- Body Armor/Protective Pads
- Knee Guards
- Elbow Guards
- Back Protectors
- Chest Protectors
- Riding Accessories
- Riding Goggles
- Neck Braces
- Hydration Packs
The segment with highest market share under Product Type is Helmets, accounting for approximately 45% of total demand based on the provided segmentation data. This dominance is an indication of the central position of helmets in the safety of riders and the high priority given to helmet use in the road safety laws of the region.
Demand of helmets is also reinforced by enforcement campaigns. The Safe Roads Project in Thailand involves the use of helmets by the riders and passengers, and fines are given in case of non-compliance. Consumer attention to certified products is also supported by safety data, with studies conducted by the Thailand Department of Disease Control showing that helmet use can greatly decrease the risk of serious head injuries. Simultaneously, the issue of fake or low-quality helmets in the market, like in Vietnam, underscores the significance of certification labels and reliable retail outlets.

By Vehicle Type
- Motorcycle
- Scooter
- ATV/Dirt Bike
Motorcycles dominate the vehicle segment in Southeast Asia’s ride gear market, accounting for around 80% of total demand according to the provided data. This dominance is a sign of the high two-wheeler ecosystem in the region, where motorcycles are the main mode of transport in commuting, deliveries, and short-distance transportation.
This ecosystem is especially large in Indonesia and Vietnam. In 2024, Indonesia registered 13, 450, 013 motorcycles and in 2023, Vietnam registered 74 million motorcycles and mopeds. The high numbers of riders generate a steady demand of protective equipment both in new and replacement. The statistics on road safety also support the significance of protective equipment, as motorcycle accidents are one of the leading causes of traffic-related injuries in the area.
Various Market Players in Southeast Asia Ride Gear Market
The companies mentioned below are highly active in the Southeast Asia ride gear market, occupying a considerable portion of the market and shaping industry progress.
Market News & Updates
- Shoei Co., 2026:
Shoei expanded its premium helmet lineup in 2026 with new color options and rider-replica models under its flagship X-Fifteen racing helmet series. The update includes multiple professional rider editions and additional color variants scheduled for release through 2026, strengthening Shoei’s high-performance helmet portfolio widely distributed through official dealers across Southeast Asia, where premium motorcycle safety gear demand continues to rise.
- Ltd, 2025:
LS2 introduced its New Collection 25–26 featuring an expanded portfolio of motorcycle helmets, riding jackets, boots, and protective gear designed for both commuting and performance riding. The new lineup reinforces LS2’s strategy to offer a full ecosystem of mid-range protective equipment, strengthening its presence in Southeast Asia where demand for affordable yet certified riding gear continues to grow.
Frequently Asked Questions
Related Report
- Market Segmentation
- Research Scope
- Research Methodology
- Definitions and Assumptions
- Executive Summary
- Southeast Asia Ride Gear Market Policies, Regulations, and Standards
- Southeast Asia Ride Gear Market Dynamics
- Growth Factors
- Challenges
- Trends
- Opportunities
- Southeast Asia Ride Gear Market Statistics, 2022-2032F
- Market Size & Growth Outlook
- By Revenues in USD Million
- Market Segmentation & Growth Outlook
- By Product Type
- Helmets- Market Insights and Forecast 2022-2032, USD Million
- Protective Clothing- Market Insights and Forecast 2022-2032, USD Million
- Jackets- Market Insights and Forecast 2022-2032, USD Million
- Pants- Market Insights and Forecast 2022-2032, USD Million
- Riding Suits- Market Insights and Forecast 2022-2032, USD Million
- Base Layers & Rainwear- Market Insights and Forecast 2022-2032, USD Million
- Gloves- Market Insights and Forecast 2022-2032, USD Million
- Footwear- Market Insights and Forecast 2022-2032, USD Million
- Body Armor/Protective Pads- Market Insights and Forecast 2022-2032, USD Million
- Knee Guards- Market Insights and Forecast 2022-2032, USD Million
- Elbow Guards- Market Insights and Forecast 2022-2032, USD Million
- Back Protectors- Market Insights and Forecast 2022-2032, USD Million
- Chest Protectors- Market Insights and Forecast 2022-2032, USD Million
- Riding Accessories- Market Insights and Forecast 2022-2032, USD Million
- Riding Goggles- Market Insights and Forecast 2022-2032, USD Million
- Neck Braces- Market Insights and Forecast 2022-2032, USD Million
- Hydration Packs- Market Insights and Forecast 2022-2032, USD Million
- Helmets- Market Insights and Forecast 2022-2032, USD Million
- By Material
- Leather- Market Insights and Forecast 2022-2032, USD Million
- Textile- Market Insights and Forecast 2022-2032, USD Million
- Synthetic Materials- Market Insights and Forecast 2022-2032, USD Million
- Carbon Fiber- Market Insights and Forecast 2022-2032, USD Million
- Mesh- Market Insights and Forecast 2022-2032, USD Million
- Composite Materials- Market Insights and Forecast 2022-2032, USD Million
- By Distribution Channel
- Retail Online- Market Insights and Forecast 2022-2032, USD Million
- Retail Offline- Market Insights and Forecast 2022-2032, USD Million
- Specialty Stores- Market Insights and Forecast 2022-2032, USD Million
- Multi-brand Retail Stores- Market Insights and Forecast 2022-2032, USD Million
- OEM/Authorized Dealers- Market Insights and Forecast 2022-2032, USD Million
- By Vehicle Type
- Motorcycle- Market Insights and Forecast 2022-2032, USD Million
- Scooter- Market Insights and Forecast 2022-2032, USD Million
- ATV/Dirt Bike- Market Insights and Forecast 2022-2032, USD Million
- By Riding Application
- Daily Commuting- Market Insights and Forecast 2022-2032, USD Million
- Touring/Long-Distance Riding- Market Insights and Forecast 2022-2032, USD Million
- Racing/Track Riding- Market Insights and Forecast 2022-2032, USD Million
- Adventure Riding- Market Insights and Forecast 2022-2032, USD Million
- Off-Road/Motocross- Market Insights and Forecast 2022-2032, USD Million
- Recreational Riding- Market Insights and Forecast 2022-2032, USD Million
- By Price Range
- Economy- Market Insights and Forecast 2022-2032, USD Million
- Mid-Range- Market Insights and Forecast 2022-2032, USD Million
- Premium- Market Insights and Forecast 2022-2032, USD Million
- By Gender
- Men- Market Insights and Forecast 2022-2032, USD Million
- Women- Market Insights and Forecast 2022-2032, USD Million
- Unisex- Market Insights and Forecast 2022-2032, USD Million
- By Country
- Philippines
- Singapore
- Indonesia
- Malaysia
- Thailand
- Vietnam
- Rest of Southeast Asia
- By Competitors
- Competition Characteristics
- Market Share & Analysis
- By Product Type
- Market Size & Growth Outlook
- Philippines Ride Gear Market Statistics, 2022-2032F
- Market Size & Growth Outlook
- By Revenues in USD Million
- Market Segmentation & Growth Outlook
- By Product Type- Market Insights and Forecast 2022-2032, USD Million
- By Material- Market Insights and Forecast 2022-2032, USD Million
- By Distribution Channel- Market Insights and Forecast 2022-2032, USD Million
- By Vehicle Type- Market Insights and Forecast 2022-2032, USD Million
- By Riding Application- Market Insights and Forecast 2022-2032, USD Million
- By Price Range- Market Insights and Forecast 2022-2032, USD Million
- By Gender- Market Insights and Forecast 2022-2032, USD Million
- Market Size & Growth Outlook
- Singapore Ride Gear Market Statistics, 2022-2032F
- Market Size & Growth Outlook
- By Revenues in USD Million
- Market Segmentation & Growth Outlook
- By Product Type- Market Insights and Forecast 2022-2032, USD Million
- By Material- Market Insights and Forecast 2022-2032, USD Million
- By Distribution Channel- Market Insights and Forecast 2022-2032, USD Million
- By Vehicle Type- Market Insights and Forecast 2022-2032, USD Million
- By Riding Application- Market Insights and Forecast 2022-2032, USD Million
- By Price Range- Market Insights and Forecast 2022-2032, USD Million
- By Gender- Market Insights and Forecast 2022-2032, USD Million
- Market Size & Growth Outlook
- Indonesia Ride Gear Market Statistics, 2022-2032F
- Market Size & Growth Outlook
- By Revenues in USD Million
- Market Segmentation & Growth Outlook
- By Product Type- Market Insights and Forecast 2022-2032, USD Million
- By Material- Market Insights and Forecast 2022-2032, USD Million
- By Distribution Channel- Market Insights and Forecast 2022-2032, USD Million
- By Vehicle Type- Market Insights and Forecast 2022-2032, USD Million
- By Riding Application- Market Insights and Forecast 2022-2032, USD Million
- By Price Range- Market Insights and Forecast 2022-2032, USD Million
- By Gender- Market Insights and Forecast 2022-2032, USD Million
- Market Size & Growth Outlook
- Malaysia Ride Gear Market Statistics, 2022-2032F
- Market Size & Growth Outlook
- By Revenues in USD Million
- Market Segmentation & Growth Outlook
- By Product Type- Market Insights and Forecast 2022-2032, USD Million
- By Material- Market Insights and Forecast 2022-2032, USD Million
- By Distribution Channel- Market Insights and Forecast 2022-2032, USD Million
- By Vehicle Type- Market Insights and Forecast 2022-2032, USD Million
- By Riding Application- Market Insights and Forecast 2022-2032, USD Million
- By Price Range- Market Insights and Forecast 2022-2032, USD Million
- By Gender- Market Insights and Forecast 2022-2032, USD Million
- Market Size & Growth Outlook
- Thailand Ride Gear Market Statistics, 2022-2032F
- Market Size & Growth Outlook
- By Revenues in USD Million
- Market Segmentation & Growth Outlook
- By Product Type- Market Insights and Forecast 2022-2032, USD Million
- By Material- Market Insights and Forecast 2022-2032, USD Million
- By Distribution Channel- Market Insights and Forecast 2022-2032, USD Million
- By Vehicle Type- Market Insights and Forecast 2022-2032, USD Million
- By Riding Application- Market Insights and Forecast 2022-2032, USD Million
- By Price Range- Market Insights and Forecast 2022-2032, USD Million
- By Gender- Market Insights and Forecast 2022-2032, USD Million
- Market Size & Growth Outlook
- Vietnam Ride Gear Market Statistics, 2022-2032F
- Market Size & Growth Outlook
- By Revenues in USD Million
- Market Segmentation & Growth Outlook
- By Product Type- Market Insights and Forecast 2022-2032, USD Million
- By Material- Market Insights and Forecast 2022-2032, USD Million
- By Distribution Channel- Market Insights and Forecast 2022-2032, USD Million
- By Vehicle Type- Market Insights and Forecast 2022-2032, USD Million
- By Riding Application- Market Insights and Forecast 2022-2032, USD Million
- By Price Range- Market Insights and Forecast 2022-2032, USD Million
- By Gender- Market Insights and Forecast 2022-2032, USD Million
- Market Size & Growth Outlook
- Competitive Outlook
- Company Profiles
- Alpinestars
- Business Description
- Product Portfolio
- Collaborations & Alliances
- Recent Developments
- Financial Details
- Others
- Dainese
- Business Description
- Product Portfolio
- Collaborations & Alliances
- Recent Developments
- Financial Details
- Others
- REV IT!
- Business Description
- Product Portfolio
- Collaborations & Alliances
- Recent Developments
- Financial Details
- Others
- HJC Helmets
- Business Description
- Product Portfolio
- Collaborations & Alliances
- Recent Developments
- Financial Details
- Others
- Arai Helmet
- Business Description
- Product Portfolio
- Collaborations & Alliances
- Recent Developments
- Financial Details
- Others
- Shoei
- Business Description
- Product Portfolio
- Collaborations & Alliances
- Recent Developments
- Financial Details
- Others
- AGV
- Business Description
- Product Portfolio
- Collaborations & Alliances
- Recent Developments
- Financial Details
- Others
- Bell
- Business Description
- Product Portfolio
- Collaborations & Alliances
- Recent Developments
- Financial Details
- Others
- LS2
- Business Description
- Product Portfolio
- Collaborations & Alliances
- Recent Developments
- Financial Details
- Others
- RS Taichi
- Business Description
- Product Portfolio
- Collaborations & Alliances
- Recent Developments
- Financial Details
- Others
- Komine
- Business Description
- Product Portfolio
- Collaborations & Alliances
- Recent Developments
- Financial Details
- Others
- ScorpionEXO
- Business Description
- Product Portfolio
- Collaborations & Alliances
- Recent Developments
- Financial Details
- Others
- RST
- Business Description
- Product Portfolio
- Collaborations & Alliances
- Recent Developments
- Financial Details
- Others
- TCX
- Business Description
- Product Portfolio
- Collaborations & Alliances
- Recent Developments
- Financial Details
- Others
- Forma
- Business Description
- Product Portfolio
- Collaborations & Alliances
- Recent Developments
- Financial Details
- Others
- Alpinestars
- Company Profiles
- Disclaimer
| Segment | Sub-Segment |
|---|---|
| By Product Type |
|
| By Material |
|
| By Distribution Channel |
|
| By Vehicle Type |
|
| By Riding Application |
|
| By Price Range |
|
| By Gender |
|
| By Country |
|
Research Methodology
This study followed a structured approach comprising four key phases to assess the size and scope of the electro-oxidation market. The process began with thorough secondary research to collect data on the target market, related markets, and broader industry context. These findings, along with preliminary assumptions and estimates, were then validated through extensive primary research involving industry experts from across the value chain. To calculate the overall market size, both top-down and bottom-up methodologies were employed. Finally, market segmentation and data triangulation techniques were applied to refine and validate segment-level estimations.
Secondary Research
The secondary research phase involved gathering data from a wide range of credible and published sources. This step helped in identifying industry trends, defining market segmentation, and understanding the market landscape and value chain.
Sources consulted during this phase included:
- Company annual reports, investor presentations, and press releases
- Industry white papers and certified publications
- Trade directories and market-recognized databases
- Articles from authoritative authors and reputable journals
- Gold and silver standard websites
Secondary research was critical in mapping out the industry's value chain and monetary flow, identifying key market segments, understanding regional variations, and tracking significant industry developments.
Other key sources:
- Financial disclosures
- Industry associations and trade bodies
- News outlets and business magazines
- Academic journals and research studies
- Paid industry databases
Primary Research
To validate secondary data and gain deeper market insights, primary research was conducted with key stakeholders across both the supply and demand sides of the market.
On the demand side, participants included decision-makers and influencers from end-user industries—such as CIOs, CTOs, and CSOs—who provided first-hand perspectives on market needs, product usage, and future expectations.
On the supply side, interviews were conducted with manufacturers, industry associations, and institutional participants to gather insights into current offerings, product pipelines, and market challenges.
Primary interviews provided critical inputs such as:
- Market size and revenue data
- Product and service breakdowns
- Market forecasts
- Regional and application-specific trends
Stakeholders consulted included:
- Leading OEM and solution providers
- Channel and distribution partners
- End users across various applications
- Independent consultants and industry specialists
Market Size Estimation and Data Triangulation
- Identifying Key Market Participants (Secondary Research)
- Goal: To identify the major players or companies in the target market. This typically involves using publicly available data sources such as industry reports, market research publications, and financial statements of companies.
- Tools: Reports from firms like Gartner, Forrester, Euromonitor, Statista, IBISWorld, and others. Public financial statements, news articles, and press releases from top market players.
- Extracting Earnings of Key Market Participants
- Goal: To estimate the earnings generated from the product or service being analyzed. This step helps in understanding the revenue potential of each market player in a specific geography.
- Methods: Earnings data can be gathered from:
- Publicly available financial reports (for listed companies).
- Interviews and primary data sources from professionals, such as Directors, VPs, SVPs, etc. This is especially useful for understanding more nuanced, internal data that isn't publicly disclosed.
- Annual reports and investor presentations of key players.
- Data Collation and Development of a Relevant Data Model
- Goal: To collate inputs from both primary and secondary sources into a structured, data-driven model for market estimation. This model will incorporate key market KPIs and any independent variables relevant to the market.
- Key KPIs: These could include:
- Market size, growth rate, and demand drivers.
- Industry-specific metrics like market share, average revenue per customer (ARPC), or average deal size.
- External variables, such as economic growth rates, inflation rates, or commodity prices, that could affect the market.
- Data Modeling: Based on this data, the market forecasts are developed for the next 5 years. A combination of trend analysis, scenario modeling, and statistical regression might be used to generate projections.
- Scenario Analysis
- Goal: To test different assumptions and validate how sensitive the market is to changes in key variables (e.g., market demand, regulatory changes, technological disruptions).
- Types of Scenarios:
- Base Case: Based on current assumptions and historical data.
- Best-Case Scenario: Assuming favorable market conditions, regulatory environments, and technological advancements.
- Worst-Case Scenario: Accounting for adverse factors, such as economic downturns, stricter regulations, or unexpected disruptions.


