South Africa Fire Pump Market Report: Trends, Growth and Forecast (2026-2032)
By Pump Type (Centrifugal Pumps (Overhung Pumps, Vertical Inline, Horizontal End Suction), Split Case Pumps (Single/Two Stage, Multi Stage)), Positive Displacement Pumps (Diaphragm Pumps, Piston Pumps), By Mode of Operation (Diesel Fire Pump, Electric Fire Pump, Others), By End-User (Residential, Commercial, Industrial) ... Read more
|
Major Players
|
South Africa Fire Pump Market Statistics and Insights, 2026
- Market Size Statistics
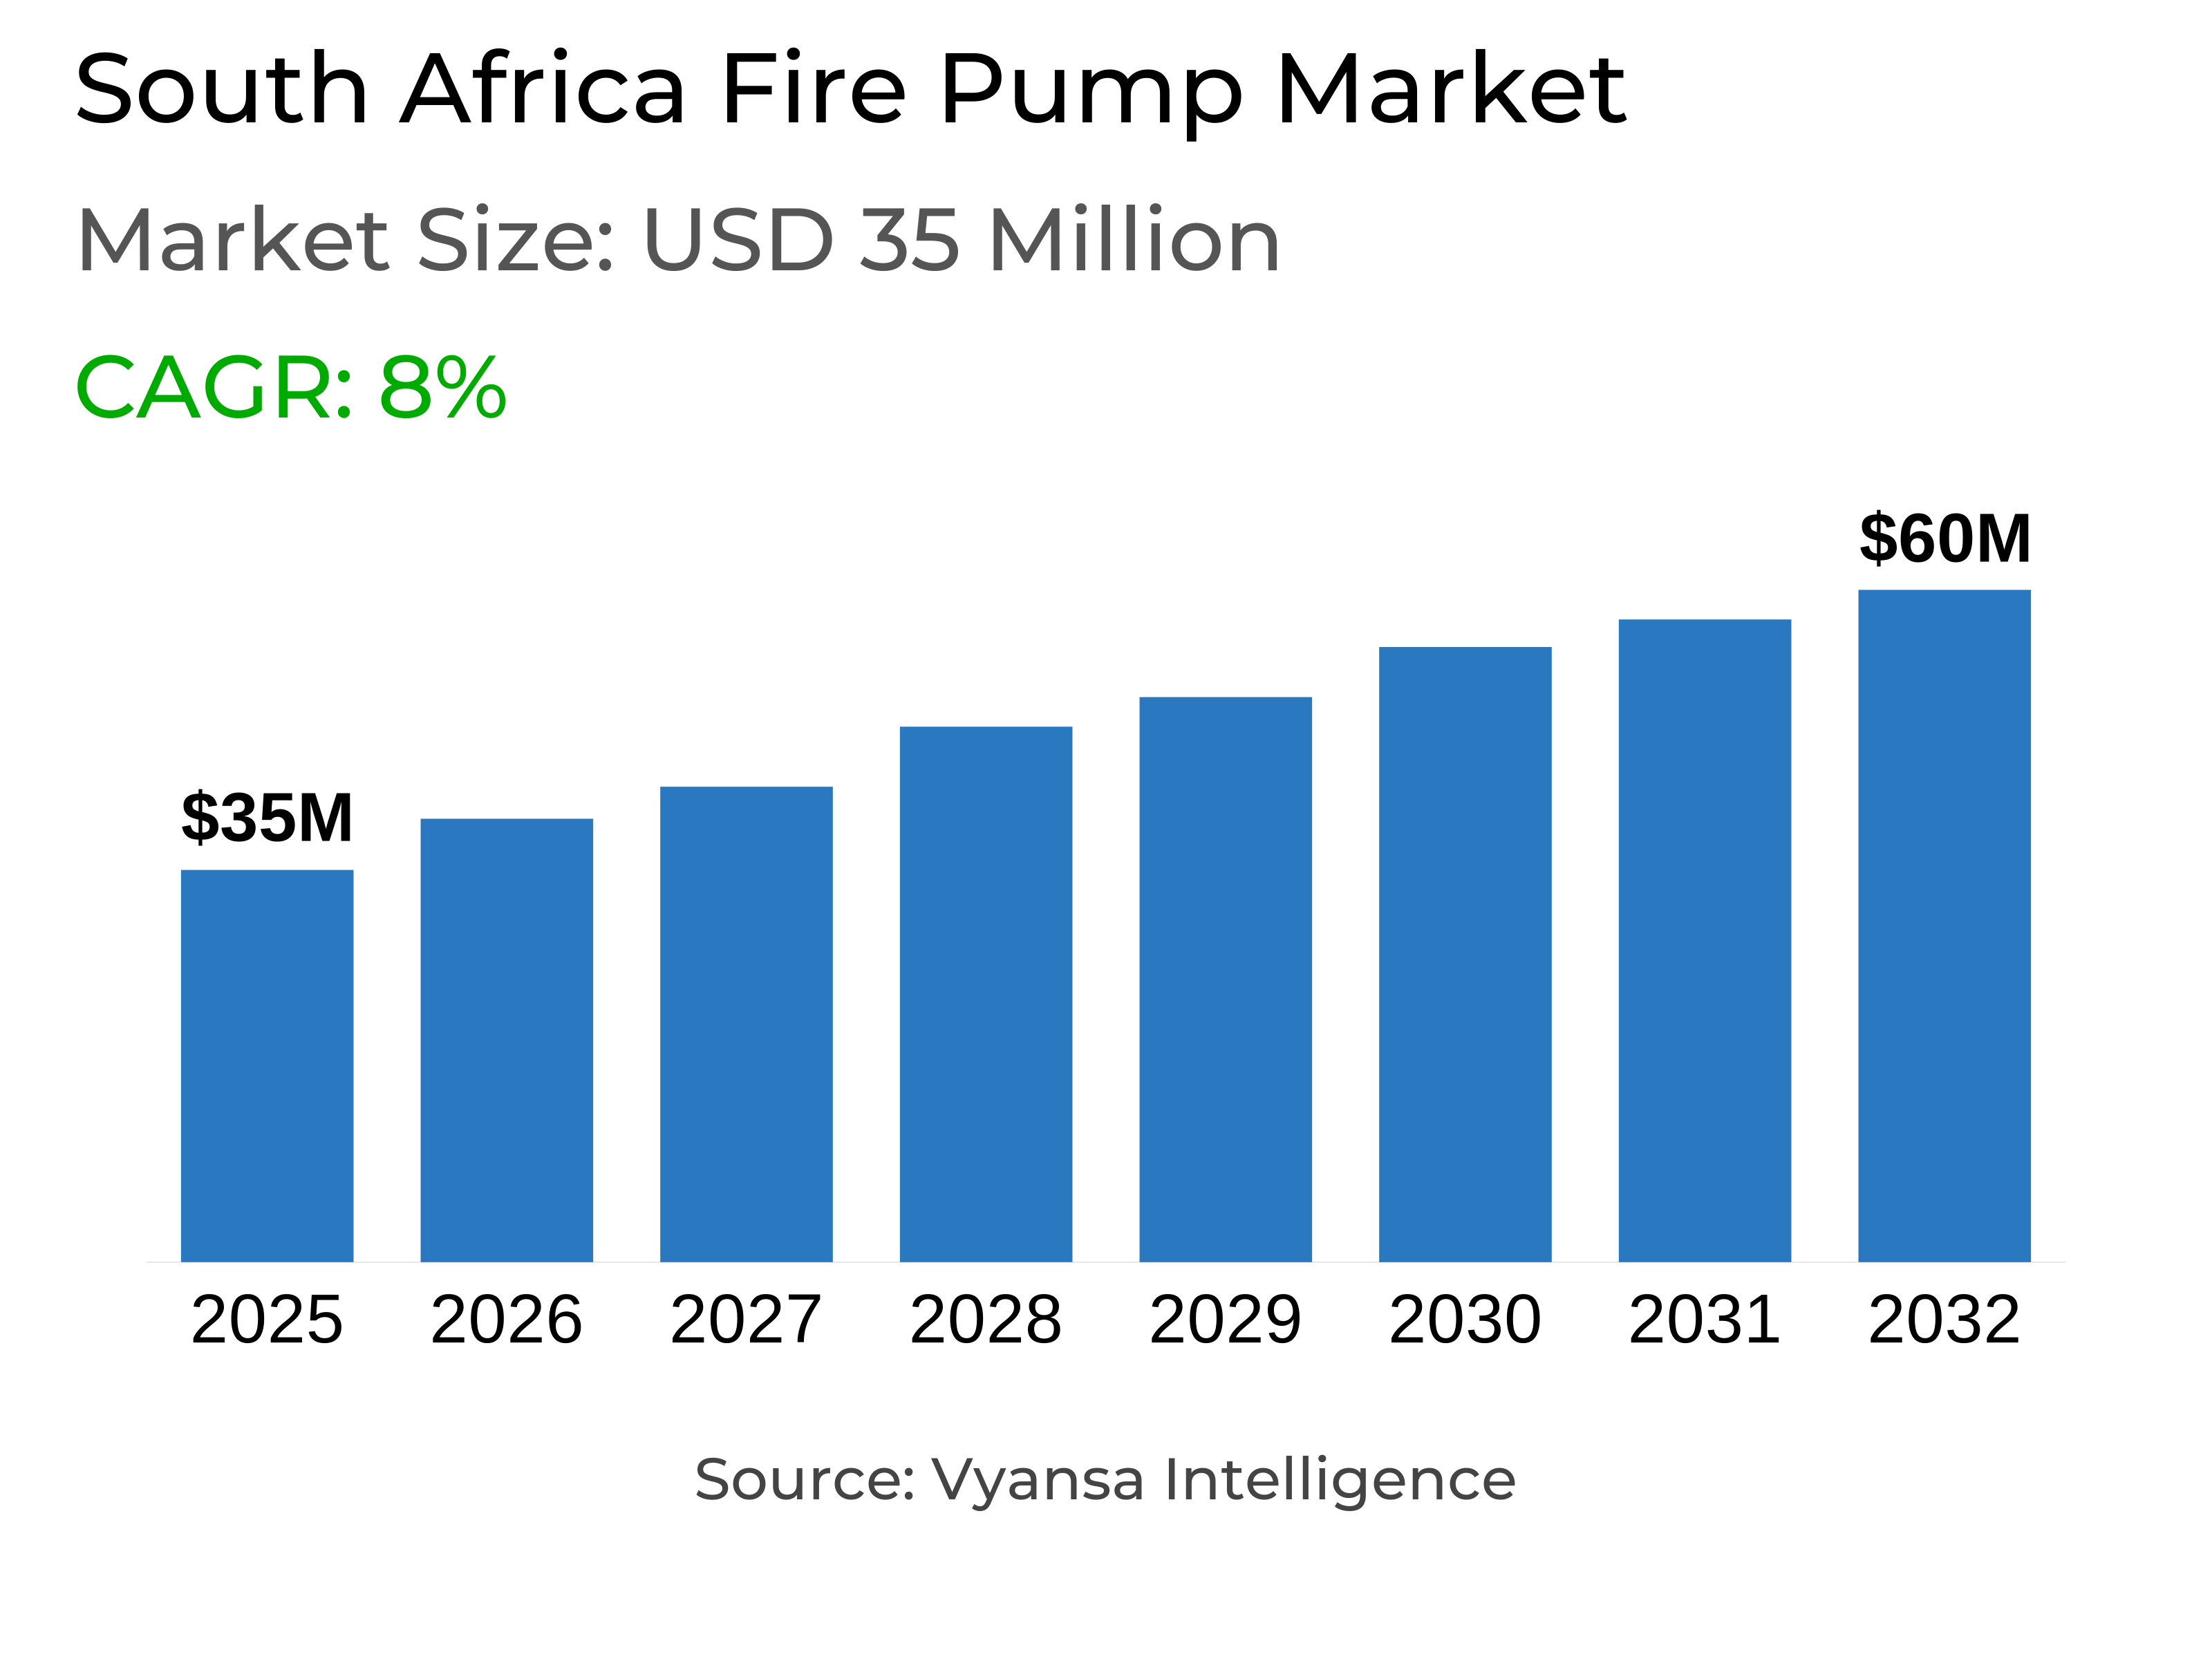
- Fire Pump in South Africa is estimated at $ 35 Million.
- The market size is expected to grow to $ 60 Million by 2032.
- Market to register a CAGR of around 8% during 2026-32.
- Pump Type Segment
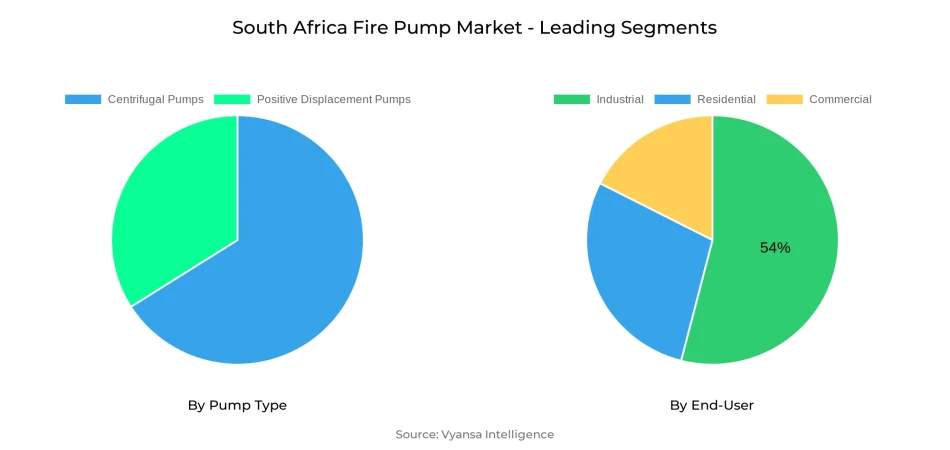
- Centrifugal Pumps continues to dominate the market.
- Competition
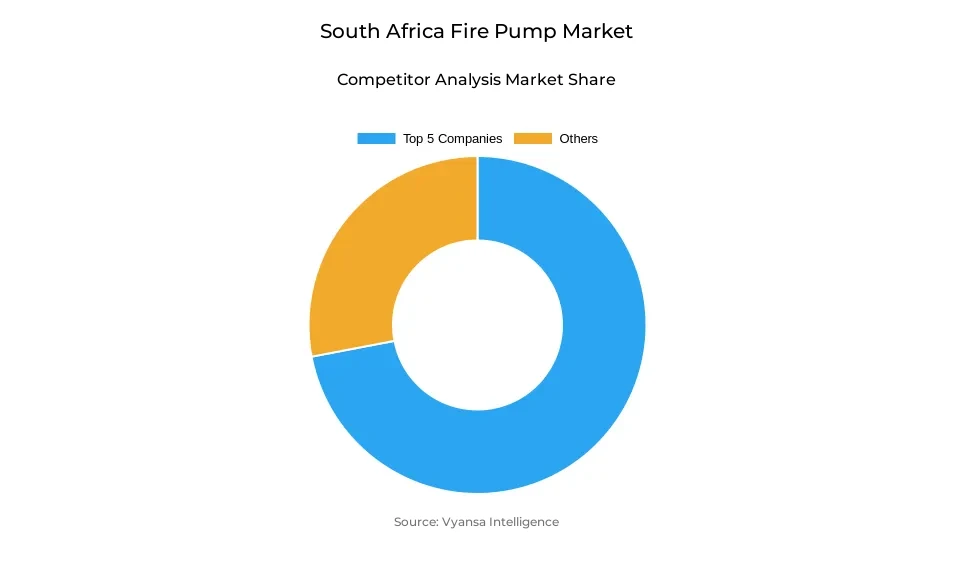
- More than 10 companies are actively engaged in producing Fire Pump in South Africa.
- Top 5 companies acquired the maximum share of the market.
- WILO SE, Ebara Corporation, ITT Goulds Pumps, Flowserve Corporation, Pentair PLC etc., are few of the top companies.
- End-User
- Industrial grabbed 54% of the market.
South Africa Fire Pump Market Outlook
The South Africa Fire Pump Market is picking up pace, driven by stringent regulations and growing infrastructure projects. Worth around $35 million in 2025, the market is expected to grow to nearly $60 million by 2032 at a CAGR of approximately 8% over 2026–32. Laws like the National Building Regulations Act, SANS 10400-T, and the Occupational Health and Safety Act require fire protection systems throughout residential, commercial, and industrial use, with automatic sprinklers being necessary in buildings above 30 meters high and large basements. These requirements generate robust and reliable demand for compliant fire pump solutions.
Despite prospects for growth, the sector is challenged by high equipment prices and dependence on imports. The cost of construction material rose by 1.8% between January and April 2025, while approvals for building plans fell 9.9% during the same time. Financial pressures also pushed hundreds of companies into shutdown, stifling spending on fire protection. Furthermore, water losses as high as 42% through leaks and depreciating infrastructure influence system efficiency, putting additional pressure on the reliability of fire protection.
On the opportunity side, government spending of ZAR 2.6 trillion in the current fiscal year underpins an expected 3.5% annual construction growth from 2026–29, driving adoption of advanced systems. The mining industry, employing more than 484,000 people, and the manufacturing sector, which grew 1.9% in June 2025, further highlight the urgent need for strong safety measures. Sophisticated and automatic fire protection technologies and increasing urbanization are also increasing the installation of advanced fire pump systems.
Of pump types, centrifugal pumps have the highest market share because of their effectiveness and low maintenance, making them most suitable for bulk deals. By end-user, the industrial segment dominates the market with 54% share and is also the fastest-growing, underpinned by stringent compliance mandates and stringent safety requirements in mining, manufacturing, and energy facilities. This mix of regulatory enforcement, infrastructure development, and industrial expansion continues to underpin the prospects for steady fire pump uptake in South Africa.
South Africa Fire Pump Market Growth Driver
Regulatory Mandates Strengthen Fire Safety Implementation
South Africa has a strict regulatory structure that encourages uniform adoption of sophisticated fire protection systems. The National Building Regulations and Building Standards Act No. 103 of 1977, coupled with SANS 10400-T, dictates precise standards for fire safety in residential, commercial, and industrial buildings. The Occupational Health and Safety Act of 1993 further tightens workplace compliance, requiring fire protection systems in various industries. These regulations mandate automatic sprinklers in structures more than 30 meters high and in basements with over 500 square meters of space, generating universal demand for compliant products.
Industrial growth also boosts market growth, as manufacturing production increased 1.9% in June of 2025 following recent drops. Mining jobs totaled 484,006 as of September of 2024, a record high, and highlighting the necessity of stringent safety precautions. SANS 10287 lays down rigorous instructions for sprinkler system design and upkeep to ensure fire pump installations adhere to international standards while protecting extensive industrial assets.
South Africa Fire Pump Market Challenge
Rising Costs and Import Reliance Challenge Market Growth
High equipment prices and dependence on imports are still major challenges for the South Africa Fire Pump Market. Prices of construction materials increased 1.8% year-on-year from January through April 2025, whereas approvals of building plans decreased by 9.9% during the same period. Small and medium businesses are especially under pressure as installation of sophisticated detection and suppression technologies grows too expensive. This escalation in costs frustrates consistent uptake of state-of-the-art fire safety infrastructure, especially in the private sector of constructions.
Import dependencies accelerate pricing pressures as global supply chain disruption and tariff effects drive up equipment costs. The building sector fell 0.5% in 2025, showing declining investment confidence. Liquidity pressures drove 109 companies into liquidation in April alone, 482 overall for the year, and stifling fire safety investment. Additionally, 37–42% of water supplied through pipes is lost to leaks and old infrastructure, reducing operational effectiveness of fire suppression systems and posing further challenges to dependable fire pump operation.
Unlock Market Intelligence
Explore the market potential with our data-driven report
South Africa Fire Pump Market Trend
Technology Integration Shapes Advanced Safety Systems
Smart and automated fire protection technologies are changing safety infrastructure at lightning speed in South Africa. Smart monitoring platforms, wireless alarm systems, and sensor networks are going mainstream, particularly in high-density commercial and industrial developments. Government expenditure of ZAR 2.6 trillion in the fiscal year underpins projected 3.5% per annum building growth between 2026–2029, underpinning the growth of advanced fire pump systems. Such a shift is additionally supported by the national aspiration to realize 42% renewable energy penetration by 2030, driving technology-facilitated solutions in the energy sector.
Urbanization plays a leading role in contemporary fire system demand, with 66.4% of the population already inhabiting urban areas and increasing at a rate of almost 2% per year. New technology like water mist and aspirating smoke detection systems is improving safety standards, especially in warehouses subject to SANS 10139 regulations. The renewable energy segment, which is anticipated to grow to 32 GW by 2030, holds potential for niche fire safety equipment, such as fire pumps specifically designed for solar and wind energy facilities with special operational hazards.
South Africa Fire Pump Market Opportunity
Expanding Infrastructure Unlocks Market Opportunities
The development of large-scale infrastructure is establishing good opportunities for suppliers of fire safety equipment. Government initiatives like the Independent Transmission Projects Programme will bring more than 14,000 km of new transmission lines and 53 GW of power generation capacity through the next decade. Construction permits worth ZAR 7.5 billion indicate continued building activity in spite of economic pressures, yet another guarantee of the need for effective fire suppression systems. This pipeline of development demands extensive deployment of fire pumps to utilities, transportation, and energy installations.
Industrial operations bring in an additional dimension of scope. The mining industry's workforce peaked at 484,006 individuals in September 2024, needing holistic safety interventions on high-risk sites. Renewable energy capacity was 18.41 GW in 2025 and is set to increase to 31.10 GW by 2030, further widening the demand for specialized fire protection infrastructure. R23 billion water infrastructure investments between 2020–2025 mitigate shortages of resources while complementarily underpinning fire suppression capacity within industries, which opens up demand for fire pumps optimized for sophisticated operating environments.
Unlock Market Intelligence
Explore the market potential with our data-driven report
South Africa Fire Pump Market Segmentation Analysis
By Pump Type
- Centrifugal Pumps
- Positive Displacement Pumps
The centrifugal pump segment has the highest market share under pump type categorization owing to its efficiency and flexibility. They provide a uniform pressure and water supply, and as such, are well suited for extensive industrial and commercial use where dependability is paramount. They are accepted everywhere due to simplicity in operation and maintenance, hence lowering downtime and system reliability in fire protection networks.
This leadership role is a testament to their core positioning in the support of South Africa's industrial and infrastructure growth. From manufacturing facilities to tower commercial buildings, centrifugal pumps are still the go-to due to established reliability and capability of handling rigorous applications. Their performance effectiveness continues to cement their market share, reinforcing their value as the backbone of fire protection system installations in the nation.
By End-User
- Residential
- Commercial
- Industrial
The Industrial segment is the largest contributor to the South Africa Fire Pump Market, with 54% of overall demand. Sophisticated manufacturing processes, high-value plant, and safety-critical operations dictate robust adoption of integrated fire protection systems in industrial complexes. The segment also experiences the highest growth rate, growing at a CAGR of 10.11%, as regulatory compliance and infrastructure development projects trigger additional investment in advanced safety solutions.
Manufacturing and mining sectors are instrumental in fuelling this momentum. Mining itself accounts for more than 484,000 jobs, necessitating expansive safety systems in risky operational areas. Likewise, manufacturing growth rose 1.9% in June 2025, indicating a bounceback and furthering fire protection requirements. SANS 10287 requires automatic sprinkler compliance within industrial sites, especially plants and warehouses, fuelling steady usage of specialist fire pumps that protect assets and workforce safety within at-risk environments.
Top Companies in South Africa Fire Pump Market
The top companies operating in the market include WILO SE, Ebara Corporation, ITT Goulds Pumps, Flowserve Corporation, Pentair PLC, Sulzer Limited, Grundfos Holding A/S, KSB SE & Co. KGaA, Patterson (Gorman Rupp), Armstrong, etc., are the top players operating in the South Africa Fire Pump Market.
Frequently Asked Questions
Related Report
1. Market Segmentation
1.1. Research Scope
1.2. Research Methodology
1.3. Definitions and Assumptions
2. Executive Summary
3. South Africa Fire Pump Market Policies, Regulations, and Standards
4. South Africa Fire Pump Market Dynamics
4.1. Growth Factors
4.2. Challenges
4.3. Trends
4.4. Opportunities
5. South Africa Fire Pump Market Statistics, 2022-2032F
5.1. Market Size & Growth Outlook
5.1.1.By Revenues in US$ Million
5.2. Market Segmentation & Growth Outlook
5.2.1.By Pump Type
5.2.1.1. Centrifugal Pumps- Market Insights and Forecast 2022-2032, USD Million
5.2.1.1.1.1. Overhung Pumps- Market Insights and Forecast 2022-2032, USD Million
5.2.1.1.1.2. Vertical Inline- Market Insights and Forecast 2022-2032, USD Million
5.2.1.1.1.3. Horizontal End Suction- Market Insights and Forecast 2022-2032, USD Million
5.2.1.1.2. Split Case Pumps- Market Insights and Forecast 2022-2032, USD Million
5.2.1.1.2.1. Single/Two Stage- Market Insights and Forecast 2022-2032, USD Million
5.2.1.1.2.2. Multi Stage- Market Insights and Forecast 2022-2032, USD Million
5.2.1.2. Positive Displacement Pumps- Market Insights and Forecast 2022-2032, USD Million
5.2.1.2.1. Diaphragm Pumps- Market Insights and Forecast 2022-2032, USD Million
5.2.1.2.2. Piston Pumps - Market Insights and Forecast 2022-2032, USD Million
5.2.2.By Mode of Operation
5.2.2.1. Diesel Fire Pump- Market Insights and Forecast 2022-2032, USD Million
5.2.2.2. Electric Fire Pump- Market Insights and Forecast 2022-2032, USD Million
5.2.2.3. Others- Market Insights and Forecast 2022-2032, USD Million
5.2.3.By End-User
5.2.3.1. Residential- Market Insights and Forecast 2022-2032, USD Million
5.2.3.2. Commercial- Market Insights and Forecast 2022-2032, USD Million
5.2.3.3. Industrial- Market Insights and Forecast 2022-2032, USD Million
5.2.4.By Competitors
5.2.4.1. Competition Characteristics
5.2.4.2. Market Share & Analysis
6. South Africa Centrifugal Fire Pump Market Statistics, 2020-2030F
6.1. Market Size & Growth Outlook
6.1.1.By Revenues in US$ Million
6.2. Market Segmentation & Growth Outlook
6.2.1.By Pump Type- Market Insights and Forecast 2022-2032, USD Million
6.2.2.By Mode of Operation- Market Insights and Forecast 2022-2032, USD Million
6.2.3.By End-User- Market Insights and Forecast 2022-2032, USD Million
7. South Africa Positive Displacement Fire Pump Market Statistics, 2020-2030F
7.1. Market Size & Growth Outlook
7.1.1.By Revenues in US$ Million
7.2. Market Segmentation & Growth Outlook
7.2.1.By Pump Type- Market Insights and Forecast 2022-2032, USD Million
7.2.2.By Mode of Operation- Market Insights and Forecast 2022-2032, USD Million
7.2.3.By End-User- Market Insights and Forecast 2022-2032, USD Million
8. Competitive Outlook
8.1. Company Profiles
8.1.1.Flowserve Corporation
8.1.1.1. Business Description
8.1.1.2. Product Portfolio
8.1.1.3. Collaborations & Alliances
8.1.1.4. Recent Developments
8.1.1.5. Financial Details
8.1.1.6. Others
8.1.2.Pentair PLC
8.1.2.1. Business Description
8.1.2.2. Product Portfolio
8.1.2.3. Collaborations & Alliances
8.1.2.4. Recent Developments
8.1.2.5. Financial Details
8.1.2.6. Others
8.1.3.Sulzer Limited
8.1.3.1. Business Description
8.1.3.2. Product Portfolio
8.1.3.3. Collaborations & Alliances
8.1.3.4. Recent Developments
8.1.3.5. Financial Details
8.1.3.6. Others
8.1.4.Grundfos Holding A/S
8.1.4.1. Business Description
8.1.4.2. Product Portfolio
8.1.4.3. Collaborations & Alliances
8.1.4.4. Recent Developments
8.1.4.5. Financial Details
8.1.4.6. Others
8.1.5.KSB SE & Co. KGaA
8.1.5.1. Business Description
8.1.5.2. Product Portfolio
8.1.5.3. Collaborations & Alliances
8.1.5.4. Recent Developments
8.1.5.5. Financial Details
8.1.5.6. Others
8.1.6.WILO SE
8.1.6.1. Business Description
8.1.6.2. Product Portfolio
8.1.6.3. Collaborations & Alliances
8.1.6.4. Recent Developments
8.1.6.5. Financial Details
8.1.6.6. Others
8.1.7.Ebara Corporation
8.1.7.1. Business Description
8.1.7.2. Product Portfolio
8.1.7.3. Collaborations & Alliances
8.1.7.4. Recent Developments
8.1.7.5. Financial Details
8.1.7.6. Others
8.1.8.ITT Goulds Pumps
8.1.8.1. Business Description
8.1.8.2. Product Portfolio
8.1.8.3. Collaborations & Alliances
8.1.8.4. Recent Developments
8.1.8.5. Financial Details
8.1.8.6. Others
8.1.9.Patterson (Gorman Rupp)
8.1.9.1. Business Description
8.1.9.2. Product Portfolio
8.1.9.3. Collaborations & Alliances
8.1.9.4. Recent Developments
8.1.9.5. Financial Details
8.1.9.6. Others
8.1.10. Armstrong
8.1.10.1. Business Description
8.1.10.2. Product Portfolio
8.1.10.3. Collaborations & Alliances
8.1.10.4. Recent Developments
8.1.10.5. Financial Details
8.1.10.6. Others
9. Disclaimer
| Segment | Sub-Segment |
|---|---|
| By Pump Type |
|
| By Mode of Operation |
|
| By End-User |
|
Research Methodology
This study followed a structured approach comprising four key phases to assess the size and scope of the electro-oxidation market. The process began with thorough secondary research to collect data on the target market, related markets, and broader industry context. These findings, along with preliminary assumptions and estimates, were then validated through extensive primary research involving industry experts from across the value chain. To calculate the overall market size, both top-down and bottom-up methodologies were employed. Finally, market segmentation and data triangulation techniques were applied to refine and validate segment-level estimations.
Secondary Research
The secondary research phase involved gathering data from a wide range of credible and published sources. This step helped in identifying industry trends, defining market segmentation, and understanding the market landscape and value chain.
Sources consulted during this phase included:
- Company annual reports, investor presentations, and press releases
- Industry white papers and certified publications
- Trade directories and market-recognized databases
- Articles from authoritative authors and reputable journals
- Gold and silver standard websites
Secondary research was critical in mapping out the industry's value chain and monetary flow, identifying key market segments, understanding regional variations, and tracking significant industry developments.
Other key sources:
- Financial disclosures
- Industry associations and trade bodies
- News outlets and business magazines
- Academic journals and research studies
- Paid industry databases
Primary Research
To validate secondary data and gain deeper market insights, primary research was conducted with key stakeholders across both the supply and demand sides of the market.
On the demand side, participants included decision-makers and influencers from end-user industries—such as CIOs, CTOs, and CSOs—who provided first-hand perspectives on market needs, product usage, and future expectations.
On the supply side, interviews were conducted with manufacturers, industry associations, and institutional participants to gather insights into current offerings, product pipelines, and market challenges.
Primary interviews provided critical inputs such as:
- Market size and revenue data
- Product and service breakdowns
- Market forecasts
- Regional and application-specific trends
Stakeholders consulted included:
- Leading OEM and solution providers
- Channel and distribution partners
- End users across various applications
- Independent consultants and industry specialists
Market Size Estimation and Data Triangulation
- Identifying Key Market Participants (Secondary Research)
- Goal: To identify the major players or companies in the target market. This typically involves using publicly available data sources such as industry reports, market research publications, and financial statements of companies.
- Tools: Reports from firms like Gartner, Forrester, Euromonitor, Statista, IBISWorld, and others. Public financial statements, news articles, and press releases from top market players.
- Extracting Earnings of Key Market Participants
- Goal: To estimate the earnings generated from the product or service being analyzed. This step helps in understanding the revenue potential of each market player in a specific geography.
- Methods: Earnings data can be gathered from:
- Publicly available financial reports (for listed companies).
- Interviews and primary data sources from professionals, such as Directors, VPs, SVPs, etc. This is especially useful for understanding more nuanced, internal data that isn't publicly disclosed.
- Annual reports and investor presentations of key players.
- Data Collation and Development of a Relevant Data Model
- Goal: To collate inputs from both primary and secondary sources into a structured, data-driven model for market estimation. This model will incorporate key market KPIs and any independent variables relevant to the market.
- Key KPIs: These could include:
- Market size, growth rate, and demand drivers.
- Industry-specific metrics like market share, average revenue per customer (ARPC), or average deal size.
- External variables, such as economic growth rates, inflation rates, or commodity prices, that could affect the market.
- Data Modeling: Based on this data, the market forecasts are developed for the next 5 years. A combination of trend analysis, scenario modeling, and statistical regression might be used to generate projections.
- Scenario Analysis
- Goal: To test different assumptions and validate how sensitive the market is to changes in key variables (e.g., market demand, regulatory changes, technological disruptions).
- Types of Scenarios:
- Base Case: Based on current assumptions and historical data.
- Best-Case Scenario: Assuming favorable market conditions, regulatory environments, and technological advancements.
- Worst-Case Scenario: Accounting for adverse factors, such as economic downturns, stricter regulations, or unexpected disruptions.


