Global Polysorbate 80 Market Report: Trends, Growth and Forecast (2026-2032)
By Product Form (Liquid Polysorbate 80, Concentrated Polysorbate 80, Diluted Polysorbate 80), By Functional Role (Emulsifier, Solubilizer, Wetting Agent, Dispersing Agent, Stabilizer, Surfactant), By End User (Food & Beverage, Personal Care, Pharmaceuticals, Others), By Sales Channel (Retail Online (E-Commerce Marketplaces, Company-Owned Websites, B2B Chemical Marketplaces, Online Specialty Ingredient Platforms, E-Procurement Portals), Retail Offline (Direct Sales, Specialty Chemical Distributors, Food Ingredient Distributors, Pharmaceutical Excipient Distributors, Cosmetic Ingredient Distributors, Regional Chemical Suppliers)), By Region (North America, South America, Europe, Middle East & Africa, Asia Pacific) ... Read more
|
Major Players
|
Global Polysorbate 80 Market Statistics and Insights, 2026
- Market Size Statistics
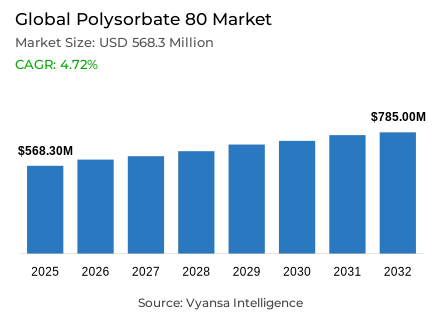
- Polysorbate 80 market size in Global was valued at USD 568.3 million in 2025 and is estimated at USD 614.4 million in 2026.
- The market size is expected to grow to USD 785 million by 2032.
- Market to register a CAGR of around 4.72% during 2026-32.
- Product Form Shares
- Liquid polysorbate 80 grabbed market share of 70%.
- Competition
- More than 30 companies are actively engaged in producing polysorbate 80.
- Top 5 companies acquired around 50% of the market share.
- NOF Corporation, Seppic, Oleon NV, BASF SE, Croda International Plc etc., are few of the top companies.
- End User
- Food & beverage grabbed 40% of the market.
- Region
- Asia Pacific leads with a 35% share of the global market.
Global Polysorbate 80 Market Outlook
The Global Polysorbate 80 Market was valued at USD 568.3 million in 2025 and is projected to grow from USD 614.4 million in 2026 to USD 785 million by 2032, registering a CAGR of 4.72% across the forecast period. This stable expansion reflects the continued and broad-based relevance of the global Polysorbate 80 market across pharmaceutical, food, and industrial formulation environments where consistency, dispersion quality, and product stability remain essential to manufacturing performance and end-use acceptance throughout the value chain.
At the product grade level, Pharmaceutical Grade accounts for 35% of the overall market, holding the leading position within the grade segment. Regulated and high-purity applications continue to exert strong commercial demand, with pharmaceutical Polysorbate 80 demand being sustained by excipient qualification requirements, solubility support needs, and the formulation consistency standards that directly influence production outcomes across injectable, oral, and biologic drug categories globally.
End-user demand is anchored equally by the Food and Beverage segment, which commands 40% of the total market, reflecting the widespread deployment of emulsification and texture stabilization systems across large-scale food processing operations. Food-grade Polysorbate 80 applications remain commercially durable because manufacturers require ingredients that deliver stable processing behavior and dependable formulation performance across repeated high-volume production cycles without compromising output quality.
Regionally, Asia Pacific leads the global market with a 35% share, reinforcing its position as the most commercially influential geography in the current industry landscape. Stronger manufacturing depth, broader food processing activity, and rising formulation demand across Asia Pacific are sustaining this leadership, and the Polysorbate 80 market outlook through 2032 points to continued strengthening of the ingredient's role in formulation stability, process control, and long-term industrial ingredient demand across the global supply chain.

Global Polysorbate 80 Market Growth Driver
Pharmaceutical Approvals Expand the Excipient Demand Base
Regulated drug formulation activity is generating consistent and structurally expanding demand for high-purity excipient systems across global pharmaceutical manufacturing environments. As per data published by the United States Food and Drug Administration, the Center for Drug Evaluation and Research approved 46 novel drugs in 2025, while according to statistics released by the European Medicines Agency, 104 medicines were recommended for marketing authorization in the same year including 38 with a new active substance. Each additional injectable, oral, or biologic formulation approved creates excipient qualification, validation, and commercial batch demand that directly expands the addressable base for Polysorbate 80 in pharmaceuticals across regulated manufacturing settings.
Vaccine and biologic formulation patterns are reinforcing this demand with a recurring unit-level consumption mechanism. Based on data from the World Health Organization product information database, the vaccine BIMERVAX contains 1.18 mg of Polysorbate 80 per dose, confirming that growth in approved therapies generates not only development-stage excipient demand but also sustained commercial production offtake. This conversion of formulation pipeline expansion into repeated batch purchasing cycles supports stable and predictable long-run demand for Polysorbate 80 excipient applications across the global pharmaceutical supply base.
Global Polysorbate 80 Market Challenge
Feedstock Volatility Compresses Producer Margins
Raw material price instability is creating a persistent and structurally significant cost management challenge for Polysorbate 80 producers globally. As indicated by authoritative sources at the World Bank, coconut oil rose from USD 1,519 per metric ton in 2024 to USD 2,480 in 2025, palm oil increased from USD 963 to USD 1,007, and soybean oil moved from USD 1,022 to USD 1,140 over the same period. These input cost increases are compressing producer margins and raising Polysorbate 80 pricing trends volatility in environments where price pass-through to downstream buyers is constrained by long-term supply contracts and competitive market dynamics.
The cost pressure is not receding as market conditions evolve. Evidence drawn from public data released by the World Bank confirms that coconut oil stood at USD 2,360 per metric ton in the first quarter of 2026, palm oil at USD 1,103, and soybean oil at USD 1,482, indicating that feedstock exposure remains an active operational concern rather than a transitional disruption. This environment is reinforcing the competitive advantage of Polysorbate 80 manufacturers with stronger sourcing discipline, hedging capability, and premium-grade positioning, while simultaneously raising entry barriers for smaller producers with limited raw material supply chain resilience.
Unlock Market Intelligence
Explore the market potential with our data-driven report
Global Polysorbate 80 Market Trend
Regulatory Harmonization Elevates Specification Standards
A structured shift toward tighter additive review and more rigorous global specification alignment is actively reshaping procurement behavior across food and pharmaceutical ingredient markets. Insights sourced from official databases at the World Health Organization confirm that the 100th Joint FAO-WHO Expert Committee on Food Additives meeting held in June 2025 evaluated eight food additives and one processing aid while revising specifications for one food additive and six processing aids. This more demanding specification environment is increasing the commercial value of well-documented, compliance-ready Polysorbate 80 supply chain analysis capabilities as ingredient buyers place growing weight on regulatory alignment in sourcing decisions.
Multilateral food governance frameworks are reinforcing this trend at the international standards level. As per data published by the World Health Organization, the Codex Alimentarius Commission comprises 188 Member Countries, one Member Organization, and 242 Observer Organizations, with the 48th Codex session in November 2025 incorporating updates to the General Standard for Food Additives. This widening harmonization of additive standards is improving cross-border acceptability for compliant suppliers and strengthening the long-run commercial positioning of producers with robust Polysorbate 80 food ingredient demand documentation and traceable quality management systems.
Global Polysorbate 80 Market Opportunity
Biologics and Vaccine Scale-Up Deepen Excipient Demand
The global expansion of biologics pipelines and large-scale immunization programs is creating a commercially significant and structurally durable opportunity for validated excipient systems within the Polysorbate 80 industry. According to statistics released by the World Health Organization, the 2026 Full Vaccine Product List includes more than 1,000 vaccine products available for procurement as of December 2025, expanding the potential formulation base for multifunctional stabilization and dispersion excipients well beyond conventional small-molecule drug applications. This scale creates a wider high-value demand pool that directly supports more specialized and volume-intensive purchasing requirements for Polysorbate 80 in pharmaceuticals manufacturing environments globally.
Immunization volume data reinforces the structural depth of this opportunity at the production cycle level. Data compiled from internationally recognized public authorities at the World Health Organization and UNICEF confirms that 89% of infants globally, representing approximately 115 million children, received at least one DTP-containing vaccine dose in 2024, with 85% completing all three doses. The translation of these immunization volumes into repeated large-scale production cycles creates a sustained and predictable long-run demand engine for pharmaceutical excipient distributors Polysorbate 80, as high-dose vaccine manufacturing programs generate continuous and recurring excipient purchasing requirements throughout extended commercial production horizons.
Global Polysorbate 80 Market Regional Analysis

By Region
- North America
- South America
- Europe
- Middle East & Africa
- Asia Pacific
Asia Pacific holds the strongest regional position within the Global Polysorbate 80 Market at a 35% share, establishing it as the most commercially influential geography in the current industry structure. This leadership is supported by stronger manufacturing depth across food processing, pharmaceutical production, and personal care formulation industries throughout the region, with Asia Pacific Polysorbate 80 demand being reinforced by expanding domestic consumption, growing export-oriented manufacturing capacity, and rising formulation complexity across both regulated and industrial end-use categories.
The region's dominance is expected to deepen as manufacturing investment and formulation capability continue to advance across key markets within Asia Pacific. Demand for Polysorbate 80 in personal care and food ingredient applications is expanding across emerging manufacturing economies within the region, driven by rising consumer goods production, growing pharmaceutical output, and strengthening regulatory frameworks that reward compliant, specification-aligned ingredient systems. As these structural forces intensify through the forecast period, Asia Pacific is expected to reinforce its position as the primary growth engine and most strategically significant regional market within the Global Polysorbate 80 Market.
Unlock Market Intelligence
Explore the market potential with our data-driven report
Global Polysorbate 80 Market Segmentation Analysis
By Product Form
- Liquid Polysorbate 80
- Concentrated Polysorbate 80
- Diluted Polysorbate 80
The segment has the highest share around 70% under the Product Form category, with Liquid Polysorbate 80 leading the global structure. This dominant share shows that the industry continues to favor a form that fits efficiently into large-scale formulation systems and regular manufacturing workflows. Because liquid formats are easier to meter, blend, and distribute uniformly, they remain the preferred option across a wide range of industrial applications.
Its strong lead also indicates that operational convenience continues to shape procurement decisions more than niche format differentiation. Liquid Polysorbate 80 remains commercially important because it reduces handling friction and supports consistent production output across food, cosmetic, and pharmaceutical processes. With 70% share in the product form structure, this segment continues to anchor revenue generation and remains the clearest support base for overall category expansion through the forecast period.

By End User
- Food & Beverage
- Personal Care
- Pharmaceuticals
- Others
The Food and Beverage segment commands the highest share within the end-user category at 40%, driven by the broad and recurring deployment of emulsification and stability systems across large-scale food processing operations in both developed and emerging manufacturing economies. Producers across baked goods, dairy, confectionery, and beverage categories are relying on food-grade Polysorbate 80 applications to maintain texture consistency, process stability, and product quality across repeated high-volume production cycles where ingredient performance variability is commercially unacceptable. Its lead position confirms that functional reliability within industrial-scale food manufacturing is the most durable commercial organizer within the global end-user landscape.
The segment's dominance reflects a broader market reality in which recurring production cycles in food manufacturing generate predictable and volume-consistent ingredient replenishment demand that is largely insulated from discretionary purchasing variability. Polysorbate 80 emulsifier functionality within this segment is valued for its ability to support stable processing and dependable output quality across diverse formulation systems and production environments. As food manufacturing capacity continues to expand across Asia Pacific and other high-growth regions, this segment is expected to maintain its position as the most commercially significant end-user category within the Global Polysorbate 80 Market through 2032.
Market Players in Global Polysorbate 80 Market
These market players maintain a significant presence in the Global polysorbate 80 market sector and contribute to its ongoing evolution.
- NOF Corporation
- Seppic
- Oleon NV
- BASF SE
- Croda International Plc
- Evonik Industries AG
- Arxada
- Clariant AG
- PCC Exol SA
- Sanyo Chemical Industries Ltd.
- Ethox Chemicals LLC
- Mohini Organics Pvt. Ltd.
- Spak Orgochem India Ltd.
- KLK OLEO/KLK Kolb
- Merck KGaA/MilliporeSigma
Market News & Updates
- Evonik Industries AG, 2025:
Evonik launched MaxiPure® Polysorbate 80 in September 2025 for injectable and biopharmaceutical drug formulations. The product is an ultra-high purity non-ionic surfactant with oleic acid content above 98% and compliance with Ph. Eur., USP, JP, and CP monographs. The launch expands Evonik’s pharmaceutical excipient portfolio for biologics and parenteral applications
- Seppic, 2025:
Seppic highlighted its injectable polysorbate range in January 2025, including MONTANOX™ 80 PPI, MONTANOX™ 20 PPI, and MONTANOX™ 20 HPB. The range is GMP Part II grade and compliant with the Chinese Pharmacopoeia. The update supports injectable formulation use cases for pharmaceutical manufacturers
Frequently Asked Questions
Related Report
- Market Segmentation
- Research Scope
- Research Methodology
- Definitions and Assumptions
- Executive Summary
- Global Polysorbate 80 Market Policies, Regulations, and Standards
- Global Polysorbate 80 Market Dynamics
- Growth Factors
- Challenges
- Trends
- Opportunities
- Global Polysorbate 80 Market Statistics, 2022-2032F
- Market Size & Growth Outlook
- By Revenues in USD Million
- Market Segmentation & Growth Outlook
- By Product Form
- Liquid Polysorbate 80- Market Insights and Forecast 2022-2032, USD Million
- Concentrated Polysorbate 80- Market Insights and Forecast 2022-2032, USD Million
- Diluted Polysorbate 80- Market Insights and Forecast 2022-2032, USD Million
- By Functional Role
- Emulsifier- Market Insights and Forecast 2022-2032, USD Million
- Solubilizer- Market Insights and Forecast 2022-2032, USD Million
- Wetting Agent- Market Insights and Forecast 2022-2032, USD Million
- Dispersing Agent- Market Insights and Forecast 2022-2032, USD Million
- Stabilizer- Market Insights and Forecast 2022-2032, USD Million
- Surfactant- Market Insights and Forecast 2022-2032, USD Million
- By End User
- Food & Beverage- Market Insights and Forecast 2022-2032, USD Million
- Personal Care- Market Insights and Forecast 2022-2032, USD Million
- Pharmaceuticals- Market Insights and Forecast 2022-2032, USD Million
- Others- Market Insights and Forecast 2022-2032, USD Million
- By Sales Channel
- Retail Online- Market Insights and Forecast 2022-2032, USD Million
- E-Commerce Marketplaces- Market Insights and Forecast 2022-2032, USD Million
- Company-Owned Websites- Market Insights and Forecast 2022-2032, USD Million
- B2B Chemical Marketplaces- Market Insights and Forecast 2022-2032, USD Million
- Online Specialty Ingredient Platforms- Market Insights and Forecast 2022-2032, USD Million
- E-Procurement Portals- Market Insights and Forecast 2022-2032, USD Million
- Retail Offline- Market Insights and Forecast 2022-2032, USD Million
- Direct Sales- Market Insights and Forecast 2022-2032, USD Million
- Specialty Chemical Distributors- Market Insights and Forecast 2022-2032, USD Million
- Food Ingredient Distributors- Market Insights and Forecast 2022-2032, USD Million
- Pharmaceutical Excipient Distributors- Market Insights and Forecast 2022-2032, USD Million
- Cosmetic Ingredient Distributors- Market Insights and Forecast 2022-2032, USD Million
- Regional Chemical Suppliers- Market Insights and Forecast 2022-2032, USD Million
- Retail Online- Market Insights and Forecast 2022-2032, USD Million
- By Region
- North America
- South America
- Europe
- Middle East & Africa
- Asia Pacific
- By Competitors
- Competition Characteristics
- Market Share & Analysis
- By Product Form
- Market Size & Growth Outlook
- North America Polysorbate 80 Market Statistics, 2022-2032F
- Market Size & Growth Outlook
- By Revenues in USD Million
- Market Segmentation & Growth Outlook
- By Product Form- Market Insights and Forecast 2022-2032, USD Million
- By Functional Role- Market Insights and Forecast 2022-2032, USD Million
- By End User- Market Insights and Forecast 2022-2032, USD Million
- By Sales Channel- Market Insights and Forecast 2022-2032, USD Million
- By Country
- US
- Canada
- Mexico
- Rest of North America
- US Polysorbate 80 Market Statistics, 2022-2032F
- Market Size & Growth Outlook
- By Revenues in USD Million
- Market Segmentation & Growth Outlook
- By Product Form- Market Insights and Forecast 2022-2032, USD Million
- By Functional Role- Market Insights and Forecast 2022-2032, USD Million
- By End User- Market Insights and Forecast 2022-2032, USD Million
- By Sales Channel- Market Insights and Forecast 2022-2032, USD Million
- Market Size & Growth Outlook
- Canada Polysorbate 80 Market Statistics, 2022-2032F
- Market Size & Growth Outlook
- By Revenues in USD Million
- Market Segmentation & Growth Outlook
- By Product Form- Market Insights and Forecast 2022-2032, USD Million
- By Functional Role- Market Insights and Forecast 2022-2032, USD Million
- By End User- Market Insights and Forecast 2022-2032, USD Million
- By Sales Channel- Market Insights and Forecast 2022-2032, USD Million
- Market Size & Growth Outlook
- Mexico Polysorbate 80 Market Statistics, 2022-2032F
- Market Size & Growth Outlook
- By Revenues in USD Million
- Market Segmentation & Growth Outlook
- By Product Form- Market Insights and Forecast 2022-2032, USD Million
- By Functional Role- Market Insights and Forecast 2022-2032, USD Million
- By End User- Market Insights and Forecast 2022-2032, USD Million
- By Sales Channel- Market Insights and Forecast 2022-2032, USD Million
- Market Size & Growth Outlook
- Market Size & Growth Outlook
- South America Polysorbate 80 Market Statistics, 2022-2032F
- Market Size & Growth Outlook
- By Revenues in USD Million
- Market Segmentation & Growth Outlook
- By Product Form- Market Insights and Forecast 2022-2032, USD Million
- By Functional Role- Market Insights and Forecast 2022-2032, USD Million
- By End User- Market Insights and Forecast 2022-2032, USD Million
- By Sales Channel- Market Insights and Forecast 2022-2032, USD Million
- By Country
- Brazil
- Argentina
- Rest of South America
- Brazil Polysorbate 80 Market Statistics, 2022-2032F
- Market Size & Growth Outlook
- By Revenues in USD Million
- Market Segmentation & Growth Outlook
- By Product Form- Market Insights and Forecast 2022-2032, USD Million
- By Functional Role- Market Insights and Forecast 2022-2032, USD Million
- By End User- Market Insights and Forecast 2022-2032, USD Million
- By Sales Channel- Market Insights and Forecast 2022-2032, USD Million
- Market Size & Growth Outlook
- Argentina Polysorbate 80 Market Statistics, 2022-2032F
- Market Size & Growth Outlook
- By Revenues in USD Million
- Market Segmentation & Growth Outlook
- By Product Form- Market Insights and Forecast 2022-2032, USD Million
- By Functional Role- Market Insights and Forecast 2022-2032, USD Million
- By End User- Market Insights and Forecast 2022-2032, USD Million
- By Sales Channel- Market Insights and Forecast 2022-2032, USD Million
- Market Size & Growth Outlook
- Market Size & Growth Outlook
- Europe Polysorbate 80 Market Statistics, 2022-2032F
- Market Size & Growth Outlook
- By Revenues in USD Million
- Market Segmentation & Growth Outlook
- By Product Form- Market Insights and Forecast 2022-2032, USD Million
- By Functional Role- Market Insights and Forecast 2022-2032, USD Million
- By End User- Market Insights and Forecast 2022-2032, USD Million
- By Sales Channel- Market Insights and Forecast 2022-2032, USD Million
- By Country
- Germany
- UK
- France
- Spain
- Italy
- Poland
- Rest of Europe
- Germany Polysorbate 80 Market Statistics, 2022-2032F
- Market Size & Growth Outlook
- By Revenues in USD Million
- Market Segmentation & Growth Outlook
- By Product Form- Market Insights and Forecast 2022-2032, USD Million
- By Functional Role- Market Insights and Forecast 2022-2032, USD Million
- By End User- Market Insights and Forecast 2022-2032, USD Million
- By Sales Channel- Market Insights and Forecast 2022-2032, USD Million
- Market Size & Growth Outlook
- UK Polysorbate 80 Market Statistics, 2022-2032F
- Market Size & Growth Outlook
- By Revenues in USD Million
- Market Segmentation & Growth Outlook
- By Product Form- Market Insights and Forecast 2022-2032, USD Million
- By Functional Role- Market Insights and Forecast 2022-2032, USD Million
- By End User- Market Insights and Forecast 2022-2032, USD Million
- By Sales Channel- Market Insights and Forecast 2022-2032, USD Million
- Market Size & Growth Outlook
- France Polysorbate 80 Market Statistics, 2022-2032F
- Market Size & Growth Outlook
- By Revenues in USD Million
- Market Segmentation & Growth Outlook
- By Product Form- Market Insights and Forecast 2022-2032, USD Million
- By Functional Role- Market Insights and Forecast 2022-2032, USD Million
- By End User- Market Insights and Forecast 2022-2032, USD Million
- By Sales Channel- Market Insights and Forecast 2022-2032, USD Million
- Market Size & Growth Outlook
- Spain Polysorbate 80 Market Statistics, 2022-2032F
- Market Size & Growth Outlook
- By Revenues in USD Million
- Market Segmentation & Growth Outlook
- By Product Form- Market Insights and Forecast 2022-2032, USD Million
- By Functional Role- Market Insights and Forecast 2022-2032, USD Million
- By End User- Market Insights and Forecast 2022-2032, USD Million
- By Sales Channel- Market Insights and Forecast 2022-2032, USD Million
- Market Size & Growth Outlook
- Italy Polysorbate 80 Market Statistics, 2022-2032F
- Market Size & Growth Outlook
- By Revenues in USD Million
- Market Segmentation & Growth Outlook
- By Product Form- Market Insights and Forecast 2022-2032, USD Million
- By Functional Role- Market Insights and Forecast 2022-2032, USD Million
- By End User- Market Insights and Forecast 2022-2032, USD Million
- By Sales Channel- Market Insights and Forecast 2022-2032, USD Million
- Market Size & Growth Outlook
- Poland Polysorbate 80 Market Statistics, 2022-2032F
- Market Size & Growth Outlook
- By Revenues in USD Million
- Market Segmentation & Growth Outlook
- By Product Form- Market Insights and Forecast 2022-2032, USD Million
- By Functional Role- Market Insights and Forecast 2022-2032, USD Million
- By End User- Market Insights and Forecast 2022-2032, USD Million
- By Sales Channel- Market Insights and Forecast 2022-2032, USD Million
- Market Size & Growth Outlook
- Market Size & Growth Outlook
- Middle East & Africa Polysorbate 80 Market Statistics, 2022-2032F
- Market Size & Growth Outlook
- By Revenues in USD Million
- Market Segmentation & Growth Outlook
- By Product Form- Market Insights and Forecast 2022-2032, USD Million
- By Functional Role- Market Insights and Forecast 2022-2032, USD Million
- By End User- Market Insights and Forecast 2022-2032, USD Million
- By Sales Channel- Market Insights and Forecast 2022-2032, USD Million
- By Country
- Saudi Arabia
- UAE
- Egypt
- Nigeria
- South Africa
- Rest of Middle East & Africa
- Saudi Arabia Polysorbate 80 Market Statistics, 2022-2032F
- Market Size & Growth Outlook
- By Revenues in USD Million
- Market Segmentation & Growth Outlook
- By Product Form- Market Insights and Forecast 2022-2032, USD Million
- By Functional Role- Market Insights and Forecast 2022-2032, USD Million
- By End User- Market Insights and Forecast 2022-2032, USD Million
- By Sales Channel- Market Insights and Forecast 2022-2032, USD Million
- Market Size & Growth Outlook
- UAE Polysorbate 80 Market Statistics, 2022-2032F
- Market Size & Growth Outlook
- By Revenues in USD Million
- Market Segmentation & Growth Outlook
- By Product Form- Market Insights and Forecast 2022-2032, USD Million
- By Functional Role- Market Insights and Forecast 2022-2032, USD Million
- By End User- Market Insights and Forecast 2022-2032, USD Million
- By Sales Channel- Market Insights and Forecast 2022-2032, USD Million
- Market Size & Growth Outlook
- Egypt Polysorbate 80 Market Statistics, 2022-2032F
- Market Size & Growth Outlook
- By Revenues in USD Million
- Market Segmentation & Growth Outlook
- By Product Form- Market Insights and Forecast 2022-2032, USD Million
- By Functional Role- Market Insights and Forecast 2022-2032, USD Million
- By End User- Market Insights and Forecast 2022-2032, USD Million
- By Sales Channel- Market Insights and Forecast 2022-2032, USD Million
- Market Size & Growth Outlook
- Nigeria Polysorbate 80 Market Statistics, 2022-2032F
- Market Size & Growth Outlook
- By Revenues in USD Million
- Market Segmentation & Growth Outlook
- By Product Form- Market Insights and Forecast 2022-2032, USD Million
- By Functional Role- Market Insights and Forecast 2022-2032, USD Million
- By End User- Market Insights and Forecast 2022-2032, USD Million
- By Sales Channel- Market Insights and Forecast 2022-2032, USD Million
- Market Size & Growth Outlook
- South Africa Polysorbate 80 Market Statistics, 2022-2032F
- Market Size & Growth Outlook
- By Revenues in USD Million
- Market Segmentation & Growth Outlook
- By Product Form- Market Insights and Forecast 2022-2032, USD Million
- By Functional Role- Market Insights and Forecast 2022-2032, USD Million
- By End User- Market Insights and Forecast 2022-2032, USD Million
- By Sales Channel- Market Insights and Forecast 2022-2032, USD Million
- Market Size & Growth Outlook
- Market Size & Growth Outlook
- Asia Pacific Polysorbate 80 Market Statistics, 2022-2032F
- Market Size & Growth Outlook
- By Revenues in USD Million
- Market Segmentation & Growth Outlook
- By Product Form- Market Insights and Forecast 2022-2032, USD Million
- By Functional Role- Market Insights and Forecast 2022-2032, USD Million
- By End User- Market Insights and Forecast 2022-2032, USD Million
- By Sales Channel- Market Insights and Forecast 2022-2032, USD Million
- By Country
- China
- India
- Japan
- South Korea
- Australia
- Indonesia
- Rest of Asia Pacific
- China Polysorbate 80 Market Statistics, 2022-2032F
- Market Size & Growth Outlook
- By Revenues in USD Million
- Market Segmentation & Growth Outlook
- By Product Form- Market Insights and Forecast 2022-2032, USD Million
- By Functional Role- Market Insights and Forecast 2022-2032, USD Million
- By End User- Market Insights and Forecast 2022-2032, USD Million
- By Sales Channel- Market Insights and Forecast 2022-2032, USD Million
- Market Size & Growth Outlook
- India Polysorbate 80 Market Statistics, 2022-2032F
- Market Size & Growth Outlook
- By Revenues in USD Million
- Market Segmentation & Growth Outlook
- By Product Form- Market Insights and Forecast 2022-2032, USD Million
- By Functional Role- Market Insights and Forecast 2022-2032, USD Million
- By End User- Market Insights and Forecast 2022-2032, USD Million
- By Sales Channel- Market Insights and Forecast 2022-2032, USD Million
- Market Size & Growth Outlook
- Japan Polysorbate 80 Market Statistics, 2022-2032F
- Market Size & Growth Outlook
- By Revenues in USD Million
- Market Segmentation & Growth Outlook
- By Product Form- Market Insights and Forecast 2022-2032, USD Million
- By Functional Role- Market Insights and Forecast 2022-2032, USD Million
- By End User- Market Insights and Forecast 2022-2032, USD Million
- By Sales Channel- Market Insights and Forecast 2022-2032, USD Million
- Market Size & Growth Outlook
- South Korea Polysorbate 80 Market Statistics, 2022-2032F
- Market Size & Growth Outlook
- By Revenues in USD Million
- Market Segmentation & Growth Outlook
- By Product Form- Market Insights and Forecast 2022-2032, USD Million
- By Functional Role- Market Insights and Forecast 2022-2032, USD Million
- By End User- Market Insights and Forecast 2022-2032, USD Million
- By Sales Channel- Market Insights and Forecast 2022-2032, USD Million
- Market Size & Growth Outlook
- Australia Polysorbate 80 Market Statistics, 2022-2032F
- Market Size & Growth Outlook
- By Revenues in USD Million
- Market Segmentation & Growth Outlook
- By Product Form- Market Insights and Forecast 2022-2032, USD Million
- By Functional Role- Market Insights and Forecast 2022-2032, USD Million
- By End User- Market Insights and Forecast 2022-2032, USD Million
- By Sales Channel- Market Insights and Forecast 2022-2032, USD Million
- Market Size & Growth Outlook
- Indonesia Polysorbate 80 Market Statistics, 2022-2032F
- Market Size & Growth Outlook
- By Revenues in USD Million
- Market Segmentation & Growth Outlook
- By Product Form- Market Insights and Forecast 2022-2032, USD Million
- By Functional Role- Market Insights and Forecast 2022-2032, USD Million
- By End User- Market Insights and Forecast 2022-2032, USD Million
- By Sales Channel- Market Insights and Forecast 2022-2032, USD Million
- Market Size & Growth Outlook
- Market Size & Growth Outlook
- Competitive Outlook
- Company Profiles
- BASF SE
- Business Description
- Product Portfolio
- Collaborations & Alliances
- Recent Developments
- Financial Details
- Others
- Croda International Plc
- Business Description
- Product Portfolio
- Collaborations & Alliances
- Recent Developments
- Financial Details
- Others
- Evonik Industries AG
- Business Description
- Product Portfolio
- Collaborations & Alliances
- Recent Developments
- Financial Details
- Others
- Arxada
- Business Description
- Product Portfolio
- Collaborations & Alliances
- Recent Developments
- Financial Details
- Others
- Clariant AG
- Business Description
- Product Portfolio
- Collaborations & Alliances
- Recent Developments
- Financial Details
- Others
- NOF Corporation
- Business Description
- Product Portfolio
- Collaborations & Alliances
- Recent Developments
- Financial Details
- Others
- Seppic
- Business Description
- Product Portfolio
- Collaborations & Alliances
- Recent Developments
- Financial Details
- Others
- Oleon NV
- Business Description
- Product Portfolio
- Collaborations & Alliances
- Recent Developments
- Financial Details
- Others
- PCC Exol SA
- Business Description
- Product Portfolio
- Collaborations & Alliances
- Recent Developments
- Financial Details
- Others
- Sanyo Chemical Industries Ltd.
- Business Description
- Product Portfolio
- Collaborations & Alliances
- Recent Developments
- Financial Details
- Others
- Ethox Chemicals LLC
- Business Description
- Product Portfolio
- Collaborations & Alliances
- Recent Developments
- Financial Details
- Others
- Mohini Organics Pvt. Ltd.
- Business Description
- Product Portfolio
- Collaborations & Alliances
- Recent Developments
- Financial Details
- Others
- Spak Orgochem India Ltd.
- Business Description
- Product Portfolio
- Collaborations & Alliances
- Recent Developments
- Financial Details
- Others
- KLK OLEO/KLK Kolb
- Business Description
- Product Portfolio
- Collaborations & Alliances
- Recent Developments
- Financial Details
- Others
- Merck KGaA/MilliporeSigma
- Business Description
- Product Portfolio
- Collaborations & Alliances
- Recent Developments
- Financial Details
- Others
- BASF SE
- Company Profiles
- Disclaimer
| Segment | Sub-Segment |
|---|---|
| By Product Form |
|
| By Functional Role |
|
| By End User |
|
| By Sales Channel |
|
| By Region |
|
Research Methodology
This study followed a structured approach comprising four key phases to assess the size and scope of the electro-oxidation market. The process began with thorough secondary research to collect data on the target market, related markets, and broader industry context. These findings, along with preliminary assumptions and estimates, were then validated through extensive primary research involving industry experts from across the value chain. To calculate the overall market size, both top-down and bottom-up methodologies were employed. Finally, market segmentation and data triangulation techniques were applied to refine and validate segment-level estimations.
Secondary Research
The secondary research phase involved gathering data from a wide range of credible and published sources. This step helped in identifying industry trends, defining market segmentation, and understanding the market landscape and value chain.
Sources consulted during this phase included:
- Company annual reports, investor presentations, and press releases
- Industry white papers and certified publications
- Trade directories and market-recognized databases
- Articles from authoritative authors and reputable journals
- Gold and silver standard websites
Secondary research was critical in mapping out the industry's value chain and monetary flow, identifying key market segments, understanding regional variations, and tracking significant industry developments.
Other key sources:
- Financial disclosures
- Industry associations and trade bodies
- News outlets and business magazines
- Academic journals and research studies
- Paid industry databases
Primary Research
To validate secondary data and gain deeper market insights, primary research was conducted with key stakeholders across both the supply and demand sides of the market.
On the demand side, participants included decision-makers and influencers from end-user industries—such as CIOs, CTOs, and CSOs—who provided first-hand perspectives on market needs, product usage, and future expectations.
On the supply side, interviews were conducted with manufacturers, industry associations, and institutional participants to gather insights into current offerings, product pipelines, and market challenges.
Primary interviews provided critical inputs such as:
- Market size and revenue data
- Product and service breakdowns
- Market forecasts
- Regional and application-specific trends
Stakeholders consulted included:
- Leading OEM and solution providers
- Channel and distribution partners
- End users across various applications
- Independent consultants and industry specialists
Market Size Estimation and Data Triangulation
- Identifying Key Market Participants (Secondary Research)
- Goal: To identify the major players or companies in the target market. This typically involves using publicly available data sources such as industry reports, market research publications, and financial statements of companies.
- Tools: Reports from firms like Gartner, Forrester, Euromonitor, Statista, IBISWorld, and others. Public financial statements, news articles, and press releases from top market players.
- Extracting Earnings of Key Market Participants
- Goal: To estimate the earnings generated from the product or service being analyzed. This step helps in understanding the revenue potential of each market player in a specific geography.
- Methods: Earnings data can be gathered from:
- Publicly available financial reports (for listed companies).
- Interviews and primary data sources from professionals, such as Directors, VPs, SVPs, etc. This is especially useful for understanding more nuanced, internal data that isn't publicly disclosed.
- Annual reports and investor presentations of key players.
- Data Collation and Development of a Relevant Data Model
- Goal: To collate inputs from both primary and secondary sources into a structured, data-driven model for market estimation. This model will incorporate key market KPIs and any independent variables relevant to the market.
- Key KPIs: These could include:
- Market size, growth rate, and demand drivers.
- Industry-specific metrics like market share, average revenue per customer (ARPC), or average deal size.
- External variables, such as economic growth rates, inflation rates, or commodity prices, that could affect the market.
- Data Modeling: Based on this data, the market forecasts are developed for the next 5 years. A combination of trend analysis, scenario modeling, and statistical regression might be used to generate projections.
- Scenario Analysis
- Goal: To test different assumptions and validate how sensitive the market is to changes in key variables (e.g., market demand, regulatory changes, technological disruptions).
- Types of Scenarios:
- Base Case: Based on current assumptions and historical data.
- Best-Case Scenario: Assuming favorable market conditions, regulatory environments, and technological advancements.
- Worst-Case Scenario: Accounting for adverse factors, such as economic downturns, stricter regulations, or unexpected disruptions.


