Global Neodymium Oxide Market Report: Trends, Growth and Forecast (2026-2032)
By Purity Grade (3N, 4N, 4.5N, 5N), By Application (Permanent Magnets, Catalysts, Glass & Ceramics, Polishing Powders), By Region (North America, South America, Europe, Middle East & Africa, Asia-Pacific) ... Read more
|
Major Players
|
Global Neodymium Oxide Market Statistics and Insights, 2026
- Market Size Statistics
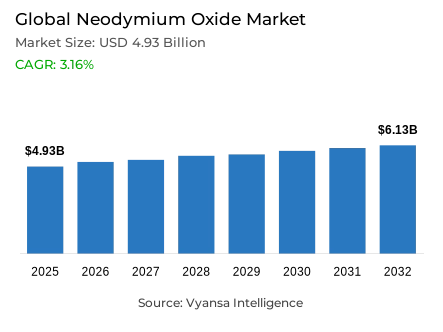
- Global neodymium oxide market is estimated at USD 4.93 billion in 2025.
- The market size is expected to grow to USD 6.13 billion by 2032.
- Market to register a CAGR of around 3.16% during 2026-32.
- Purity Grade Shares
- 4n grabbed market share of 50%.
- Competition
- More than 25 companies are actively engaged in producing neodymium oxide.
- Top 5 companies acquired around 60% of the market share.
- China Minmetals Rare Earths, China Northern Rare Earth Group, Neo Performance Materials, Lynas Rare Earths, MP Materials etc., are few of the top companies.
- Application
- Permanent magnets grabbed 75% of the market.
- Region
- Asia Pacific leads with a 65% share of the global market.
Global Neodymium Oxide Market Outlook
The global neodymium oxide (Nd₂O₃) market is forecasted to be USD 4.93 Billion in 2025 and grow to USD 6.13 Billion by 2032 showing an Annual Growth Rate of around 3.16% CAGR during 2026 to 2032. The key reasons for growth are because of the growing electric vehicle industry and the continuous growth of renewable energy sectors where Neodymium Oxide plays an important role in high performance permanent magnets utilized utilized for motor traction in electric vehicles and wind turbine generators. Approximately 95% of all electric vehicles are utilizing rare earth permanent magnet motors, while the permanent magnet application makes up approximately 75% of the total markets and indicates strong concentrated demand from both automotive industries and renewable energy end users.
The strong supply stability and pricing for rare earth minerals are heavily influenced by China as they accounted for over 69% of the global rare earth mine output and controlled nearly 90% of the world’s processing capacity. Such concentration exposes end users to geopolitical risk and potential for an export ban. Supply chain resilience is still limited, however, as Japan, South Korea and India are looking to expand their domestic output of rare earths and stockpile strategic reserves, continuing to highlight the importance of alternatives and local manufacturing initiatives.
Of all neodymium oxide grades, the predominant grade is 4N (99.99% purity) composing almost 50% of worldwide demand for neodymium oxide, mainly because 4N has the highest degree of magnetic properties, making them useful for high-performance permanent magnetic applications. The balance of the market (approximately 25%) is made up of secondary applications including but not limited to catalysts, glass polishing, alloy materials, and ceramics. While neodymium oxide accommodates these application areas, their overall growth has been much slower than neodymium oxide's high-performance permanent magnet applications.
The Asia Pacific region leads with an approximate 65% of global consumption due primarily to its concentrated production capacity. EVs and renewable energy respectively comprise a large segment of both economies; China holds over half of the production in the Asia Pacific region followed by Japan, South Korea, and India expanding their domestic production capabilities in an effort to less depend on China, but also to capitalize on downstream value. Investments in electrification and clean energy technologies will continue to promote increased demand for neodymium oxide through 2026 to 2032.

Global Neodymium Oxide Market Growth Driver
Strong Demand from Clean Energy and Electric Vehicles
A major factor in the acceleration of electric vehicle (EV) adoption and renewable energy deployment is the rapid growth of neodymium oxide consumption. The International Energy Agency (IEA) estimates that the global demand for EV batteries reached over 950 GWh in 2024, a year-on-year increase of over 25%, signalling that EV's will lead the energy transition. Approximately 95% of EVs use rare earth permanent magnet traction motors, which are more efficient than DC motors and enable longer driving ranges. Neodymium oxide permanent magnets are also critical components in EV motors and wind turbine generators.
The International Renewable Energy Agency (IRENA) expects that demand for both neodymium oxide permanent magnets and rare earth elements in EVs and wind turbines will double between 2024 and 2030 under aggressive energy transition scenarios. In 2023, global rare earth demand from clean energy applications increased by between 8 and 15%. The fact that neodymium oxide plays a significant role in energy transition technologies will continue to create concentrated demand from end-users such as those in the automotive and renewable energy sectors. High-performance permanent magnets used in EV motors provide an efficiency rating of between 92 and 96% and have a higher torque density than induction alternatives. Therefore, neodymium oxide is critical to expanding investment in both electrification and renewable energy and both the volume and value of permanent magnets will continue to grow as demand grows for them in Asian-Pacific regions, where the majority of production and consumption currently occurs.
Global Neodymium Oxide Market Challenge
Geographic Concentration and Supply Chain Risks
The substantial concentration of rare earth production and processing in China presents considerable supply chain vulnerabilities that pose threats to both supply availability and pricing for neodymium oxide. For example, the U.S. Geological Survey estimates that in 2024, China will produce more than 69% of the global supply of rare earth mined material, approximately 270,000 metric tons of rare earth oxide, and has an estimated nearly 90% of all rare earth processing capacity worldwide. The consequence of this level of concentration is that end-users are at risk of being affected by both government-imposed export controls on rare earth ores and production/distribution disruptions caused by geopolitical situations. This is recently demonstrated by Chinese export restrictions on medium and heavy rare earth compound products, which indicate serious operational shortcomings present in the existing supply chain infrastructure.
Supply chain resilience is currently limited due to continued efforts toward diversification. The sintered NdFeB magnet midstream production (a reference to the production step immediately before NdFeB magnets are manufactured) is still very much concentrated in the Chinese market, establishing significant dependency risk for both the renewable energy and automotive industry. The World Bank and U.S. Department of Energy report that virtually all stages of production are geographically consolidated (from extraction through the final production of magnets), increasing uncertainty surrounding pricing, lead times, and the availability of raw materials for end-users. Because of these factors, efforts are currently underway by end-users in Japan, South Korea, and India toward establishing alternative sources for neodymium oxide, as well as stockpiling strategy to minimize reliance on the supply chain from China.
Unlock Market Intelligence
Explore the market potential with our data-driven report
Global Neodymium Oxide Market Trend
Rising Use of Permanent Magnets in Automotive Applications
As usage of Permanent Magnet Synchronous Motors (PMSM) grows in popularity among all Electric Vehicle (EV) platforms, the demand for neodymium oxide has changed. Traditional Internal Combustion Engine (ICE) vehicles use an average of 500 grams of rare earth material compared to 1-3 kilograms for each PMSM electric motor in an EV fleet (Table). Standardization throughout the industry has led to about 95% of EVs having been manufactured with Rare Earth Permanent Magnet Traction Motors due to this higher level of performance efficiency and torque density. This has allowed end-users to take advantage of the improved energy use, range and overall performance benefits of PMSMs over their competitors.
The combination of technological advancements in PMSM technology has resulted in a very concentrated material dependency throughout the EV Powertrain. PMSM technologies operate with an efficiency levels of 92–96% compared to 88-93% for Induction Motor technologies; therefore, they provide superior performance and operational advantages. Currently, global electric vehicle sales are estimated to grow from 50 million-60 million units/year by 2030; therefore, automotive application(s) would create an incremental increase in neodymium demand from 50 thousand-180 thousand metric tons/year. The continued evolution of PMSM technology will therefore create a strong demand for neodymium oxide around the world.
Global Neodymium Oxide Market Opportunity
Developing Recycling and Circular Material Recovery Pathways
The recycling of rare earth permanent magnets from end-of-life products can significantly reduce the dependence on the extraction of primary neodymium oxide. The IEA projects that approximately 30% of primary supply needs will be eliminated by recycling by 2040, but the capacity for this currently does not exist. The majority (over 80%) of rare earth scrap is currently manufactured from consumer electronics and household appliances, with the next largest portion coming from electric vehicle drivetrains and wind turbines. EVs will provide a larger pool of higher-value material for the efficient recovery of rarer earth metals.
Current projections show that by 2050, the composition of scrap will change to include large magnets produced by EVs and wind turbines which will improve economics for recovery. Successful recycling efforts must include cooperation between different segments of the value chain. Including producers and OEMs in this effort will ensure that magnets can be found and recognized based on their location, composition, and specifications, thereby facilitating the efficient recovery of material, supporting sustainable practices, and promoting a circular economy regarding the use of neodymium oxide.
Global Neodymium Oxide Market Regional Analysis

By Region
- North America
- South America
- Europe
- Middle East & Africa
- Asia-Pacific
Asia Pacific is the leading region for global consumption of neodymium oxide, accounting for 65% of total consumption, due to its concentration of production and demand from renewable energy as well as the electric vehicle manufacturing sectors. China controls a large part of the supply chain with a 69% share of the world’s neodymium oxide mines and almost 90% of all the world's processing facilities to make NdFeB magnets. In fact, China produces an estimated 300,000 metric tonnes of NdFeB magnets every year which represents 94% of total global production.
This dominance in neodymium oxide R&D is being supported by the ongoing development of renewable energy and EV manufacturing technologies across the entire Asia Pacific region, including China, Japan and South Korea along with developing markets such as India. For example, in 2024, China increased renewable energy capacity by 421.5 GW, or an increase of 88% from the previous year. Japan alone produces approximately 4,500 metric tonnes of NdFeB magnets every year through Hitachi Proterial and Shin-Etsu; meanwhile South Korea and India are expanding domestic production capabilities to lessen reliance on Chinese supplies. Therefore, the improving supply chain resiliency is reinforcing the ability to capture downstream value as well as the ability of the Asia Pacific region to dominate the global marketplace.
Unlock Market Intelligence
Explore the market potential with our data-driven report
Global Neodymium Oxide Market Segmentation Analysis
By Purity Grade
- 3N
- 4N
- 4.5N
- 5N
With 50% of the demand for neodymium oxide coming from the 4N purity market segment (99.99% purity), it is leading the neodymium oxide market as it represents the majority of the end-use applications in permanent magnets within electric vehicle traction motors (EV) and wind turbine generators (WEG). This high-grade neodymium oxide has better magnetic properties and reliability than lower-grade neodymium oxides and is the preferred neodymium oxide for high-performance applications where proven, consistent performance is required by end users within the automotive and renewable energy sectors.
Three other grades of neodymium oxide, 3N (99.9%), 4.5N (99.995%) and 5N (99.999%), are required for specialty applications. Lower-purity 3N neodymium oxide is typically used in industrial catalyst and glass colorants, resulting in a smaller secondary neodymium oxide market. The premium neodymium oxide grades, above 4.5N, will accommodate niche applications within the Aerospace, Defense, and High-Tech sectors that demand the highest specifications of materials; however, these grades will be limited in volume when compared to 4N neodymium oxide's overall sales volume. Throughout all neodymium oxide grades, permanent magnets remain the largest application of neodymium oxide.

By Application
- Permanent Magnets
- Catalysts
- Glass & Ceramics
- Polishing Powders
The largest segment of the global neodymium oxide (Nd₂O₃) market is its use in permanent magnets, comprising about 75% of total demand. Electronically, end-user applications including electric vehicles (EVs) and wind energy require neodymium iron boron (NdFeB) magnets to operate traction motors and turbine generators. Based on their unique properties of high magnetic strength, high energy efficiency, and thermal stability, neodymium oxide will remain an irreplaceable material in these applications, generating substantial and sustained growth in demand along with the larger global transition to renewable energy sources.
Moreover, neodymium oxide's secondary market segments which includes catalysts, metal alloys, glass and ceramics etc, account for approximately 25% of total annual demand for neodymium oxide. Industrial (petroleum and chemical) catalytic uses of neodymium oxide are employed to create higher value-added products in a wide array of segment markets. Glass polishing supports the manufacture of specialty and optical glass. The growth of these segments will continue, but they will grow at a much slower rate relative to permanent magnets, partly due to their mature market characteristics, and limited investment from large-scale renewable energy transition projects.
Market Players in Global Neodymium Oxide Market
These market players maintain a significant presence in the Global neodymium oxide market sector and contribute to its ongoing evolution.
- China Minmetals Rare Earths
- China Northern Rare Earth Group
- Neo Performance Materials
- Lynas Rare Earths
- MP Materials
- Arafura Resources
- Peak Rare Earths
- Rainbow Rare Earths
- Iluka Resources
- Texas Mineral Resources
- Australian Strategic Materials
- Indian Rare Earths Ltd. (IREL)
- Metall Rare Earths
- Solvay S.A.
- Greenland Minerals
Market News & Updates
- Lynas Rare Earths, 2025:
Commenced commercial-scale production of dysprosium and terbium oxides at Malaysian facility, achieving record NdPr oxide production of 2,080 tonnes in the June 2025 quarter.
- MP Materials, 2025:
Achieved record NdPr oxide production of 721 tonnes in Q3 2025, with 51% YoY growth and advanced heavy rare earth separation capacity expected by mid-2026.
Frequently Asked Questions
Related Report
- Market Segmentation
- Research Scope
- Research Methodology
- Definitions and Assumptions
- Executive Summary
- Global Neodymium Oxide (Nd₂O₃) Market Policies, Regulations, and Standards
- Global Neodymium Oxide (Nd₂O₃) Market Dynamics
- Growth Factors
- Challenges
- Trends
- Opportunities
- Global Neodymium Oxide (Nd₂O₃) Market Statistics, 2022-2032F
- Market Size & Growth Outlook
- By Revenues in USD Million
- Market Segmentation & Growth Outlook
- By Purity Grade
- 3N- Market Insights and Forecast 2022-2032, USD Million
- 4N- Market Insights and Forecast 2022-2032, USD Million
- 4.5N- Market Insights and Forecast 2022-2032, USD Million
- 5N- Market Insights and Forecast 2022-2032, USD Million
- By Application
- Permanent Magnets- Market Insights and Forecast 2022-2032, USD Million
- Catalysts- Market Insights and Forecast 2022-2032, USD Million
- Glass & Ceramics- Market Insights and Forecast 2022-2032, USD Million
- Polishing Powders- Market Insights and Forecast 2022-2032, USD Million
- By Region
- North America
- South America
- Europe
- Middle East & Africa
- Asia-Pacific
- By Competitors
- Competition Characteristics
- Market Share & Analysis
- By Purity Grade
- Market Size & Growth Outlook
- North America Neodymium Oxide (Nd₂O₃) Market Statistics, 2022-2032F
- Market Size & Growth Outlook
- By Revenues in USD Million
- Market Segmentation & Growth Outlook
- By Purity Grade- Market Insights and Forecast 2022-2032, USD Million
- By Application- Market Insights and Forecast 2022-2032, USD Million
- By Country
- USA
- Canada
- Mexico
- Rest of North America
- USA Neodymium Oxide (Nd₂O₃) Market Statistics, 2022-2032F
- Market Size & Growth Outlook
- By Revenues in USD Million
- Market Segmentation & Growth Outlook
- By Purity Grade- Market Insights and Forecast 2022-2032, USD Million
- By Application- Market Insights and Forecast 2022-2032, USD Million
- Market Size & Growth Outlook
- Canada Neodymium Oxide (Nd₂O₃) Market Statistics, 2022-2032F
- Market Size & Growth Outlook
- By Revenues in USD Million
- Market Segmentation & Growth Outlook
- By Purity Grade- Market Insights and Forecast 2022-2032, USD Million
- By Application- Market Insights and Forecast 2022-2032, USD Million
- Market Size & Growth Outlook
- Mexico Neodymium Oxide (Nd₂O₃) Market Statistics, 2022-2032F
- Market Size & Growth Outlook
- By Revenues in USD Million
- Market Segmentation & Growth Outlook
- By Purity Grade- Market Insights and Forecast 2022-2032, USD Million
- By Application- Market Insights and Forecast 2022-2032, USD Million
- Market Size & Growth Outlook
- Market Size & Growth Outlook
- South America Neodymium Oxide (Nd₂O₃) Market Statistics, 2022-2032F
- Market Size & Growth Outlook
- By Revenues in USD Million
- Market Segmentation & Growth Outlook
- By Purity Grade- Market Insights and Forecast 2022-2032, USD Million
- By Application- Market Insights and Forecast 2022-2032, USD Million
- By Country
- Brazil
- Argentina
- Chile
- Peru
- Rest of South America
- Brazil Neodymium Oxide (Nd₂O₃) Market Statistics, 2022-2032F
- Market Size & Growth Outlook
- By Revenues in USD Million
- Market Segmentation & Growth Outlook
- By Purity Grade- Market Insights and Forecast 2022-2032, USD Million
- By Application- Market Insights and Forecast 2022-2032, USD Million
- Market Size & Growth Outlook
- Argentina Neodymium Oxide (Nd₂O₃) Market Statistics, 2022-2032F
- Market Size & Growth Outlook
- By Revenues in USD Million
- Market Segmentation & Growth Outlook
- By Purity Grade- Market Insights and Forecast 2022-2032, USD Million
- By Application- Market Insights and Forecast 2022-2032, USD Million
- Market Size & Growth Outlook
- Chile Neodymium Oxide (Nd₂O₃) Market Statistics, 2022-2032F
- Market Size & Growth Outlook
- By Revenues in USD Million
- Market Segmentation & Growth Outlook
- By Purity Grade- Market Insights and Forecast 2022-2032, USD Million
- By Application- Market Insights and Forecast 2022-2032, USD Million
- Market Size & Growth Outlook
- Peru Neodymium Oxide (Nd₂O₃) Market Statistics, 2022-2032F
- Market Size & Growth Outlook
- By Revenues in USD Million
- Market Segmentation & Growth Outlook
- By Purity Grade- Market Insights and Forecast 2022-2032, USD Million
- By Application- Market Insights and Forecast 2022-2032, USD Million
- Market Size & Growth Outlook
- Market Size & Growth Outlook
- Europe Neodymium Oxide (Nd₂O₃) Market Statistics, 2022-2032F
- Market Size & Growth Outlook
- By Revenues in USD Million
- Market Segmentation & Growth Outlook
- By Purity Grade- Market Insights and Forecast 2022-2032, USD Million
- By Application- Market Insights and Forecast 2022-2032, USD Million
- By Country
- Germany
- France
- Italy
- Spain
- UK
- Poland
- Netherlands
- Belgium
- Benelux
- Rest of Europe
- Germany Neodymium Oxide (Nd₂O₃) Market Statistics, 2022-2032F
- Market Size & Growth Outlook
- By Revenues in USD Million
- Market Segmentation & Growth Outlook
- By Purity Grade- Market Insights and Forecast 2022-2032, USD Million
- By Application- Market Insights and Forecast 2022-2032, USD Million
- Market Size & Growth Outlook
- France Neodymium Oxide (Nd₂O₃) Market Statistics, 2022-2032F
- Market Size & Growth Outlook
- By Revenues in USD Million
- Market Segmentation & Growth Outlook
- By Purity Grade- Market Insights and Forecast 2022-2032, USD Million
- By Application- Market Insights and Forecast 2022-2032, USD Million
- Market Size & Growth Outlook
- Italy Neodymium Oxide (Nd₂O₃) Market Statistics, 2022-2032F
- Market Size & Growth Outlook
- By Revenues in USD Million
- Market Segmentation & Growth Outlook
- By Purity Grade- Market Insights and Forecast 2022-2032, USD Million
- By Application- Market Insights and Forecast 2022-2032, USD Million
- Market Size & Growth Outlook
- Spain Neodymium Oxide (Nd₂O₃) Market Statistics, 2022-2032F
- Market Size & Growth Outlook
- By Revenues in USD Million
- Market Segmentation & Growth Outlook
- By Purity Grade- Market Insights and Forecast 2022-2032, USD Million
- By Application- Market Insights and Forecast 2022-2032, USD Million
- Market Size & Growth Outlook
- UK Neodymium Oxide (Nd₂O₃) Market Statistics, 2022-2032F
- Market Size & Growth Outlook
- By Revenues in USD Million
- Market Segmentation & Growth Outlook
- By Purity Grade- Market Insights and Forecast 2022-2032, USD Million
- By Application- Market Insights and Forecast 2022-2032, USD Million
- Market Size & Growth Outlook
- Poland Neodymium Oxide (Nd₂O₃) Market Statistics, 2022-2032F
- Market Size & Growth Outlook
- By Revenues in USD Million
- Market Segmentation & Growth Outlook
- By Purity Grade- Market Insights and Forecast 2022-2032, USD Million
- By Application- Market Insights and Forecast 2022-2032, USD Million
- Market Size & Growth Outlook
- Netherlands Neodymium Oxide (Nd₂O₃) Market Statistics, 2022-2032F
- Market Size & Growth Outlook
- By Revenues in USD Million
- Market Segmentation & Growth Outlook
- By Purity Grade- Market Insights and Forecast 2022-2032, USD Million
- By Application- Market Insights and Forecast 2022-2032, USD Million
- Market Size & Growth Outlook
- Belgium Neodymium Oxide (Nd₂O₃) Market Statistics, 2022-2032F
- Market Size & Growth Outlook
- By Revenues in USD Million
- Market Segmentation & Growth Outlook
- By Purity Grade- Market Insights and Forecast 2022-2032, USD Million
- By Application- Market Insights and Forecast 2022-2032, USD Million
- Market Size & Growth Outlook
- Benelux Neodymium Oxide (Nd₂O₃) Market Statistics, 2022-2032F
- Market Size & Growth Outlook
- By Revenues in USD Million
- Market Segmentation & Growth Outlook
- By Purity Grade- Market Insights and Forecast 2022-2032, USD Million
- By Application- Market Insights and Forecast 2022-2032, USD Million
- Market Size & Growth Outlook
- Market Size & Growth Outlook
- Middle East & Africa Neodymium Oxide (Nd₂O₃) Market Statistics, 2022-2032F
- Market Size & Growth Outlook
- By Revenues in USD Million
- Market Segmentation & Growth Outlook
- By Purity Grade- Market Insights and Forecast 2022-2032, USD Million
- By Application- Market Insights and Forecast 2022-2032, USD Million
- By Country
- UAE
- Saudi Arabia
- South Africa
- Qatar
- Turkey
- Russia
- Rest of Middle East & Africa
- UAE Neodymium Oxide (Nd₂O₃) Market Statistics, 2022-2032F
- Market Size & Growth Outlook
- By Revenues in USD Million
- Market Segmentation & Growth Outlook
- By Purity Grade- Market Insights and Forecast 2022-2032, USD Million
- By Application- Market Insights and Forecast 2022-2032, USD Million
- Market Size & Growth Outlook
- Saudi Arabia Neodymium Oxide (Nd₂O₃) Market Statistics, 2022-2032F
- Market Size & Growth Outlook
- By Revenues in USD Million
- Market Segmentation & Growth Outlook
- By Purity Grade- Market Insights and Forecast 2022-2032, USD Million
- By Application- Market Insights and Forecast 2022-2032, USD Million
- Market Size & Growth Outlook
- South Africa Neodymium Oxide (Nd₂O₃) Market Statistics, 2022-2032F
- Market Size & Growth Outlook
- By Revenues in USD Million
- Market Segmentation & Growth Outlook
- By Purity Grade- Market Insights and Forecast 2022-2032, USD Million
- By Application- Market Insights and Forecast 2022-2032, USD Million
- Market Size & Growth Outlook
- Qatar Neodymium Oxide (Nd₂O₃) Market Statistics, 2022-2032F
- Market Size & Growth Outlook
- By Revenues in USD Million
- Market Segmentation & Growth Outlook
- By Purity Grade- Market Insights and Forecast 2022-2032, USD Million
- By Application- Market Insights and Forecast 2022-2032, USD Million
- Market Size & Growth Outlook
- Turkey Neodymium Oxide (Nd₂O₃) Market Statistics, 2022-2032F
- Market Size & Growth Outlook
- By Revenues in USD Million
- Market Segmentation & Growth Outlook
- By Purity Grade- Market Insights and Forecast 2022-2032, USD Million
- By Application- Market Insights and Forecast 2022-2032, USD Million
- Market Size & Growth Outlook
- Russia Neodymium Oxide (Nd₂O₃) Market Statistics, 2022-2032F
- Market Size & Growth Outlook
- By Revenues in USD Million
- Market Segmentation & Growth Outlook
- By Purity Grade- Market Insights and Forecast 2022-2032, USD Million
- By Application- Market Insights and Forecast 2022-2032, USD Million
- Market Size & Growth Outlook
- Market Size & Growth Outlook
- Asia-Pacific Neodymium Oxide (Nd₂O₃) Market Statistics, 2022-2032F
- Market Size & Growth Outlook
- By Revenues in USD Million
- Market Segmentation & Growth Outlook
- By Purity Grade- Market Insights and Forecast 2022-2032, USD Million
- By Application- Market Insights and Forecast 2022-2032, USD Million
- By Country
- China
- India
- Japan
- South Korea
- Thailand
- Australia
- Rest of Asia-Pacific
- China Neodymium Oxide (Nd₂O₃) Market Statistics, 2022-2032F
- Market Size & Growth Outlook
- By Revenues in USD Million
- Market Segmentation & Growth Outlook
- By Purity Grade- Market Insights and Forecast 2022-2032, USD Million
- By Application- Market Insights and Forecast 2022-2032, USD Million
- Market Size & Growth Outlook
- India Neodymium Oxide (Nd₂O₃) Market Statistics, 2022-2032F
- Market Size & Growth Outlook
- By Revenues in USD Million
- Market Segmentation & Growth Outlook
- By Purity Grade- Market Insights and Forecast 2022-2032, USD Million
- By Application- Market Insights and Forecast 2022-2032, USD Million
- Market Size & Growth Outlook
- Japan Neodymium Oxide (Nd₂O₃) Market Statistics, 2022-2032F
- Market Size & Growth Outlook
- By Revenues in USD Million
- Market Segmentation & Growth Outlook
- By Purity Grade- Market Insights and Forecast 2022-2032, USD Million
- By Application- Market Insights and Forecast 2022-2032, USD Million
- Market Size & Growth Outlook
- South Korea Neodymium Oxide (Nd₂O₃) Market Statistics, 2022-2032F
- Market Size & Growth Outlook
- By Revenues in USD Million
- Market Segmentation & Growth Outlook
- By Purity Grade- Market Insights and Forecast 2022-2032, USD Million
- By Application- Market Insights and Forecast 2022-2032, USD Million
- Market Size & Growth Outlook
- Thailand Neodymium Oxide (Nd₂O₃) Market Statistics, 2022-2032F
- Market Size & Growth Outlook
- By Revenues in USD Million
- Market Segmentation & Growth Outlook
- By Purity Grade- Market Insights and Forecast 2022-2032, USD Million
- By Application- Market Insights and Forecast 2022-2032, USD Million
- Market Size & Growth Outlook
- Australia Neodymium Oxide (Nd₂O₃) Market Statistics, 2022-2032F
- Market Size & Growth Outlook
- By Revenues in USD Million
- Market Segmentation & Growth Outlook
- By Purity Grade- Market Insights and Forecast 2022-2032, USD Million
- By Application- Market Insights and Forecast 2022-2032, USD Million
- Market Size & Growth Outlook
- Market Size & Growth Outlook
- Competitive Outlook
- Company Profiles
- Lynas Rare Earths
- Business Description
- Product Portfolio
- Collaborations & Alliances
- Recent Developments
- Financial Details
- Others
- MP Materials
- Business Description
- Product Portfolio
- Collaborations & Alliances
- Recent Developments
- Financial Details
- Others
- Arafura Resources
- Business Description
- Product Portfolio
- Collaborations & Alliances
- Recent Developments
- Financial Details
- Others
- Peak Rare Earths
- Business Description
- Product Portfolio
- Collaborations & Alliances
- Recent Developments
- Financial Details
- Others
- Rainbow Rare Earths
- Business Description
- Product Portfolio
- Collaborations & Alliances
- Recent Developments
- Financial Details
- Others
- China Minmetals Rare Earths
- Business Description
- Product Portfolio
- Collaborations & Alliances
- Recent Developments
- Financial Details
- Others
- China Northern Rare Earth Group
- Business Description
- Product Portfolio
- Collaborations & Alliances
- Recent Developments
- Financial Details
- Others
- Neo Performance Materials
- Business Description
- Product Portfolio
- Collaborations & Alliances
- Recent Developments
- Financial Details
- Others
- Iluka Resources
- Business Description
- Product Portfolio
- Collaborations & Alliances
- Recent Developments
- Financial Details
- Others
- Texas Mineral Resources
- Business Description
- Product Portfolio
- Collaborations & Alliances
- Recent Developments
- Financial Details
- Others
- Australian Strategic Materials
- Business Description
- Product Portfolio
- Collaborations & Alliances
- Recent Developments
- Financial Details
- Others
- Indian Rare Earths Ltd. (IREL)
- Business Description
- Product Portfolio
- Collaborations & Alliances
- Recent Developments
- Financial Details
- Others
- Metall Rare Earths
- Business Description
- Product Portfolio
- Collaborations & Alliances
- Recent Developments
- Financial Details
- Others
- Solvay S.A.
- Business Description
- Product Portfolio
- Collaborations & Alliances
- Recent Developments
- Financial Details
- Others
- Greenland Minerals
- Business Description
- Product Portfolio
- Collaborations & Alliances
- Recent Developments
- Financial Details
- Others
- Lynas Rare Earths
- Company Profiles
- Disclaimer
| Segment | Sub-Segment |
|---|---|
| By Purity Grade |
|
| By Application |
|
| By Region |
|
Research Methodology
This study followed a structured approach comprising four key phases to assess the size and scope of the electro-oxidation market. The process began with thorough secondary research to collect data on the target market, related markets, and broader industry context. These findings, along with preliminary assumptions and estimates, were then validated through extensive primary research involving industry experts from across the value chain. To calculate the overall market size, both top-down and bottom-up methodologies were employed. Finally, market segmentation and data triangulation techniques were applied to refine and validate segment-level estimations.
Secondary Research
The secondary research phase involved gathering data from a wide range of credible and published sources. This step helped in identifying industry trends, defining market segmentation, and understanding the market landscape and value chain.
Sources consulted during this phase included:
- Company annual reports, investor presentations, and press releases
- Industry white papers and certified publications
- Trade directories and market-recognized databases
- Articles from authoritative authors and reputable journals
- Gold and silver standard websites
Secondary research was critical in mapping out the industry's value chain and monetary flow, identifying key market segments, understanding regional variations, and tracking significant industry developments.
Other key sources:
- Financial disclosures
- Industry associations and trade bodies
- News outlets and business magazines
- Academic journals and research studies
- Paid industry databases
Primary Research
To validate secondary data and gain deeper market insights, primary research was conducted with key stakeholders across both the supply and demand sides of the market.
On the demand side, participants included decision-makers and influencers from end-user industries—such as CIOs, CTOs, and CSOs—who provided first-hand perspectives on market needs, product usage, and future expectations.
On the supply side, interviews were conducted with manufacturers, industry associations, and institutional participants to gather insights into current offerings, product pipelines, and market challenges.
Primary interviews provided critical inputs such as:
- Market size and revenue data
- Product and service breakdowns
- Market forecasts
- Regional and application-specific trends
Stakeholders consulted included:
- Leading OEM and solution providers
- Channel and distribution partners
- End users across various applications
- Independent consultants and industry specialists
Market Size Estimation and Data Triangulation
- Identifying Key Market Participants (Secondary Research)
- Goal: To identify the major players or companies in the target market. This typically involves using publicly available data sources such as industry reports, market research publications, and financial statements of companies.
- Tools: Reports from firms like Gartner, Forrester, Euromonitor, Statista, IBISWorld, and others. Public financial statements, news articles, and press releases from top market players.
- Extracting Earnings of Key Market Participants
- Goal: To estimate the earnings generated from the product or service being analyzed. This step helps in understanding the revenue potential of each market player in a specific geography.
- Methods: Earnings data can be gathered from:
- Publicly available financial reports (for listed companies).
- Interviews and primary data sources from professionals, such as Directors, VPs, SVPs, etc. This is especially useful for understanding more nuanced, internal data that isn't publicly disclosed.
- Annual reports and investor presentations of key players.
- Data Collation and Development of a Relevant Data Model
- Goal: To collate inputs from both primary and secondary sources into a structured, data-driven model for market estimation. This model will incorporate key market KPIs and any independent variables relevant to the market.
- Key KPIs: These could include:
- Market size, growth rate, and demand drivers.
- Industry-specific metrics like market share, average revenue per customer (ARPC), or average deal size.
- External variables, such as economic growth rates, inflation rates, or commodity prices, that could affect the market.
- Data Modeling: Based on this data, the market forecasts are developed for the next 5 years. A combination of trend analysis, scenario modeling, and statistical regression might be used to generate projections.
- Scenario Analysis
- Goal: To test different assumptions and validate how sensitive the market is to changes in key variables (e.g., market demand, regulatory changes, technological disruptions).
- Types of Scenarios:
- Base Case: Based on current assumptions and historical data.
- Best-Case Scenario: Assuming favorable market conditions, regulatory environments, and technological advancements.
- Worst-Case Scenario: Accounting for adverse factors, such as economic downturns, stricter regulations, or unexpected disruptions.


