Global Aluminum Oxide Market Report: Trends, Growth and Forecast (2026-2032)
By Type (Technical Grade, Abrasive Grade, Refractory Grade), By Structural Form (Nanoparticles, Powder, Pellets, Tablets, Sputtering Targets), By Application (Ceramics, Electronics, Refractories, Polishing, Coatings, Aluminum Smelting, Abrasive, Aluminum Chemicals, Others), By End-Use Industry (Medical, Pharmaceutical, Chemical, Automotive, Industrial Manufacturing, Electronics, Others), By Region (North America, South America, Europe, Middle East & Africa, Asia Pacific) ... Read more
|
Major Players
|
Global Aluminum Oxide Market Statistics and Insights, 2026
- Market Size Statistics
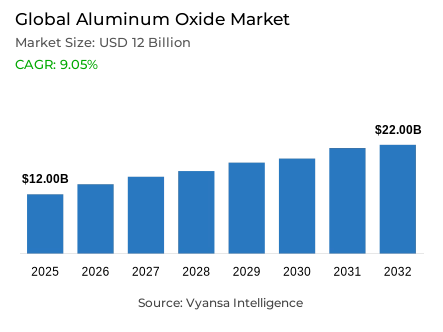
- Global aluminum oxide market is estimated at USD 12 billion in 2025.
- The market size is expected to grow to USD 22 billion by 2032.
- Market to register a CAGR of around 9.05% during 2026-32.
- Type Shares
- Technical grade grabbed market share of 70%.
- Competition
- More than 25 companies are actively engaged in producing aluminum oxide.
- Top 5 companies acquired around 60% of the market share.
- Alcoa Corporation, China Hongqiao Group Limited, Emirates Global Aluminum PJSC, Hindalco Industries Limited, Norsk Hydro ASA etc., are few of the top companies.
- Application
- Ceramics grabbed 40% of the market.
- Region
- Asia Pacific leads with a 60% share of the global market.
Global Aluminum Oxide Market Outlook
The Global Aluminum Oxide Market is expected to Grow to USD 22 Billion by 2032 from USD 12 Billion in 2025 with a CAGR of about 9.05% during the period between 2026 and 2032. The transportation industry will remain the major driver for demand since automotive and electric vehicles require lightweight materials such as aluminum for both fuel efficiency and battery performance. Infrastructure and construction projects, along with Secondary Aluminum Production are also driving stable demand, allowing both commodities and specialty grades of Aluminum Oxide to develop a very stable base for their respective segments.
The Technical Grade Aluminum Oxide segment is the largest in terms of market share which is of around 70%, attributable to its use as a critical metallurgical input to primary aluminum production. The world will produce 70,000 Thousand Metric Tons of Aluminum in 2023 and each ton of Aluminum will require approximately 1.92 Tons of Alumina which will ensure sustained consumption of alumina. Equipment, produces and users within the complete aluminum production chain utilize technical grade products to ensure that the quality of the products they produce and the consistency of their operations remains intact; therefore, the technical grade aluminum oxide market is likely to remain dominant throughout the forecasted period.
Ceramic Applications Represent the Largest Secondary Use of Aluminum Oxide after the Metallurgical Base with 40% of the Total Market. Increasingly Engineered Ceramics, Refractories and Advanced Composites are Being Constructed using Aluminum Oxide and are Being Used in the Aerospace, Automotive and Industrial Sectors. The Introduction of Technology and the use of Biomedical Ceramics and Thermal Management Ceramics Will Provide High-Value Applications to the Premium Markets and Establish the Capability of Differentiation in the Premium Markets from Metallurgical Feedstocks and will Require Substantial Developments in Order to Maintain Premium Pricing Strategies.
Asia Pacific is the leading Region in the global market with 60% Share of the total market, supported by lower cost, Increased urbanization, growth of electronics and availability of hydropower and substantial smelting capacity in countries (China, India and other regional countries) and Access to the complete supply chain. Given the substantial infrastructure development and efficient value chains in the Asia Pacific regions, suppliers and end users of Aluminum Oxide will benefit from a continued growth cycle over the forecast period.

Global Aluminum Oxide Market Growth Driver
Expanding Demand from Automotive and Transportation
The global aluminum oxide market has seen continued growth in recent years as a result of growth in the transportation market (through the use of lightweight aluminum). In 2023, production of aluminum was approximately 70 million metric tons with China being the dominant producer producing approximately 41 million metric tons. There continues to be a high demand for aluminum oxide as a feedstock for the production of aluminum-based products. This continued demand for aluminum oxide is largely due to the ever-growing demand for electric vehicles and the overall desire by automotive (as well as construction) companies to reduce weight in order to have improved fuel efficiency; therefore, this is directly correlated with an increase in the usage of aluminum products (creating a higher demand for aluminum oxide in the production of aluminum).
The global infrastructure and construction sector continues to add to this growth in demand through the production and use of aluminum in their projects (ceramics and refractories). Approximately 36% of the aluminum produced globally is produced from secondary sources, and these products must be verified for quality; therefore, using aluminum oxide is essential. Lastly, the use of aluminum in the construction sector for façades, electro-mechanical systems, and other items creates continual demand for aluminum oxide; thus, this stable demand creates an overall base level of demand for both commodity grades and specialty grades of aluminum oxide; therefore, it is very important to the stability of the aluminum oxide market.
Global Aluminum Oxide Market Challenge
Supply Constraints Driven by Limited Bauxite Availability
Globally, bauxite production is concentrated in a small number of countries; thus, the aluminum oxide industry's supply chain is limited by geography or country of production. Guinea is the largest producer of bauxite and produced approximately 123 million metric tons of bauxite in 2023, while Australia produced approximately 104 million metric tons with 73.5 billion metric tons of bauxite reserves.While the primary producers of aluminum - the four major producing nations, Guinea, Australia, China, and Brazil - have an abundance of aluminum production, there are many associated with the geopolitical environment because they have geographic advantages. Energy continues to act as a bottleneck for supply chain stability and aluminum manufacturing through the mining and smelting processes.
Approximately 3% of global electricity is consumed by aluminum smelting. Approximately 50% of aluminum smelting is based upon coal as the primary energy source, and therefore there are limited options for smelting using natural gas due to geographical availability, and increasing restrictions on the environment due to the need for compliance with health and safety regulations that are limiting the options for creating an efficient supply chain. Energy supply and energy prices are particularly volatile in developing nations using the Bayer process for refining alumina because it is energy-intensive and creates supply chain disruption for aluminum oxide products produced to support industrial manufacturing applications.
Unlock Market Intelligence
Explore the market potential with our data-driven report
Global Aluminum Oxide Market Trend
Evolving Production Practices and Energy Efficiency Advancements
The aluminum industry has reduced emissions intensity from 2019 to 2023 by 13.6% based upon improved energy efficiency and reduced coal consumption and increasing secondary aluminum production. Secondary aluminum production requires only 5% of the energy to produce compared to primary aluminum, accounting for 36% of total global aluminum production and creating a structural advantage for aluminum oxide suppliers organized for the production of aluminum oxide under low carbon manufacturing methods. As a result, hydropower and renewable energy generated 39% of electricity used for aluminum smelting in 2023, creating new markets for sustainably sourced aluminum oxide.
Investment in decarbonization technologies is changing the competitive dynamic and creating market niches for premium price segments. In 2021, approximately 30% of aluminum produced from primary aluminum emitted less than 5 tonnes of CO2 for every tonne produced, allowing producers to command higher prices for their products. Areas with access to renewable energy sources such as Scandinavian nations, Iceland, and parts of Canada, are experiencing a growing demand for the supply of specialty grade aluminum oxide manufactured through low carbon production. The establishment of corporate net-zero initiatives and carbon pricing mechanisms has created greater segmentation between conventional and sustainably produced aluminum, providing an opportunity for environmentally conscious end-users to pay premium prices for products made from recycled materials.
Global Aluminum Oxide Market Opportunity
Growth in High-Purity Electronics and Medical Applications
The electronics and semiconductor markets are driving increasing needs for specialty applications requiring the use of specialized aluminum oxide. High purity aluminum oxide is necessary for producing ceramic abrasives used in the production of printed circuit boards and advanced thermal management materials used for aerospace. In the United States, approximately 35% of aluminum produced is used within the transportation industry, resulting in increased demand for specialty materials used by end-users requiring precise product performance specifications and complying with stringent international quality standards.
The healthcare and medical device manufacturing industries are ultimately moving into the biocompatible ceramic markets where aluminum oxide products represent new premium markets for manufacturers investing in medical device infrastructure. Potential future growth in the electronic and semiconductor markets, resulting from investments in AI infrastructure, 5G networks, and data center technology are leading to increased demand for ultra-high purity aluminum oxide products. The Asia-Pacific healthcare market and localized manufacturing of medical devices represent untapped markets for suppliers who possess the capability to meet the pharmaceutical grade specifications required by end-users. End-users within these markets derived the benefits of using high-value materials manufactured to ensure reliability and high-performance compliance, distinguishing these markets from commoditized metallurgical applications.
Global Aluminum Oxide Market Regional Analysis

By Region
- North America
- South America
- Europe
- Middle East & Africa
- Asia Pacific
Asia-Pacific dominates global aluminum oxide production due to concentrated smelting capacity, integrated supply chains, and regional bauxite resources. China produced 41,000 thousand metric tons of primary aluminum in 2023, requiring substantial metallurgical-grade alumina consumption. Import reliance on Guinea, Australia, and Indonesia supports integrated downstream fabrication and specialty material production across the region. India’s bauxite production of 22.5 million metric tons in 2021-22 further strengthens regional refinery capabilities.
Secondary drivers such as urbanization, electronics manufacturing expansion, and supportive government policies reinforce regional dominance. High utilization rates, hydropower access, and efficient supply chains ensure Asia-Pacific maintains approximately 60% of global aluminum oxide production throughout 2026-32. End users benefit from cost advantages, energy access, and integrated value chains that sustain the region’s leadership in both metallurgical and specialty-grade aluminum oxide markets.
Unlock Market Intelligence
Explore the market potential with our data-driven report
Global Aluminum Oxide Market Segmentation Analysis
By Type
- Technical Grade
- Abrasive Grade
- Refractory Grade
Technical grade aluminum oxide continues to dominate the global market due to its essential role as a metallurgical feedstock in primary aluminum production. Global aluminum output of 70,000 thousand metric tons in 2023 required approximately 1.92 tonnes of alumina per tonne of aluminum, creating a structural demand floor that ensures sustained consumption. The segment’s predominance is reinforced by the fundamental chemistry of the Hall-Héroult process, which leaves limited alternatives for substitution. End users across the aluminum production chain rely on technical-grade aluminum oxide to meet metallurgical specifications, maintain production quality, and ensure operational consistency.
China’s primary aluminum production of 41,000 thousand metric tons in 2023 illustrates proportional domestic demand for technical-grade alumina, underpinning the segment’s market share. International trade flows of metallurgical-grade alumina, including imports to regions like the U.S., further indicate the segment’s structural importance. Absent significant technological shifts or alternative production methods, technical-grade aluminum oxide is expected to retain its dominance throughout the forecast period, serving as a critical feedstock for global aluminum production.

By Application
- Ceramics
- Electronics
- Refractories
- Polishing
- Coatings
- Aluminum Smelting
- Abrasive
- Aluminum Chemicals
- Others
Ceramic applications constitute the largest secondary consumption channel for aluminum oxide outside metallurgical use. Engineered ceramics, refractory materials, and advanced composites support aerospace, automotive, and industrial end users. In the U.S., approximately 22% of bauxite refined in 2023 served non-metallurgical purposes, including abrasives, cement, and refractories, reflecting structural diversification of end-use demand.
Technological advancements in engineered and biomedical ceramics create high-value market segments. Dental implants, orthopedic components, and surgical devices rely on ultra-pure, precisely controlled aluminum oxide, while thermal management ceramics for automotive electronics and aerospace heat exchangers drive demand for premium materials. End users in these sectors experience distinct pricing dynamics and supply chain characteristics compared to metallurgical feedstocks, reinforcing market segmentation within the global aluminum oxide industry.
Market Players in Global Aluminum Oxide Market
These market players maintain a significant presence in the Global aluminum oxide market sector and contribute to its ongoing evolution.
- Alcoa Corporation
- China Hongqiao Group Limited
- Emirates Global Aluminum PJSC
- Hindalco Industries Limited
- Norsk Hydro ASA
- Sasol Limited
- Huber Engineered Materials
- Aluminum Corporation of China Limited
- NALCO India
- Rio Tinto Group
- United Company RUSAL
- South32
- Xinfa Group Co. Ltd.
- Hangzhou Jinjiang Group Co. Ltd.
- Alumina Limited
Market News & Updates
- Hindalco Industries Limited, 2025:
Achieved record EBITDA of INR 219 crores in its India Downstream Aluminium business with record-breaking performance in specialty alumina scaling up to 1 million tonnes capacity; commissioned advanced battery enclosure facility in Chakan delivering 10,000 EV battery enclosures to leading Indian automaker.
- Norsk Hydro ASA, 2025:
Achieved 2025 CO2 emission reduction target of 10% one year ahead of schedule at Alunorte alumina refinery by switching to natural gas and installing electric boilers; established $45 million five-year partnership with Rio Tinto for developing carbon capture technologies in aluminium electrolysis process.
Frequently Asked Questions
Related Report
- Market Segmentation
- Research Scope
- Research Methodology
- Definitions and Assumptions
- Executive Summary
- Global Aluminum Oxide Market Policies, Regulations, and Standards
- Global Aluminum Oxide Market Dynamics
- Growth Factors
- Challenges
- Trends
- Opportunities
- Global Aluminum Oxide Market Statistics, 2022-2032F
- Market Size & Growth Outlook
- By Revenues in USD Million
- By Volume (Thousand Metric Tons)
- Market Segmentation & Growth Outlook
- By Type
- Technical Grade- Market Insights and Forecast 2022-2032, USD Million
- Abrasive Grade- Market Insights and Forecast 2022-2032, USD Million
- Refractory Grade- Market Insights and Forecast 2022-2032, USD Million
- By Structural Form
- Nanoparticles- Market Insights and Forecast 2022-2032, USD Million
- Powder- Market Insights and Forecast 2022-2032, USD Million
- Pellets- Market Insights and Forecast 2022-2032, USD Million
- Tablets- Market Insights and Forecast 2022-2032, USD Million
- Sputtering Targets- Market Insights and Forecast 2022-2032, USD Million
- By Application
- Ceramics- Market Insights and Forecast 2022-2032, USD Million
- Electronics- Market Insights and Forecast 2022-2032, USD Million
- Refractories- Market Insights and Forecast 2022-2032, USD Million
- Polishing- Market Insights and Forecast 2022-2032, USD Million
- Coatings- Market Insights and Forecast 2022-2032, USD Million
- Aluminum Smelting- Market Insights and Forecast 2022-2032, USD Million
- Abrasive- Market Insights and Forecast 2022-2032, USD Million
- Aluminum Chemicals- Market Insights and Forecast 2022-2032, USD Million
- Others- Market Insights and Forecast 2022-2032, USD Million
- By End-Use Industry
- Medical- Market Insights and Forecast 2022-2032, USD Million
- Pharmaceutical- Market Insights and Forecast 2022-2032, USD Million
- Chemical- Market Insights and Forecast 2022-2032, USD Million
- Automotive- Market Insights and Forecast 2022-2032, USD Million
- Industrial Manufacturing- Market Insights and Forecast 2022-2032, USD Million
- Electronics- Market Insights and Forecast 2022-2032, USD Million
- Others- Market Insights and Forecast 2022-2032, USD Million
- By Region
- North America
- South America
- Europe
- Middle East & Africa
- Asia Pacific
- By Competitors
- Competition Characteristics
- Market Share & Analysis
- By Type
- Market Size & Growth Outlook
- North America Aluminum Oxide Market Statistics, 2022-2032F
- Market Size & Growth Outlook
- By Revenues in USD Million
- By Volume (Thousand Metric Tons)
- Market Segmentation & Growth Outlook
- By Type- Market Insights and Forecast 2022-2032, USD Million
- By Structural Form- Market Insights and Forecast 2022-2032, USD Million
- By Application- Market Insights and Forecast 2022-2032, USD Million
- By End-Use Industry- Market Insights and Forecast 2022-2032, USD Million
- By Country
- US
- Canada
- Mexico
- Rest of North America
- US Aluminum Oxide Market Statistics, 2022-2032F
- Market Size & Growth Outlook
- By Revenues in USD Million
- By Volume (Thousand Metric Tons)
- Market Segmentation & Growth Outlook
- By Type- Market Insights and Forecast 2022-2032, USD Million
- By Structural Form- Market Insights and Forecast 2022-2032, USD Million
- By Application- Market Insights and Forecast 2022-2032, USD Million
- By End-Use Industry- Market Insights and Forecast 2022-2032, USD Million
- Market Size & Growth Outlook
- Canada Aluminum Oxide Market Statistics, 2022-2032F
- Market Size & Growth Outlook
- By Revenues in USD Million
- By Volume (Thousand Metric Tons)
- Market Segmentation & Growth Outlook
- By Type- Market Insights and Forecast 2022-2032, USD Million
- By Structural Form- Market Insights and Forecast 2022-2032, USD Million
- By Application- Market Insights and Forecast 2022-2032, USD Million
- By End-Use Industry- Market Insights and Forecast 2022-2032, USD Million
- Market Size & Growth Outlook
- Mexico Aluminum Oxide Market Statistics, 2022-2032F
- Market Size & Growth Outlook
- By Revenues in USD Million
- By Volume (Thousand Metric Tons)
- Market Segmentation & Growth Outlook
- By Type- Market Insights and Forecast 2022-2032, USD Million
- By Structural Form- Market Insights and Forecast 2022-2032, USD Million
- By Application- Market Insights and Forecast 2022-2032, USD Million
- By End-Use Industry- Market Insights and Forecast 2022-2032, USD Million
- Market Size & Growth Outlook
- Market Size & Growth Outlook
- South America Aluminum Oxide Market Statistics, 2022-2032F
- Market Size & Growth Outlook
- By Revenues in USD Million
- By Volume (Thousand Metric Tons)
- Market Segmentation & Growth Outlook
- By Type- Market Insights and Forecast 2022-2032, USD Million
- By Structural Form- Market Insights and Forecast 2022-2032, USD Million
- By Application- Market Insights and Forecast 2022-2032, USD Million
- By End-Use Industry- Market Insights and Forecast 2022-2032, USD Million
- By Country
- Brazil
- Argentina
- Chile
- Rest of South America
- Brazil Aluminum Oxide Market Statistics, 2022-2032F
- Market Size & Growth Outlook
- By Revenues in USD Million
- By Volume (Thousand Metric Tons)
- Market Segmentation & Growth Outlook
- By Type- Market Insights and Forecast 2022-2032, USD Million
- By Structural Form- Market Insights and Forecast 2022-2032, USD Million
- By Application- Market Insights and Forecast 2022-2032, USD Million
- By End-Use Industry- Market Insights and Forecast 2022-2032, USD Million
- Market Size & Growth Outlook
- Argentina Aluminum Oxide Market Statistics, 2022-2032F
- Market Size & Growth Outlook
- By Revenues in USD Million
- By Volume (Thousand Metric Tons)
- Market Segmentation & Growth Outlook
- By Type- Market Insights and Forecast 2022-2032, USD Million
- By Structural Form- Market Insights and Forecast 2022-2032, USD Million
- By Application- Market Insights and Forecast 2022-2032, USD Million
- By End-Use Industry- Market Insights and Forecast 2022-2032, USD Million
- Market Size & Growth Outlook
- Chile Aluminum Oxide Market Statistics, 2022-2032F
- Market Size & Growth Outlook
- By Revenues in USD Million
- By Volume (Thousand Metric Tons)
- Market Segmentation & Growth Outlook
- By Type- Market Insights and Forecast 2022-2032, USD Million
- By Structural Form- Market Insights and Forecast 2022-2032, USD Million
- By Application- Market Insights and Forecast 2022-2032, USD Million
- By End-Use Industry- Market Insights and Forecast 2022-2032, USD Million
- Market Size & Growth Outlook
- Market Size & Growth Outlook
- Europe Aluminum Oxide Market Statistics, 2022-2032F
- Market Size & Growth Outlook
- By Revenues in USD Million
- By Volume (Thousand Metric Tons)
- Market Segmentation & Growth Outlook
- By Type- Market Insights and Forecast 2022-2032, USD Million
- By Structural Form- Market Insights and Forecast 2022-2032, USD Million
- By Application- Market Insights and Forecast 2022-2032, USD Million
- By End-Use Industry- Market Insights and Forecast 2022-2032, USD Million
- By Country
- Germany
- France
- Italy
- Spain
- UK
- Russia
- Netherlands
- Belgium
- Poland
- Turkey
- Rest of Europe
- Germany Aluminum Oxide Market Statistics, 2022-2032F
- Market Size & Growth Outlook
- By Revenues in USD Million
- By Volume (Thousand Metric Tons)
- Market Segmentation & Growth Outlook
- By Type- Market Insights and Forecast 2022-2032, USD Million
- By Structural Form- Market Insights and Forecast 2022-2032, USD Million
- By Application- Market Insights and Forecast 2022-2032, USD Million
- By End-Use Industry- Market Insights and Forecast 2022-2032, USD Million
- Market Size & Growth Outlook
- France Aluminum Oxide Market Statistics, 2022-2032F
- Market Size & Growth Outlook
- By Revenues in USD Million
- By Volume (Thousand Metric Tons)
- Market Segmentation & Growth Outlook
- By Type- Market Insights and Forecast 2022-2032, USD Million
- By Structural Form- Market Insights and Forecast 2022-2032, USD Million
- By Application- Market Insights and Forecast 2022-2032, USD Million
- By End-Use Industry- Market Insights and Forecast 2022-2032, USD Million
- Market Size & Growth Outlook
- Italy Aluminum Oxide Market Statistics, 2022-2032F
- Market Size & Growth Outlook
- By Revenues in USD Million
- By Volume (Thousand Metric Tons)
- Market Segmentation & Growth Outlook
- By Type- Market Insights and Forecast 2022-2032, USD Million
- By Structural Form- Market Insights and Forecast 2022-2032, USD Million
- By Application- Market Insights and Forecast 2022-2032, USD Million
- By End-Use Industry- Market Insights and Forecast 2022-2032, USD Million
- Market Size & Growth Outlook
- Spain Aluminum Oxide Market Statistics, 2022-2032F
- Market Size & Growth Outlook
- By Revenues in USD Million
- By Volume (Thousand Metric Tons)
- Market Segmentation & Growth Outlook
- By Type- Market Insights and Forecast 2022-2032, USD Million
- By Structural Form- Market Insights and Forecast 2022-2032, USD Million
- By Application- Market Insights and Forecast 2022-2032, USD Million
- By End-Use Industry- Market Insights and Forecast 2022-2032, USD Million
- Market Size & Growth Outlook
- UK Aluminum Oxide Market Statistics, 2022-2032F
- Market Size & Growth Outlook
- By Revenues in USD Million
- By Volume (Thousand Metric Tons)
- Market Segmentation & Growth Outlook
- By Type- Market Insights and Forecast 2022-2032, USD Million
- By Structural Form- Market Insights and Forecast 2022-2032, USD Million
- By Application- Market Insights and Forecast 2022-2032, USD Million
- By End-Use Industry- Market Insights and Forecast 2022-2032, USD Million
- Market Size & Growth Outlook
- Russia Aluminum Oxide Market Statistics, 2022-2032F
- Market Size & Growth Outlook
- By Revenues in USD Million
- By Volume (Thousand Metric Tons)
- Market Segmentation & Growth Outlook
- By Type- Market Insights and Forecast 2022-2032, USD Million
- By Structural Form- Market Insights and Forecast 2022-2032, USD Million
- By Application- Market Insights and Forecast 2022-2032, USD Million
- By End-Use Industry- Market Insights and Forecast 2022-2032, USD Million
- Market Size & Growth Outlook
- Netherlands Aluminum Oxide Market Statistics, 2022-2032F
- Market Size & Growth Outlook
- By Revenues in USD Million
- By Volume (Thousand Metric Tons)
- Market Segmentation & Growth Outlook
- By Type- Market Insights and Forecast 2022-2032, USD Million
- By Structural Form- Market Insights and Forecast 2022-2032, USD Million
- By Application- Market Insights and Forecast 2022-2032, USD Million
- By End-Use Industry- Market Insights and Forecast 2022-2032, USD Million
- Market Size & Growth Outlook
- Belgium Aluminum Oxide Market Statistics, 2022-2032F
- Market Size & Growth Outlook
- By Revenues in USD Million
- By Volume (Thousand Metric Tons)
- Market Segmentation & Growth Outlook
- By Type- Market Insights and Forecast 2022-2032, USD Million
- By Structural Form- Market Insights and Forecast 2022-2032, USD Million
- By Application- Market Insights and Forecast 2022-2032, USD Million
- By End-Use Industry- Market Insights and Forecast 2022-2032, USD Million
- Market Size & Growth Outlook
- Poland Aluminum Oxide Market Statistics, 2022-2032F
- Market Size & Growth Outlook
- By Revenues in USD Million
- By Volume (Thousand Metric Tons)
- Market Segmentation & Growth Outlook
- By Type- Market Insights and Forecast 2022-2032, USD Million
- By Structural Form- Market Insights and Forecast 2022-2032, USD Million
- By Application- Market Insights and Forecast 2022-2032, USD Million
- By End-Use Industry- Market Insights and Forecast 2022-2032, USD Million
- Market Size & Growth Outlook
- Turkey Aluminum Oxide Market Statistics, 2022-2032F
- Market Size & Growth Outlook
- By Revenues in USD Million
- By Volume (Thousand Metric Tons)
- Market Segmentation & Growth Outlook
- By Type- Market Insights and Forecast 2022-2032, USD Million
- By Structural Form- Market Insights and Forecast 2022-2032, USD Million
- By Application- Market Insights and Forecast 2022-2032, USD Million
- By End-Use Industry- Market Insights and Forecast 2022-2032, USD Million
- Market Size & Growth Outlook
- Market Size & Growth Outlook
- Middle East & Africa Aluminum Oxide Market Statistics, 2022-2032F
- Market Size & Growth Outlook
- By Revenues in USD Million
- By Volume (Thousand Metric Tons)
- Market Segmentation & Growth Outlook
- By Type- Market Insights and Forecast 2022-2032, USD Million
- By Structural Form- Market Insights and Forecast 2022-2032, USD Million
- By Application- Market Insights and Forecast 2022-2032, USD Million
- By End-Use Industry- Market Insights and Forecast 2022-2032, USD Million
- By Country
- Saudi Arabia
- UAE
- South Africa
- Rest of Middle East & Africa
- Saudi Arabia Aluminum Oxide Market Statistics, 2022-2032F
- Market Size & Growth Outlook
- By Revenues in USD Million
- By Volume (Thousand Metric Tons)
- Market Segmentation & Growth Outlook
- By Type- Market Insights and Forecast 2022-2032, USD Million
- By Structural Form- Market Insights and Forecast 2022-2032, USD Million
- By Application- Market Insights and Forecast 2022-2032, USD Million
- By End-Use Industry- Market Insights and Forecast 2022-2032, USD Million
- Market Size & Growth Outlook
- UAE Aluminum Oxide Market Statistics, 2022-2032F
- Market Size & Growth Outlook
- By Revenues in USD Million
- By Volume (Thousand Metric Tons)
- Market Segmentation & Growth Outlook
- By Type- Market Insights and Forecast 2022-2032, USD Million
- By Structural Form- Market Insights and Forecast 2022-2032, USD Million
- By Application- Market Insights and Forecast 2022-2032, USD Million
- By End-Use Industry- Market Insights and Forecast 2022-2032, USD Million
- Market Size & Growth Outlook
- South Africa Aluminum Oxide Market Statistics, 2022-2032F
- Market Size & Growth Outlook
- By Revenues in USD Million
- By Volume (Thousand Metric Tons)
- Market Segmentation & Growth Outlook
- By Type- Market Insights and Forecast 2022-2032, USD Million
- By Structural Form- Market Insights and Forecast 2022-2032, USD Million
- By Application- Market Insights and Forecast 2022-2032, USD Million
- By End-Use Industry- Market Insights and Forecast 2022-2032, USD Million
- Market Size & Growth Outlook
- Market Size & Growth Outlook
- Asia Pacific Aluminum Oxide Market Statistics, 2022-2032F
- Market Size & Growth Outlook
- By Revenues in USD Million
- By Volume (Thousand Metric Tons)
- Market Segmentation & Growth Outlook
- By Type- Market Insights and Forecast 2022-2032, USD Million
- By Structural Form- Market Insights and Forecast 2022-2032, USD Million
- By Application- Market Insights and Forecast 2022-2032, USD Million
- By End-Use Industry- Market Insights and Forecast 2022-2032, USD Million
- By Country
- China
- India
- Japan
- South Korea
- Australia
- Rest of Asia Pacific
- China Aluminum Oxide Market Statistics, 2022-2032F
- Market Size & Growth Outlook
- By Revenues in USD Million
- By Volume (Thousand Metric Tons)
- Market Segmentation & Growth Outlook
- By Type- Market Insights and Forecast 2022-2032, USD Million
- By Structural Form- Market Insights and Forecast 2022-2032, USD Million
- By Application- Market Insights and Forecast 2022-2032, USD Million
- By End-Use Industry- Market Insights and Forecast 2022-2032, USD Million
- Market Size & Growth Outlook
- India Aluminum Oxide Market Statistics, 2022-2032F
- Market Size & Growth Outlook
- By Revenues in USD Million
- By Volume (Thousand Metric Tons)
- Market Segmentation & Growth Outlook
- By Type- Market Insights and Forecast 2022-2032, USD Million
- By Structural Form- Market Insights and Forecast 2022-2032, USD Million
- By Application- Market Insights and Forecast 2022-2032, USD Million
- By End-Use Industry- Market Insights and Forecast 2022-2032, USD Million
- Market Size & Growth Outlook
- Japan Aluminum Oxide Market Statistics, 2022-2032F
- Market Size & Growth Outlook
- By Revenues in USD Million
- By Volume (Thousand Metric Tons)
- Market Segmentation & Growth Outlook
- By Type- Market Insights and Forecast 2022-2032, USD Million
- By Structural Form- Market Insights and Forecast 2022-2032, USD Million
- By Application- Market Insights and Forecast 2022-2032, USD Million
- By End-Use Industry- Market Insights and Forecast 2022-2032, USD Million
- Market Size & Growth Outlook
- South Korea Aluminum Oxide Market Statistics, 2022-2032F
- Market Size & Growth Outlook
- By Revenues in USD Million
- By Volume (Thousand Metric Tons)
- Market Segmentation & Growth Outlook
- By Type- Market Insights and Forecast 2022-2032, USD Million
- By Structural Form- Market Insights and Forecast 2022-2032, USD Million
- By Application- Market Insights and Forecast 2022-2032, USD Million
- By End-Use Industry- Market Insights and Forecast 2022-2032, USD Million
- Market Size & Growth Outlook
- Australia Aluminum Oxide Market Statistics, 2022-2032F
- Market Size & Growth Outlook
- By Revenues in USD Million
- By Volume (Thousand Metric Tons)
- Market Segmentation & Growth Outlook
- By Type- Market Insights and Forecast 2022-2032, USD Million
- By Structural Form- Market Insights and Forecast 2022-2032, USD Million
- By Application- Market Insights and Forecast 2022-2032, USD Million
- By End-Use Industry- Market Insights and Forecast 2022-2032, USD Million
- Market Size & Growth Outlook
- Market Size & Growth Outlook
- Competitive Outlook
- Company Profiles
- Hindalco Industries Limited
- Business Description
- Product Portfolio
- Collaborations & Alliances
- Recent Developments
- Financial Details
- Others
- Norsk Hydro ASA
- Business Description
- Product Portfolio
- Collaborations & Alliances
- Recent Developments
- Financial Details
- Others
- Sasol Limited
- Business Description
- Product Portfolio
- Collaborations & Alliances
- Recent Developments
- Financial Details
- Others
- Huber Engineered Materials
- Business Description
- Product Portfolio
- Collaborations & Alliances
- Recent Developments
- Financial Details
- Others
- Aluminum Corporation of China Limited
- Business Description
- Product Portfolio
- Collaborations & Alliances
- Recent Developments
- Financial Details
- Others
- Alcoa Corporation
- Business Description
- Product Portfolio
- Collaborations & Alliances
- Recent Developments
- Financial Details
- Others
- China Hongqiao Group Limited
- Business Description
- Product Portfolio
- Collaborations & Alliances
- Recent Developments
- Financial Details
- Others
- Emirates Global Aluminum PJSC
- Business Description
- Product Portfolio
- Collaborations & Alliances
- Recent Developments
- Financial Details
- Others
- NALCO India
- Business Description
- Product Portfolio
- Collaborations & Alliances
- Recent Developments
- Financial Details
- Others
- Rio Tinto Group
- Business Description
- Product Portfolio
- Collaborations & Alliances
- Recent Developments
- Financial Details
- Others
- United Company RUSAL
- Business Description
- Product Portfolio
- Collaborations & Alliances
- Recent Developments
- Financial Details
- Others
- South32
- Business Description
- Product Portfolio
- Collaborations & Alliances
- Recent Developments
- Financial Details
- Others
- Xinfa Group Co. Ltd.
- Business Description
- Product Portfolio
- Collaborations & Alliances
- Recent Developments
- Financial Details
- Others
- Hangzhou Jinjiang Group Co. Ltd.
- Business Description
- Product Portfolio
- Collaborations & Alliances
- Recent Developments
- Financial Details
- Others
- Alumina Limited
- Business Description
- Product Portfolio
- Collaborations & Alliances
- Recent Developments
- Financial Details
- Others
- Hindalco Industries Limited
- Company Profiles
- Disclaimer
| Segment | Sub-Segment |
|---|---|
| By Type |
|
| By Structural Form |
|
| By Application |
|
| By End-Use Industry |
|
| By Region |
|
Research Methodology
This study followed a structured approach comprising four key phases to assess the size and scope of the electro-oxidation market. The process began with thorough secondary research to collect data on the target market, related markets, and broader industry context. These findings, along with preliminary assumptions and estimates, were then validated through extensive primary research involving industry experts from across the value chain. To calculate the overall market size, both top-down and bottom-up methodologies were employed. Finally, market segmentation and data triangulation techniques were applied to refine and validate segment-level estimations.
Secondary Research
The secondary research phase involved gathering data from a wide range of credible and published sources. This step helped in identifying industry trends, defining market segmentation, and understanding the market landscape and value chain.
Sources consulted during this phase included:
- Company annual reports, investor presentations, and press releases
- Industry white papers and certified publications
- Trade directories and market-recognized databases
- Articles from authoritative authors and reputable journals
- Gold and silver standard websites
Secondary research was critical in mapping out the industry's value chain and monetary flow, identifying key market segments, understanding regional variations, and tracking significant industry developments.
Other key sources:
- Financial disclosures
- Industry associations and trade bodies
- News outlets and business magazines
- Academic journals and research studies
- Paid industry databases
Primary Research
To validate secondary data and gain deeper market insights, primary research was conducted with key stakeholders across both the supply and demand sides of the market.
On the demand side, participants included decision-makers and influencers from end-user industries—such as CIOs, CTOs, and CSOs—who provided first-hand perspectives on market needs, product usage, and future expectations.
On the supply side, interviews were conducted with manufacturers, industry associations, and institutional participants to gather insights into current offerings, product pipelines, and market challenges.
Primary interviews provided critical inputs such as:
- Market size and revenue data
- Product and service breakdowns
- Market forecasts
- Regional and application-specific trends
Stakeholders consulted included:
- Leading OEM and solution providers
- Channel and distribution partners
- End users across various applications
- Independent consultants and industry specialists
Market Size Estimation and Data Triangulation
- Identifying Key Market Participants (Secondary Research)
- Goal: To identify the major players or companies in the target market. This typically involves using publicly available data sources such as industry reports, market research publications, and financial statements of companies.
- Tools: Reports from firms like Gartner, Forrester, Euromonitor, Statista, IBISWorld, and others. Public financial statements, news articles, and press releases from top market players.
- Extracting Earnings of Key Market Participants
- Goal: To estimate the earnings generated from the product or service being analyzed. This step helps in understanding the revenue potential of each market player in a specific geography.
- Methods: Earnings data can be gathered from:
- Publicly available financial reports (for listed companies).
- Interviews and primary data sources from professionals, such as Directors, VPs, SVPs, etc. This is especially useful for understanding more nuanced, internal data that isn't publicly disclosed.
- Annual reports and investor presentations of key players.
- Data Collation and Development of a Relevant Data Model
- Goal: To collate inputs from both primary and secondary sources into a structured, data-driven model for market estimation. This model will incorporate key market KPIs and any independent variables relevant to the market.
- Key KPIs: These could include:
- Market size, growth rate, and demand drivers.
- Industry-specific metrics like market share, average revenue per customer (ARPC), or average deal size.
- External variables, such as economic growth rates, inflation rates, or commodity prices, that could affect the market.
- Data Modeling: Based on this data, the market forecasts are developed for the next 5 years. A combination of trend analysis, scenario modeling, and statistical regression might be used to generate projections.
- Scenario Analysis
- Goal: To test different assumptions and validate how sensitive the market is to changes in key variables (e.g., market demand, regulatory changes, technological disruptions).
- Types of Scenarios:
- Base Case: Based on current assumptions and historical data.
- Best-Case Scenario: Assuming favorable market conditions, regulatory environments, and technological advancements.
- Worst-Case Scenario: Accounting for adverse factors, such as economic downturns, stricter regulations, or unexpected disruptions.


