Poland Alcoholic Drinks Market Report: Trends, Growth and Forecast (2026-2032)
By Type (Beer, Cider/Perry, RTDs, Spirits, Wine), By Alcohol Content (High, Medium, Low), By Flavor (Unflavored, Flavored), By Packaging Type (Glass Bottles, Tins, Plastic Bottles, Others), By Sales Channel (On-Trade, Off-Trade (Retail Offline, Retail Online)) ... Read more

|
Major Players
|
Poland Alcoholic Drinks Market Statistics and Insights, 2026
- Market Size Statistics
- Alcoholic Drinks in Poland is estimated at $ 18.6 Billion.
- The market size is expected to grow to $ 19.58 Billion by 2032.
- Market to register a CAGR of around 0.74% during 2026-32.
- Type Shares
- Beer grabbed market share of 45%.
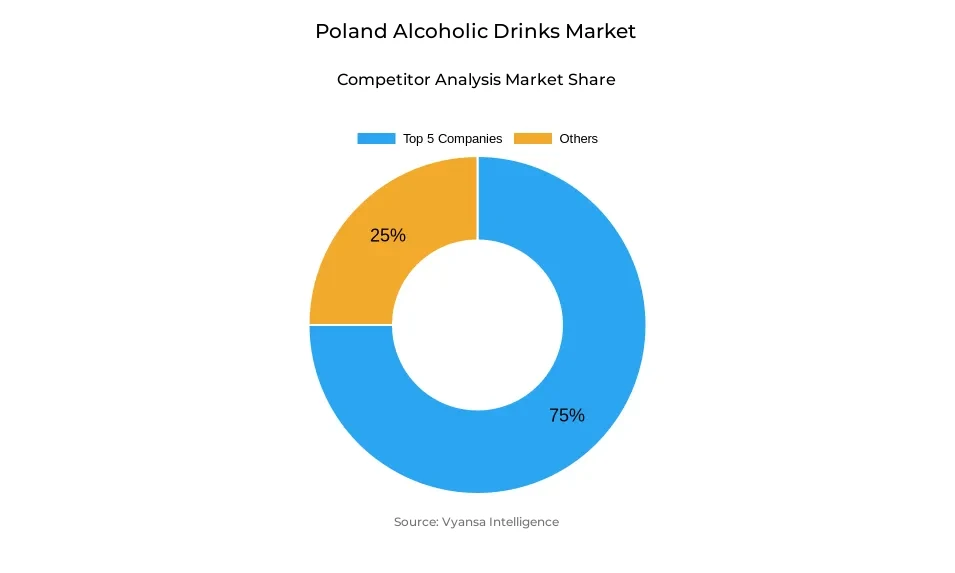
- Competition
- More than 10 companies are actively engaged in producing Alcoholic Drinks in Poland.
- Top 5 companies acquired 75% of the market share.
- Stock Spirits Group, Perla Browary Lubelskie SA, Sektkellerei Schloss Wachenheim AG, Asahi Group Holdings Ltd, Heineken NV etc., are few of the top companies.
- Sales Channel
- Off-Trade grabbed 75% of the market.
Poland Alcoholic Drinks Market Outlook
Poland Alcoholic Drinks Market market is projected at $18.6 billion in 2026 and will continue to grow steadily, reaching $19.58 billion by 2032. Even though total volume sales have been gradually declining in recent years, the market is likely to see modest value growth because end users are increasingly moving towards premium and better-quality products, even though they may be consumed in smaller quantities. Healthy trends and increasing demand for low- and non-alcoholic drinks are likely to influence buying habits, especially among younger end users who are inclined towards lower-alcohol and flavoured drinks.
Beer is expected to retain its predominant share, with regular lager being the big winner thanks to its low price, popularity, and extensive distribution. Spirit-based RTDs and non-alcoholic spirits are expected to have robust growth as end users look for easy-to-consume, tasty, and lower-strength alternatives. Non-alcohol and low-strength beer, wine, and spirits will be a key segment, with manufacturers investing in new taste variants, lower sugar levels, and innovative packaging to appeal to health-conscious end users.
The off-trade route will continue to prevail, taking around 75% of the market, as customers more and more opt for buying Alcoholic Drinks Market in stores because of price and convenience. Discounters will also continue to be in vogue for low-end end users, while online shopping will steadily increase as e-commerce pickup increases despite difficulties posed by regulation regarding age checks and the sale of alcohol online. The on-trade channel will most likely see steady recovery, fueled by tourism expansion, premiumisation, and increasing demand for craft, artisanal, and high-quality items in restaurants and bars.
Manufacturers and distributors will prioritize sustainability and good practices, like green packaging and carbon footprint reductions, to address increasing end users demands. Expenditure on innovative product ranges, including low-calorie and low-sugar beers, flavoured spirits, and alcohol-free options, will power market expansion. Overall, the Polish Alcoholic Drinks Market market is poised for steady value development, led by premiumisation, healthy consumption, and changing retail trends, despite the continued decline in total volume.
Poland Alcoholic Drinks Market Growth Driver
Health Conscious Lifestyles
Increased health awareness among Polish end users is influencing the alcoholic drinks market. There are more individuals looking after their wellbeing and adverse effects of drinking too much alcohol. It promotes responsible consumption behavior, leading numerous end users to cut back on their alcohol consumption or resort to lower-alcohol and non-Alcoholic Drinks Market.
Dietary restraint, exercise, and health awareness influence consumption patterns importantly. Younger generations are more concerned with alcohol's effects, whereas health is the concern for older generations with changing priorities through life stages. This change in end users behavior favorably impacts low-alcohol and non-alcoholic product development, driving innovation and change by producers to respond to changing tastes.
Poland Alcoholic Drinks Market Trend
Emergence of No/Low Alcohol Drinks
NoLo trend, including low-alcohol and non-alcoholic drinks, is influencing the Polish market of Alcoholic Drinks Market. Younger end users opt more and more for healthy lifestyle choices, taking up challenges such as Dry January or Sober October. The trend supports the development of non-alcoholic beer, wine, spirits, and innovative mocktails in restaurants and bars.
The enhanced taste and quality of these drinks make them more attractive, permitting end users to indulge in classic drinks with reduced alcohol levels. The industry is presenting innovative and tasty alternatives to address this emerging need. This trend also corresponds to the bigger movement toward responsible drinking, fueling product development and shaping market forces.
Unlock Market Intelligence
Explore the market potential with our data-driven report
Poland Alcoholic Drinks Market Opportunity
Premium and Craft Offerings
The premium and craft alcohol market is anticipated to provide immense opportunities for growth. end users are becoming ready to pay more for better-quality drinks in reduced quantities, emphasizing taste, individuality, and rarity. Local and artisanal brands, such as house-distilled spirits and craft beer, can capitalize on this changing end users appetite.
Manufacturers and distributors will have the chance to innovate flavors, premium products, and differentiated packaging to appeal to discerning tastes. Investing in quality products, while ensuring responsible and sustainable production, will enable companies to build brand loyalty and gain a competitive advantage in a market transitioning from quantity to quality.
Unlock Market Intelligence
Explore the market potential with our data-driven report
Poland Alcoholic Drinks Market Segmentation Analysis

By Type
- Beer
- Cider/Perry
- RTDs
- Spirits
- Wine
The segment with highest market share under Type segment is beer, which captured 45% of the market. Beer is the strongest-selling alcoholic beverage in Poland due to the supremacy of regular lager. Its affordability, extensive distribution, and well-known flavor render it the most favored by most end users. Major breweries invest greatly in promoting their brands to achieve prominent exposure in retail outlets, bars, and restaurants nationwide. Specialty beers, flavored beers, and non-alcohol choices are also picking up recognition, meeting changing end users' demands for variety and reduced alcohol levels.
Other Alcoholic Drinks Market, like spirits, wine, cider/perry, and Ready-to-Drink (RTD) drinks, have smaller portions but are witnessing significant growth. RTDs specifically are popular with today's end users in their quest for easy, enjoyable, and varied choices, often with less alcohol. Low-alcohol and non-alcoholic products are also gaining traction because of the increasing health awareness among Polish end users.
By Sales Channel
- On-Trade
- Off-Trade
The segment with highest market share under Sales Channel segment is Off-Trade, which has a market share of 75%. Retail channels like supermarkets, hypermarkets, discounters, and convenience stores are the alcohol-selling powerhouse in Poland. Customers opt to purchase Alcoholic Drinks Market in such stores since they are cheaper, convenient, and there are always promotions. The discounters, for example, Lidl and Biedronka, have a very significant role where they appeal to price-conscious customers via discounts and special offers.
On-trade channels, including bars, restaurants, and hotels, represent a lower proportion of sales but are slowly catching up with trends such as premiumisation and non-alcoholic options. Although increasing prices and lifestyle trends have propelled many end users into Off-Trade, bars and restaurants keep innovating with craft cocktails, non-Alcoholic Drinks Market, and premium spirits to entice a niche audience. Off-Trade's growth is also being driven by e-commerce growth, where end users can buy Alcoholic Drinks Market conveniently online.
Top Companies in Poland Alcoholic Drinks Market
The top companies operating in the market include Stock Spirits Group, Perla Browary Lubelskie SA, Sektkellerei Schloss Wachenheim AG, Asahi Group Holdings Ltd, Heineken NV, Carlsberg A/S, Van Pur SA, Maspex Wadowice Grupa, Pernod Ricard Groupe, Paulaner Brauerei GmbH & Co KG, etc., are the top players operating in the Poland Alcoholic Drinks Market.
Frequently Asked Questions
Related Report
1. Market Segmentation
1.1. Research Scope
1.2. Research Methodology
1.3. Definitions and Assumptions
2. Executive Summary
3. Poland Alcoholic Drinks Market Policies, Regulations, and Standards
4. Poland Alcoholic Drinks Market Dynamics
4.1. Growth Factors
4.2. Challenges
4.3. Trends
4.4. Opportunities
5. Poland Alcoholic Drinks Market Statistics, 2022-2032F
5.1. Market Size & Growth Outlook
5.1.1. By Revenues in US$ Million
5.1.2. By Quantity Sold in Million Litres
5.2. Market Segmentation & Growth Outlook
5.2.1. By Type
5.2.1.1. Beer- Market Insights and Forecast 2022-2032, USD Million
5.2.1.2. Cider/Perry- Market Insights and Forecast 2022-2032, USD Million
5.2.1.3. RTDs- Market Insights and Forecast 2022-2032, USD Million
5.2.1.4. Spirits- Market Insights and Forecast 2022-2032, USD Million
5.2.1.5. Wine- Market Insights and Forecast 2022-2032, USD Million
5.2.2. By Alcohol Content
5.2.2.1. High- Market Insights and Forecast 2022-2032, USD Million
5.2.2.2. Medium- Market Insights and Forecast 2022-2032, USD Million
5.2.2.3. Low- Market Insights and Forecast 2022-2032, USD Million
5.2.3. By Flavor
5.2.3.1. Unflavored- Market Insights and Forecast 2022-2032, USD Million
5.2.3.2. Flavored- Market Insights and Forecast 2022-2032, USD Million
5.2.4. By Packaging Type
5.2.4.1. Glass Bottles- Market Insights and Forecast 2022-2032, USD Million
5.2.4.2. Tins- Market Insights and Forecast 2022-2032, USD Million
5.2.4.3. Plastic Bottles- Market Insights and Forecast 2022-2032, USD Million
5.2.4.4. Others- Market Insights and Forecast 2022-2032, USD Million
5.2.5. By Sales Channel
5.2.5.1. On-Trade- Market Insights and Forecast 2022-2032, USD Million
5.2.5.2. Off-Trade- Market Insights and Forecast 2022-2032, USD Million
5.2.5.2.1. Retail Offline- Market Insights and Forecast 2022-2032, USD Million
5.2.5.2.2. Retail Online- Market Insights and Forecast 2022-2032, USD Million
5.2.6. By Competitors
5.2.6.1. Competition Characteristics
5.2.6.2. Market Share & Analysis
6. Poland Beer Market Statistics, 2022-2032F
6.1. Market Size & Growth Outlook
6.1.1. By Revenues in US$ Million
6.1.2. By Quantity Sold in Million Litres
6.2. Market Segmentation & Growth Outlook
6.2.1. By Alcohol Content- Market Insights and Forecast 2022-2032, USD Million
6.2.2. By Flavor- Market Insights and Forecast 2022-2032, USD Million
6.2.3. By Packaging Type- Market Insights and Forecast 2022-2032, USD Million
6.2.4. By Sales Channel- Market Insights and Forecast 2022-2032, USD Million
7. Poland Cider/Perry Market Statistics, 2022-2032F
7.1. Market Size & Growth Outlook
7.1.1. By Revenues in US$ Million
7.1.2. By Quantity Sold in Million Litres
7.2. Market Segmentation & Growth Outlook
7.2.1. By Alcohol Content- Market Insights and Forecast 2022-2032, USD Million
7.2.2. By Flavor- Market Insights and Forecast 2022-2032, USD Million
7.2.3. By Packaging Type- Market Insights and Forecast 2022-2032, USD Million
7.2.4. By Sales Channel- Market Insights and Forecast 2022-2032, USD Million
8. Poland Ready-to-Drink Market Statistics, 2022-2032F
8.1. Market Size & Growth Outlook
8.1.1. By Revenues in US$ Million
8.1.2. By Quantity Sold in Million Litres
8.2. Market Segmentation & Growth Outlook
8.2.1. By Alcohol Content- Market Insights and Forecast 2022-2032, USD Million
8.2.2. By Flavor- Market Insights and Forecast 2022-2032, USD Million
8.2.3. By Packaging Type- Market Insights and Forecast 2022-2032, USD Million
8.2.4. By Sales Channel- Market Insights and Forecast 2022-2032, USD Million
9. Poland Spirits Market Statistics, 2022-2032F
9.1. Market Size & Growth Outlook
9.1.1. By Revenues in US$ Million
9.1.2. By Quantity Sold in Million Litres
9.2. Market Segmentation & Growth Outlook
9.2.1. By Alcohol Content- Market Insights and Forecast 2022-2032, USD Million
9.2.2. By Flavor- Market Insights and Forecast 2022-2032, USD Million
9.2.3. By Packaging Type- Market Insights and Forecast 2022-2032, USD Million
9.2.4. By Sales Channel- Market Insights and Forecast 2022-2032, USD Million
10. Poland Wine Market Statistics, 2022-2032F
10.1.Market Size & Growth Outlook
10.1.1. By Revenues in US$ Million
10.1.2. By Quantity Sold in Million Litres
10.2.Market Segmentation & Growth Outlook
10.2.1. By Alcohol Content- Market Insights and Forecast 2022-2032, USD Million
10.2.2. By Flavor- Market Insights and Forecast 2022-2032, USD Million
10.2.3. By Packaging Type- Market Insights and Forecast 2022-2032, USD Million
10.2.4. By Sales Channel- Market Insights and Forecast 2022-2032, USD Million
11. Competitive Outlook
11.1.Company Profiles
11.1.1. Asahi Group Holdings Ltd
11.1.1.1. Business Description
11.1.1.2. Product Portfolio
11.1.1.3. Collaborations & Alliances
11.1.1.4. Recent Developments
11.1.1.5. Financial Details
11.1.1.6. Others
11.1.2. Heineken NV
11.1.2.1. Business Description
11.1.2.2. Product Portfolio
11.1.2.3. Collaborations & Alliances
11.1.2.4. Recent Developments
11.1.2.5. Financial Details
11.1.2.6. Others
11.1.3. Carlsberg A/S
11.1.3.1. Business Description
11.1.3.2. Product Portfolio
11.1.3.3. Collaborations & Alliances
11.1.3.4. Recent Developments
11.1.3.5. Financial Details
11.1.3.6. Others
11.1.4. Van Pur SA
11.1.4.1. Business Description
11.1.4.2. Product Portfolio
11.1.4.3. Collaborations & Alliances
11.1.4.4. Recent Developments
11.1.4.5. Financial Details
11.1.4.6. Others
11.1.5. Maspex Wadowice Grupa
11.1.5.1. Business Description
11.1.5.2. Product Portfolio
11.1.5.3. Collaborations & Alliances
11.1.5.4. Recent Developments
11.1.5.5. Financial Details
11.1.5.6. Others
11.1.6. Stock Spirits Group
11.1.6.1. Business Description
11.1.6.2. Product Portfolio
11.1.6.3. Collaborations & Alliances
11.1.6.4. Recent Developments
11.1.6.5. Financial Details
11.1.6.6. Others
11.1.7. Perla Browary Lubelskie SA
11.1.7.1. Business Description
11.1.7.2. Product Portfolio
11.1.7.3. Collaborations & Alliances
11.1.7.4. Recent Developments
11.1.7.5. Financial Details
11.1.7.6. Others
11.1.8. Sektkellerei Schloss Wachenheim AG
11.1.8.1. Business Description
11.1.8.2. Product Portfolio
11.1.8.3. Collaborations & Alliances
11.1.8.4. Recent Developments
11.1.8.5. Financial Details
11.1.8.6. Others
11.1.9. Pernod Ricard Groupe
11.1.9.1. Business Description
11.1.9.2. Product Portfolio
11.1.9.3. Collaborations & Alliances
11.1.9.4. Recent Developments
11.1.9.5. Financial Details
11.1.9.6. Others
11.1.10. Paulaner Brauerei GmbH & Co KG
11.1.10.1. Business Description
11.1.10.2. Product Portfolio
11.1.10.3. Collaborations & Alliances
11.1.10.4. Recent Developments
11.1.10.5. Financial Details
11.1.10.6. Others
12. Disclaimer
| Segment | Sub-Segment |
|---|---|
| By Type |
|
| By Alcohol Content |
|
| By Flavor |
|
| By Packaging Type |
|
| By Sales Channel |
|
Research Methodology
This study followed a structured approach comprising four key phases to assess the size and scope of the electro-oxidation market. The process began with thorough secondary research to collect data on the target market, related markets, and broader industry context. These findings, along with preliminary assumptions and estimates, were then validated through extensive primary research involving industry experts from across the value chain. To calculate the overall market size, both top-down and bottom-up methodologies were employed. Finally, market segmentation and data triangulation techniques were applied to refine and validate segment-level estimations.
Secondary Research
The secondary research phase involved gathering data from a wide range of credible and published sources. This step helped in identifying industry trends, defining market segmentation, and understanding the market landscape and value chain.
Sources consulted during this phase included:
- Company annual reports, investor presentations, and press releases
- Industry white papers and certified publications
- Trade directories and market-recognized databases
- Articles from authoritative authors and reputable journals
- Gold and silver standard websites
Secondary research was critical in mapping out the industry's value chain and monetary flow, identifying key market segments, understanding regional variations, and tracking significant industry developments.
Other key sources:
- Financial disclosures
- Industry associations and trade bodies
- News outlets and business magazines
- Academic journals and research studies
- Paid industry databases
Primary Research
To validate secondary data and gain deeper market insights, primary research was conducted with key stakeholders across both the supply and demand sides of the market.
On the demand side, participants included decision-makers and influencers from end-user industries—such as CIOs, CTOs, and CSOs—who provided first-hand perspectives on market needs, product usage, and future expectations.
On the supply side, interviews were conducted with manufacturers, industry associations, and institutional participants to gather insights into current offerings, product pipelines, and market challenges.
Primary interviews provided critical inputs such as:
- Market size and revenue data
- Product and service breakdowns
- Market forecasts
- Regional and application-specific trends
Stakeholders consulted included:
- Leading OEM and solution providers
- Channel and distribution partners
- End users across various applications
- Independent consultants and industry specialists
Market Size Estimation and Data Triangulation
- Identifying Key Market Participants (Secondary Research)
- Goal: To identify the major players or companies in the target market. This typically involves using publicly available data sources such as industry reports, market research publications, and financial statements of companies.
- Tools: Reports from firms like Gartner, Forrester, Euromonitor, Statista, IBISWorld, and others. Public financial statements, news articles, and press releases from top market players.
- Extracting Earnings of Key Market Participants
- Goal: To estimate the earnings generated from the product or service being analyzed. This step helps in understanding the revenue potential of each market player in a specific geography.
- Methods: Earnings data can be gathered from:
- Publicly available financial reports (for listed companies).
- Interviews and primary data sources from professionals, such as Directors, VPs, SVPs, etc. This is especially useful for understanding more nuanced, internal data that isn't publicly disclosed.
- Annual reports and investor presentations of key players.
- Data Collation and Development of a Relevant Data Model
- Goal: To collate inputs from both primary and secondary sources into a structured, data-driven model for market estimation. This model will incorporate key market KPIs and any independent variables relevant to the market.
- Key KPIs: These could include:
- Market size, growth rate, and demand drivers.
- Industry-specific metrics like market share, average revenue per customer (ARPC), or average deal size.
- External variables, such as economic growth rates, inflation rates, or commodity prices, that could affect the market.
- Data Modeling: Based on this data, the market forecasts are developed for the next 5 years. A combination of trend analysis, scenario modeling, and statistical regression might be used to generate projections.
- Scenario Analysis
- Goal: To test different assumptions and validate how sensitive the market is to changes in key variables (e.g., market demand, regulatory changes, technological disruptions).
- Types of Scenarios:
- Base Case: Based on current assumptions and historical data.
- Best-Case Scenario: Assuming favorable market conditions, regulatory environments, and technological advancements.
- Worst-Case Scenario: Accounting for adverse factors, such as economic downturns, stricter regulations, or unexpected disruptions.


