Philippines Alcoholic Drinks Market Report: Trends, Growth and Forecast (2026-2032)
By Type (Beer, Cider/Perry, RTDs, Spirits, Wine), By Alcohol Content (High, Medium, Low), By Flavor (Unflavored, Flavored), By Packaging Type (Glass Bottles, Tins, Plastic Bottles, Others), By Sales Channel (On-Trade, Off-Trade (Retail Offline, Retail Online)) ... Read more

|
Major Players
|
Philippines Alcoholic Drinks Market Statistics and Insights, 2026
- Market Size Statistics
- Alcoholic Drinks in Philippines is estimated at $ 10.58 Billion.
- The market size is expected to grow to $ 15.93 Billion by 2032.
- Market to register a CAGR of around 6.02% during 2026-32.
- Type Shares
- Beer grabbed market share of 55%.
- Beer to witness a volume CAGR of around 5.26%.
- Competition
- More than 10 companies are actively engaged in producing Alcoholic Drinks in Philippines.
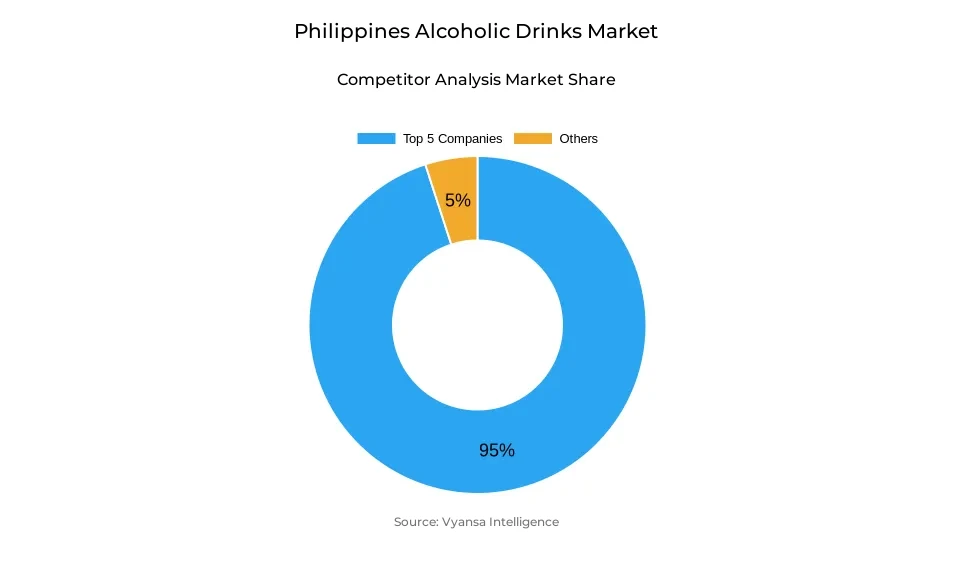
- Top 5 companies acquired 95% of the market share.
- Bel Mondo Italia Corp, Suntory Holdings Ltd, Diageo Plc, San Miguel Corp, Tanduay Distillers Inc etc., are few of the top companies.
- Sales Channel
- Off-Trade grabbed 70% of the market.
Philippines Alcoholic Drinks Market Outlook
Philippines Alcoholic Drinks will experience stable growth during the forecast period, with the market valued at $10.58 billion and projected to reach $15.93 billion by 2032. Off-trade is the leading sales channel and holds 70% market share as end users stick to using retail stores, including small local grocery stores and supermarkets, for their daily shopping. Convenience retailers and online channels are slowly picking up pace, fueled by incentives and the surging need for home delivery.
Beer will remain the biggest category by volume, commanding 55% of the market and set to experience a volume CAGR of approximately 5.26%. Mid-prices lagers will continue to have appeal among Philippiness, whilst premium and craft beer alternatives are likely to expand in tandem with increasing end users desire for more quality products. The shift towards at-home consumption of cases of beer is set to continue, buoyed by improving disposable incomes and urban living.
Spirits and RTDs are also expected to experience robust growth, with players such as Ginebra San Miguel, Emperador Distillers, and Asia Brewery broadening brand portfolios and riding marketing campaigns. Spirit-based RTDs will get attention and traction, especially among young end users trying new flavours and healthier alternatives. The trend towards premiumisation is also likely to boost spirits, with end users opting for quality experiences over quantity.
Low-alcohol and non-Alcoholic Drinks will become a bigger part of the marketplace. As health and wellbeing become increasingly well known, players like Coca-Cola Beverages Philippines Inc and PepsiCo Products Philippines Inc will be able to build out their lines of wine, beer, and RTDs. The trend of being "sober curious," which is prevalent among young adults, will propel the use of these substitutes, as well as supplement the classic Alcoholic Drinks and boost the entire market.
Philippines Alcoholic Drinks Market Growth Driver
Increasing Spending Power
Increased end users income and better economic conditions are fueling alcoholic beverage market growth. end users are becoming more confident in spending on a range of alcoholic drinks, from beer to luxury spirits and RTDs. Increased spending power enables businesses to increase distribution and carry an extended product range, satisfying changing end users needs.
Marketing activity is most important in reinforcing consumption. Traditional and digital media campaigns, together with brand experiences and experiential events in eating-out establishments, resound with end users interest and involvement. The nexus of economic expansion and compelling marketing reinforcement delivers consistent demand through the market.
Philippines Alcoholic Drinks Market Trend
Premiumisation and Variety
Philippines end users are now looking for premium Alcoholic Drinks and craft options. This movement is a call for different flavors, quality ingredients, and sophisticated consumption experience. Spirits, craft beers, and specialty RTDs are gaining popularity due to the willingness of end users to spend more for perceived value and uniqueness.
Distribution and marketing strategies are changing to accommodate this trend. Bars, restaurants, and on-trade venues are advertising premium beverages via cocktail menus, competitions, and experiential promotions. Businesses are also launching innovative RTDs and non-alcoholic options to appeal to drinkers who are looking for new and varied drinking experience.
Unlock Market Intelligence
Explore the market potential with our data-driven report
Philippines Alcoholic Drinks Market Opportunity
Expansion in Non-Alcoholic and Low-Alcohol Options
The increasing popularity of health-aware lifestyles offers a future prospect for alcoholic beverage firms. end users will likely continuously look into non-alcoholic beers, wines, and spirit-based RTDs, fueling the development of new products and category growth.
Firms can capitalize on this trend by introducing new non-alcoholic and low-alcohol beverages and increasing marketing efforts to reach the "sober curious" segment. Diversifying portfolios in this direction will enable brands to tap into health-oriented end users, consolidate market share, and distinguish themselves from the competition. Throughout the forecast period, non-alcoholic products will increasingly contribute to overall growth in the market.
Unlock Market Intelligence
Explore the market potential with our data-driven report
Philippines Alcoholic Drinks Market Segmentation Analysis

By Type
- Beer
- Cider/Perry
- RTDs
- Spirits
- Wine
The segment with highest market share under Type segment is beer, which has a 55% share of the Alcoholic Drinks market in the Philippines. Beer continues to be the end users favorite because it's cheap, easily available and prevalent across both off-trade and on-trade outlets. Domestic mid-priced lagers continue to reign supreme through extensive marketing and distribution efforts by major players such as San Miguel Brewery and Ginebra San Miguel.
During the forecast period, beer will post a volume CAGR of approximately 5.26%. Increased in-home drinking, persistent brand promotion, and end users favor for known, dependable beer brands will stimulate growth. Although premium beers and craft offerings are gaining ground, mid-level lagers will continue to hold the largest segment, solidifying beer as the fulcrum of the Philippines' alcoholic beverage market.
By Sales Channel
- On-Trade
- Off-Trade
The segment with highest market share under Sales Channel is off-trade, with 70% share of the total alcoholic beverage market. Small neighborhood grocer shops, supermarkets, and convenience outlets are major players, offering convenient access to vast selections of beer, spirits, wine, and RTDs. Sari-sari stores continue to be culturally and economically strong, particularly for day-to-day purchases and middle-priced items.
Off-trade expansion will persist through the forecasting period, driven by higher end users expenditure and urbanization. Supermarkets and convenience stores will be favored through promotional programs, multipack volumes, and increased product assortment. On-trade channels may become more popular for premium and social consumption, yet off-trade will be the leading channel because of its convenience, value, and availability throughout the Philippines.
Top Companies in Philippines Alcoholic Drinks Market
The top companies operating in the market include Bel Mondo Italia Corp, Suntory Holdings Ltd, Diageo Plc, San Miguel Corp, Tanduay Distillers Inc, Alliance Global Group Inc, Asia Brewery Inc, AR Valdespino SA, Emperador Distillers Inc, Hite Jinro Co Ltd, etc., are the top players operating in the Philippines Alcoholic Drinks Market.
Frequently Asked Questions
Related Report
1. Market Segmentation
1.1. Research Scope
1.2. Research Methodology
1.3. Definitions and Assumptions
2. Executive Summary
3. Philippines Alcoholic Drinks Market Policies, Regulations, and Standards
4. Philippines Alcoholic Drinks Market Dynamics
4.1. Growth Factors
4.2. Challenges
4.3. Trends
4.4. Opportunities
5. Philippines Alcoholic Drinks Market Statistics, 2022-2032F
5.1. Market Size & Growth Outlook
5.1.1. By Revenues in US$ Million
5.1.2. By Quantity Sold in Million Litres
5.2. Market Segmentation & Growth Outlook
5.2.1. By Type
5.2.1.1. Beer- Market Insights and Forecast 2022-2032, USD Million
5.2.1.2. Cider/Perry- Market Insights and Forecast 2022-2032, USD Million
5.2.1.3. RTDs- Market Insights and Forecast 2022-2032, USD Million
5.2.1.4. Spirits- Market Insights and Forecast 2022-2032, USD Million
5.2.1.5. Wine- Market Insights and Forecast 2022-2032, USD Million
5.2.2. By Alcohol Content
5.2.2.1. High- Market Insights and Forecast 2022-2032, USD Million
5.2.2.2. Medium- Market Insights and Forecast 2022-2032, USD Million
5.2.2.3. Low- Market Insights and Forecast 2022-2032, USD Million
5.2.3. By Flavor
5.2.3.1. Unflavored- Market Insights and Forecast 2022-2032, USD Million
5.2.3.2. Flavored- Market Insights and Forecast 2022-2032, USD Million
5.2.4. By Packaging Type
5.2.4.1. Glass Bottles- Market Insights and Forecast 2022-2032, USD Million
5.2.4.2. Tins- Market Insights and Forecast 2022-2032, USD Million
5.2.4.3. Plastic Bottles- Market Insights and Forecast 2022-2032, USD Million
5.2.4.4. Others- Market Insights and Forecast 2022-2032, USD Million
5.2.5. By Sales Channel
5.2.5.1. On-Trade- Market Insights and Forecast 2022-2032, USD Million
5.2.5.2. Off-Trade- Market Insights and Forecast 2022-2032, USD Million
5.2.5.2.1. Retail Offline- Market Insights and Forecast 2022-2032, USD Million
5.2.5.2.2. Retail Online- Market Insights and Forecast 2022-2032, USD Million
5.2.6. By Competitors
5.2.6.1. Competition Characteristics
5.2.6.2. Market Share & Analysis
6. Philippines Beer Market Statistics, 2022-2032F
6.1. Market Size & Growth Outlook
6.1.1. By Revenues in US$ Million
6.1.2. By Quantity Sold in Million Litres
6.2. Market Segmentation & Growth Outlook
6.2.1. By Alcohol Content- Market Insights and Forecast 2022-2032, USD Million
6.2.2. By Flavor- Market Insights and Forecast 2022-2032, USD Million
6.2.3. By Packaging Type- Market Insights and Forecast 2022-2032, USD Million
6.2.4. By Sales Channel- Market Insights and Forecast 2022-2032, USD Million
7. Philippines Cider/Perry Market Statistics, 2022-2032F
7.1. Market Size & Growth Outlook
7.1.1. By Revenues in US$ Million
7.1.2. By Quantity Sold in Million Litres
7.2. Market Segmentation & Growth Outlook
7.2.1. By Alcohol Content- Market Insights and Forecast 2022-2032, USD Million
7.2.2. By Flavor- Market Insights and Forecast 2022-2032, USD Million
7.2.3. By Packaging Type- Market Insights and Forecast 2022-2032, USD Million
7.2.4. By Sales Channel- Market Insights and Forecast 2022-2032, USD Million
8. Philippines Ready-to-Drink Market Statistics, 2022-2032F
8.1. Market Size & Growth Outlook
8.1.1. By Revenues in US$ Million
8.1.2. By Quantity Sold in Million Litres
8.2. Market Segmentation & Growth Outlook
8.2.1. By Alcohol Content- Market Insights and Forecast 2022-2032, USD Million
8.2.2. By Flavor- Market Insights and Forecast 2022-2032, USD Million
8.2.3. By Packaging Type- Market Insights and Forecast 2022-2032, USD Million
8.2.4. By Sales Channel- Market Insights and Forecast 2022-2032, USD Million
9. Philippines Spirits Market Statistics, 2022-2032F
9.1. Market Size & Growth Outlook
9.1.1. By Revenues in US$ Million
9.1.2. By Quantity Sold in Million Litres
9.2. Market Segmentation & Growth Outlook
9.2.1. By Alcohol Content- Market Insights and Forecast 2022-2032, USD Million
9.2.2. By Flavor- Market Insights and Forecast 2022-2032, USD Million
9.2.3. By Packaging Type- Market Insights and Forecast 2022-2032, USD Million
9.2.4. By Sales Channel- Market Insights and Forecast 2022-2032, USD Million
10. Philippines Wine Market Statistics, 2022-2032F
10.1.Market Size & Growth Outlook
10.1.1. By Revenues in US$ Million
10.1.2. By Quantity Sold in Million Litres
10.2.Market Segmentation & Growth Outlook
10.2.1. By Alcohol Content- Market Insights and Forecast 2022-2032, USD Million
10.2.2. By Flavor- Market Insights and Forecast 2022-2032, USD Million
10.2.3. By Packaging Type- Market Insights and Forecast 2022-2032, USD Million
10.2.4. By Sales Channel- Market Insights and Forecast 2022-2032, USD Million
11. Competitive Outlook
11.1.Company Profiles
11.1.1. San Miguel Corp
11.1.1.1. Business Description
11.1.1.2. Product Portfolio
11.1.1.3. Collaborations & Alliances
11.1.1.4. Recent Developments
11.1.1.5. Financial Details
11.1.1.6. Others
11.1.2. Tanduay Distillers Inc
11.1.2.1. Business Description
11.1.2.2. Product Portfolio
11.1.2.3. Collaborations & Alliances
11.1.2.4. Recent Developments
11.1.2.5. Financial Details
11.1.2.6. Others
11.1.3. Alliance Global Group Inc
11.1.3.1. Business Description
11.1.3.2. Product Portfolio
11.1.3.3. Collaborations & Alliances
11.1.3.4. Recent Developments
11.1.3.5. Financial Details
11.1.3.6. Others
11.1.4. Asia Brewery Inc
11.1.4.1. Business Description
11.1.4.2. Product Portfolio
11.1.4.3. Collaborations & Alliances
11.1.4.4. Recent Developments
11.1.4.5. Financial Details
11.1.4.6. Others
11.1.5. AR Valdespino SA
11.1.5.1. Business Description
11.1.5.2. Product Portfolio
11.1.5.3. Collaborations & Alliances
11.1.5.4. Recent Developments
11.1.5.5. Financial Details
11.1.5.6. Others
11.1.6. Bel Mondo Italia Corp
11.1.6.1. Business Description
11.1.6.2. Product Portfolio
11.1.6.3. Collaborations & Alliances
11.1.6.4. Recent Developments
11.1.6.5. Financial Details
11.1.6.6. Others
11.1.7. Suntory Holdings Ltd
11.1.7.1. Business Description
11.1.7.2. Product Portfolio
11.1.7.3. Collaborations & Alliances
11.1.7.4. Recent Developments
11.1.7.5. Financial Details
11.1.7.6. Others
11.1.8. Diageo Plc
11.1.8.1. Business Description
11.1.8.2. Product Portfolio
11.1.8.3. Collaborations & Alliances
11.1.8.4. Recent Developments
11.1.8.5. Financial Details
11.1.8.6. Others
11.1.9. Emperador Distillers Inc
11.1.9.1. Business Description
11.1.9.2. Product Portfolio
11.1.9.3. Collaborations & Alliances
11.1.9.4. Recent Developments
11.1.9.5. Financial Details
11.1.9.6. Others
11.1.10. Hite Jinro Co Ltd
11.1.10.1. Business Description
11.1.10.2. Product Portfolio
11.1.10.3. Collaborations & Alliances
11.1.10.4. Recent Developments
11.1.10.5. Financial Details
11.1.10.6. Others
12. Disclaimer
| Segment | Sub-Segment |
|---|---|
| By Type |
|
| By Alcohol Content |
|
| By Flavor |
|
| By Packaging Type |
|
| By Sales Channel |
|
Research Methodology
This study followed a structured approach comprising four key phases to assess the size and scope of the electro-oxidation market. The process began with thorough secondary research to collect data on the target market, related markets, and broader industry context. These findings, along with preliminary assumptions and estimates, were then validated through extensive primary research involving industry experts from across the value chain. To calculate the overall market size, both top-down and bottom-up methodologies were employed. Finally, market segmentation and data triangulation techniques were applied to refine and validate segment-level estimations.
Secondary Research
The secondary research phase involved gathering data from a wide range of credible and published sources. This step helped in identifying industry trends, defining market segmentation, and understanding the market landscape and value chain.
Sources consulted during this phase included:
- Company annual reports, investor presentations, and press releases
- Industry white papers and certified publications
- Trade directories and market-recognized databases
- Articles from authoritative authors and reputable journals
- Gold and silver standard websites
Secondary research was critical in mapping out the industry's value chain and monetary flow, identifying key market segments, understanding regional variations, and tracking significant industry developments.
Other key sources:
- Financial disclosures
- Industry associations and trade bodies
- News outlets and business magazines
- Academic journals and research studies
- Paid industry databases
Primary Research
To validate secondary data and gain deeper market insights, primary research was conducted with key stakeholders across both the supply and demand sides of the market.
On the demand side, participants included decision-makers and influencers from end-user industries—such as CIOs, CTOs, and CSOs—who provided first-hand perspectives on market needs, product usage, and future expectations.
On the supply side, interviews were conducted with manufacturers, industry associations, and institutional participants to gather insights into current offerings, product pipelines, and market challenges.
Primary interviews provided critical inputs such as:
- Market size and revenue data
- Product and service breakdowns
- Market forecasts
- Regional and application-specific trends
Stakeholders consulted included:
- Leading OEM and solution providers
- Channel and distribution partners
- End users across various applications
- Independent consultants and industry specialists
Market Size Estimation and Data Triangulation
- Identifying Key Market Participants (Secondary Research)
- Goal: To identify the major players or companies in the target market. This typically involves using publicly available data sources such as industry reports, market research publications, and financial statements of companies.
- Tools: Reports from firms like Gartner, Forrester, Euromonitor, Statista, IBISWorld, and others. Public financial statements, news articles, and press releases from top market players.
- Extracting Earnings of Key Market Participants
- Goal: To estimate the earnings generated from the product or service being analyzed. This step helps in understanding the revenue potential of each market player in a specific geography.
- Methods: Earnings data can be gathered from:
- Publicly available financial reports (for listed companies).
- Interviews and primary data sources from professionals, such as Directors, VPs, SVPs, etc. This is especially useful for understanding more nuanced, internal data that isn't publicly disclosed.
- Annual reports and investor presentations of key players.
- Data Collation and Development of a Relevant Data Model
- Goal: To collate inputs from both primary and secondary sources into a structured, data-driven model for market estimation. This model will incorporate key market KPIs and any independent variables relevant to the market.
- Key KPIs: These could include:
- Market size, growth rate, and demand drivers.
- Industry-specific metrics like market share, average revenue per customer (ARPC), or average deal size.
- External variables, such as economic growth rates, inflation rates, or commodity prices, that could affect the market.
- Data Modeling: Based on this data, the market forecasts are developed for the next 5 years. A combination of trend analysis, scenario modeling, and statistical regression might be used to generate projections.
- Scenario Analysis
- Goal: To test different assumptions and validate how sensitive the market is to changes in key variables (e.g., market demand, regulatory changes, technological disruptions).
- Types of Scenarios:
- Base Case: Based on current assumptions and historical data.
- Best-Case Scenario: Assuming favorable market conditions, regulatory environments, and technological advancements.
- Worst-Case Scenario: Accounting for adverse factors, such as economic downturns, stricter regulations, or unexpected disruptions.


