Norway Beer Market Report: Trends, Growth and Forecast (2026-2032)
Product Type (Dark Beer (Ale, Sorghum Beer, Weissbier/Weizen/Wheat Beer), Lager (Flavoured/Mixed Lager, Standard Lager (Premium Lager (Domestic Premium Lager, Imported Premium Lager), Mid-Priced Lager (Domestic Mid-Priced Lager, Imported Mid-Priced Lager), Economy Lager (Domestic Economy Lager, Imported Economy Lager))), Non/Low Alcohol Beer (Low Alcohol Beer, Non Alcoholic Beer), Stout, Others (Porter, Malt etc.)), Production (Macro Brewery, Micro Brewery, Craft Brewery), Packaging Type (Bottles, Cans, Others), Sales Channel (On-Trade, Off-Trade) ... Read more
|
Major Players
|
Norway Beer Market Statistics and Insights, 2026
- Market Size Statistics
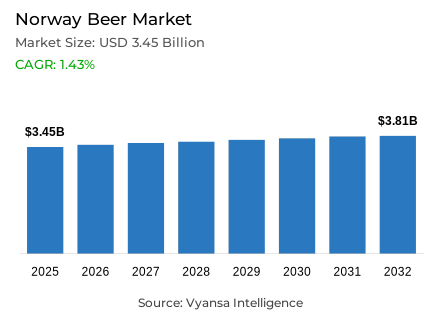
- Beer in Norway is estimated at USD 3.45 billion.
- The market size is expected to grow to USD 3.81 billion by 2032.
- Market to register a cagr of around 1.43% during 2026-32.
- Product Type Shares
- Lager grabbed market share of 80%.
- Competition
- More than 20 companies are actively engaged in producing beer in Norway.
- Top 5 companies acquired around 75% of the market share.
- Anheuser-Busch InBev Norway AS; NorgesGruppen ASA; Coop Norge SA; Ringnes AS; Hansa Borg Bryggerier AS etc., are few of the top companies.
- Sales Channel
- Off-trade grabbed 55% of the market.
Norway Beer Market Outlook
The Norway beer market is worth $3.45 billion in 2025 and is projected to reach $3.81 billion in 2032 with a CAGR of about 1.43% from 2026–2032. Beer volumes in total are expected to see a moderate fall due to chronic macroeconomic pressures like inflation and cross-border trade that trigger end users to consume cheaper alternatives from neighboring countries. Despite these problems, World Off-trade channels, taking up 55% of the market, will remain important, driven by supermarkets, discounters, and specialist retailers that offer competitive prices and convenience for non- and low-beer alcoholic purchases.
Lager, currently with 80% market share, will still dominate total consumption, underpinned primarily by mid-priced national brands. Economy and premium lagers will have a smaller but steady contribution. Flavoured or mixed lagers, particularly Radler, will also grow as end users continue to seek lighter, thirst-drinking styles ideal for summer and social use.
Non- and low-alcohol beer will be the most dynamic category throughout the forecast period with growing health and wellness awareness. The end user is seeking moderation, variety, and functionality, such as recovery after exercise, which will make this category extremely popular. Non-alcoholic beer innovation, e.g., fruit-infused IPAs and reduced-calorie Radlers, will further expand end user choice and attract young end users.
Local craft beers will also see increased interest with end users increasingly enjoying artisanal brewing, distinctive flavor profiles, and high-end ingredients. Imports from neighboring Sweden, in particular, are expected to gather pace in the north. Overall, beer companies will continue to invest in product innovation, packaging, and health-focused variants to keep pace with shifting end user trends while maintaining solid growth amidst a sour economic environment.

Norway Beer Market Growth Driver
Increasing Demand for Non/Low-Alcohol Beers
The Norway Beer Market is driven by the growth in the demand for non/low-alcohol beer. End users are more health-conscious and desire moderation in drinking. This has triggered high growth in non-beer and low-beer categories, and drink brands innovate to keep pace with demand through new taste, pack size, and seasonal variants. Low-calorie and flavored versions like Radler are also attracting end users in search of light and refreshing and lower-calorie versions, propelling overall beer market growth.
Industry giants such as Ringnes, Hansa Borg, and Aass expand their non/low-alcohol ranges to appeal to health-conscious end users. This new trend fuels sales, increases brand loyalty, and widens the end user base. With evolving preferences, non/low-alcohol beer now forms a strong percentage of the market and emerges as a major driver of industry growth over the forecast period.
Norway Beer Market Trend
Shift Toward Health-Conscious and Flavoured Options
A growing trend in the Norway Beer Market is towards healthy drinking. Non/low-alcohol beer is chosen more as a healthy option by end users as part of a well-balanced diet, and it is also viewed by some as a post-workout recovery drink. This drives trends around innovation in flavour, format, and seasonals, such as Radler and fruit-flavoured IPAs.
Flavoured and lower-calorie beer categories are gaining consumption occasions and converting younger end users seeking unique, refreshing alternatives. Oslo Brewing Co and Hansa Borg are brands that promote active encouragement of these beverages, employing social media and influencer marketing to connect with end users. As flavoured beer and health-focused beer varieties gain momentum, these trends redefine consumption patterns and marketplace perceptions in Norway
Unlock Market Intelligence
Explore the market potential with our data-driven report
Norway Beer Market Opportunity
Growth of Local Craft and Premium Beer
Opportunities in the Beer Market of Norway are the growth of local craft and premium beer segments. end users are placing more and more emphasis on artisan brewing, unique flavors, and local ingredients, which increases demand for small breweries with offbeat experiences.
Breweries will employ narrative, seasonal introductions, and limited release approaches to create brand allegiance. Imports are also trendy in some markets, providing windows of selective distribution or alliance opportunity. Expansion of retail presence and on-trade will allow for businesses to capitalize on the growing demand for premium, high-quality, and locally crafted beers. The category will further consolidate, driving differentiation and top-line growth across the marketplace.
Unlock Market Intelligence
Explore the market potential with our data-driven report
Norway Beer Market Segmentation Analysis

By Product Type
- Dark Beer
- Lager
- Non/Low Alcohol Beer
- Stout
The segment with highest market share under Product Type is Lager, and it commands around 80% market share. Lager is the most preferred beverage among Norway end users due to its broad suitability, availability, and uniform taste. Local middle-priced lager tops volume sales with the best-selling brands of Ringnes, Frydenlund, and Hansa. Although premium and economy lagers are minor shares, lager is still in vogue among end user segments for both regular consumption and celebratory consumption.
lager will retain its dominant share despite steady overall declines in beer sales. Growth will be supported by innovation in flavoured and mixed lagers, e.g. Radler, and heightened interest in non/low alcohol variants. The dominance of lager is because the presence, familiarity, and versatility of lager make it the cornerstone of the Norway beer market.
By Sales Channel
- On-Trade
- Off-Trade
The segment with highest market share under category is Off-Trade with a market share of approximately 55%. Off-Trade includes discounters, supermarkets, and Vinmonopolet, which is the government-owned alcoholic beverage retailer. Off-trade is still crucial due to its convenience, low prices, and ability to stock a wide range of products, e.g., mid-range lagers and non/low alcohol beers.
Discounters lead off-trade volumes with their power to reach price-sensitive end users, with Vinmonopolet attracting premium or specialty beer purchasers who are higher-income end users. Off-trade will maintain its leading position during the forecast period, supporting established and new beer categories by keeping sales stable with the power of convenience, variety, and affordability.
List of Companies Covered in Norway Beer Market
The companies listed below are highly influential in the Norway beer market, with a significant market share and a strong impact on industry developments.
- Anheuser-Busch InBev Norway AS
- NorgesGruppen ASA
- Coop Norge SA
- Ringnes AS
- Hansa Borg Bryggerier AS
- Grans Bryggeri AS
- Macks Olbryggeri AS
- Aass Bryggeri AS
- Brewery International AS
- Multibev AS
Frequently Asked Questions
Related Report
1. Market Segmentation
1.1. Research Scope
1.2. Research Methodology
1.3. Definitions and Assumptions
2. Executive Summary
3. Norway Beer Market Policies, Regulations, and Standards
4. Norway Beer Market Dynamics
4.1. Growth Factors
4.2. Challenges
4.3. Trends
4.4. Opportunities
5. Norway Beer Market Statistics, 2022-2032F
5.1. Market Size & Growth Outlook
5.1.1.By Revenues in US$ Million
5.1.2.By Quantity Sold in Million Litres
5.2. Market Segmentation & Growth Outlook
5.2.1.By Product Type
5.2.1.1. Dark Beer- Market Insights and Forecast 2022-2032, USD Million
5.2.1.1.1. Ale- Market Insights and Forecast 2022-2032, USD Million
5.2.1.1.2. Sorghum Beer- Market Insights and Forecast 2022-2032, USD Million
5.2.1.1.3. Weissbier/Weizen/Wheat Beer- Market Insights and Forecast 2022-2032, USD Million
5.2.1.2. Lager- Market Insights and Forecast 2022-2032, USD Million
5.2.1.2.1. Flavoured/Mixed Lager- Market Insights and Forecast 2022-2032, USD Million
5.2.1.2.2. Standard Lager- Market Insights and Forecast 2022-2032, USD Million
5.2.1.2.2.1. Premium Lager- Market Insights and Forecast 2022-2032, USD Million
5.2.1.2.2.1.1. Domestic Premium Lager- Market Insights and Forecast 2022-2032, USD Million
5.2.1.2.2.1.2. Imported Premium Lager- Market Insights and Forecast 2022-2032, USD Million
5.2.1.2.2.2. Mid-Priced Lager- Market Insights and Forecast 2022-2032, USD Million
5.2.1.2.2.2.1. Domestic Mid-Priced Lager- Market Insights and Forecast 2022-2032, USD Million
5.2.1.2.2.2.2. Imported Mid-Priced Lager- Market Insights and Forecast 2022-2032, USD Million
5.2.1.2.2.3. Economy Lager- Market Insights and Forecast 2022-2032, USD Million
5.2.1.2.2.3.1. Domestic Economy Lager- Market Insights and Forecast 2022-2032, USD Million
5.2.1.2.2.3.2. Imported Economy Lager- Market Insights and Forecast 2022-2032, USD Million
5.2.1.3. Non/Low Alcohol Beer- Market Insights and Forecast 2022-2032, USD Million
5.2.1.3.1. Low Alcohol Beer- Market Insights and Forecast 2022-2032, USD Million
5.2.1.3.2. Non Alcoholic Beer- Market Insights and Forecast 2022-2032, USD Million
5.2.1.4. Stout- Market Insights and Forecast 2022-2032, USD Million
5.2.1.5. Others (Porter, Malt etc.) - Market Insights and Forecast 2022-2032, USD Million
5.2.2.By Production
5.2.2.1. Macro Brewery- Market Insights and Forecast 2022-2032, USD Million
5.2.2.2. Micro Brewery- Market Insights and Forecast 2022-2032, USD Million
5.2.2.3. Craft Brewery- Market Insights and Forecast 2022-2032, USD Million
5.2.3.By Packaging Type
5.2.3.1. Bottles- Market Insights and Forecast 2022-2032, USD Million
5.2.3.2. Cans- Market Insights and Forecast 2022-2032, USD Million
5.2.3.3. Others- Market Insights and Forecast 2022-2032, USD Million
5.2.4.By Sales Channel
5.2.4.1. On-Trade- Market Insights and Forecast 2022-2032, USD Million
5.2.4.2. Off-Trade- Market Insights and Forecast 2022-2032, USD Million
5.2.5.By Competitors
5.2.5.1. Competition Characteristics
5.2.5.2. Market Share & Analysis
6. Norway Dark Beer Market Statistics, 2022-2032F
6.1. Market Size & Growth Outlook
6.1.1.By Revenues in US$ Million
6.1.2.By Quantity Sold in Million Litres
6.2. Market Segmentation & Growth Outlook
6.2.1.By Product Type- Market Insights and Forecast 2022-2032, USD Million
6.2.2.By Production- Market Insights and Forecast 2022-2032, USD Million
6.2.3.By Packaging Type- Market Insights and Forecast 2022-2032, USD Million
6.2.4.By Sales Channel- Market Insights and Forecast 2022-2032, USD Million
7. Norway Lager Beer Market Statistics, 2022-2032F
7.1. Market Size & Growth Outlook
7.1.1.By Revenues in US$ Million
7.1.2.By Quantity Sold in Million Litres
7.2. Market Segmentation & Growth Outlook
7.2.1.By Product Type- Market Insights and Forecast 2022-2032, USD Million
7.2.2.By Production- Market Insights and Forecast 2022-2032, USD Million
7.2.3.By Packaging Type- Market Insights and Forecast 2022-2032, USD Million
7.2.4.By Sales Channel- Market Insights and Forecast 2022-2032, USD Million
8. Norway Non/Low Alcohol Beer Market Statistics, 2022-2032F
8.1. Market Size & Growth Outlook
8.1.1.By Revenues in US$ Million
8.1.2.By Quantity Sold in Million Litres
8.2. Market Segmentation & Growth Outlook
8.2.1.By Production- Market Insights and Forecast 2022-2032, USD Million
8.2.2.By Packaging Type- Market Insights and Forecast 2022-2032, USD Million
8.2.3.By Sales Channel- Market Insights and Forecast 2022-2032, USD Million
9. Norway Stout Beer Market Statistics, 2022-2032F
9.1. Market Size & Growth Outlook
9.1.1.By Revenues in US$ Million
9.1.2.By Quantity Sold in Million Litres
9.2. Market Segmentation & Growth Outlook
9.2.1.By Production- Market Insights and Forecast 2022-2032, USD Million
9.2.2.By Packaging Type- Market Insights and Forecast 2022-2032, USD Million
9.2.3.By Sales Channel- Market Insights and Forecast 2022-2032, USD Million
10. Competitive Outlook
10.1. Company Profiles
10.1.1. Ringnes AS
10.1.1.1. Business Description
10.1.1.2. Product Portfolio
10.1.1.3. Collaborations & Alliances
10.1.1.4. Recent Developments
10.1.1.5. Financial Details
10.1.1.6. Others
10.1.2. Hansa Borg Bryggerier AS
10.1.2.1. Business Description
10.1.2.2. Product Portfolio
10.1.2.3. Collaborations & Alliances
10.1.2.4. Recent Developments
10.1.2.5. Financial Details
10.1.2.6. Others
10.1.3. Grans Bryggeri AS
10.1.3.1. Business Description
10.1.3.2. Product Portfolio
10.1.3.3. Collaborations & Alliances
10.1.3.4. Recent Developments
10.1.3.5. Financial Details
10.1.3.6. Others
10.1.4. Macks Ølbryggeri AS
10.1.4.1. Business Description
10.1.4.2. Product Portfolio
10.1.4.3. Collaborations & Alliances
10.1.4.4. Recent Developments
10.1.4.5. Financial Details
10.1.4.6. Others
10.1.5. Aass, P Ltz AS
10.1.5.1. Business Description
10.1.5.2. Product Portfolio
10.1.5.3. Collaborations & Alliances
10.1.5.4. Recent Developments
10.1.5.5. Financial Details
10.1.5.6. Others
10.1.6. Anheuser-Busch Inbev Norway AS
10.1.6.1. Business Description
10.1.6.2. Product Portfolio
10.1.6.3. Collaborations & Alliances
10.1.6.4. Recent Developments
10.1.6.5. Financial Details
10.1.6.6. Others
10.1.7. Norgesgruppen ASA
10.1.7.1. Business Description
10.1.7.2. Product Portfolio
10.1.7.3. Collaborations & Alliances
10.1.7.4. Recent Developments
10.1.7.5. Financial Details
10.1.7.6. Others
10.1.8. Coop Norge AS
10.1.8.1. Business Description
10.1.8.2. Product Portfolio
10.1.8.3. Collaborations & Alliances
10.1.8.4. Recent Developments
10.1.8.5. Financial Details
10.1.8.6. Others
10.1.9. Brewery International AS
10.1.9.1. Business Description
10.1.9.2. Product Portfolio
10.1.9.3. Collaborations & Alliances
10.1.9.4. Recent Developments
10.1.9.5. Financial Details
10.1.9.6. Others
10.1.10. Multibev AS
10.1.10.1.Business Description
10.1.10.2.Product Portfolio
10.1.10.3.Collaborations & Alliances
10.1.10.4.Recent Developments
10.1.10.5.Financial Details
10.1.10.6.Others
11. Disclaimer
| Segment | Sub-Segment |
|---|---|
| By Product Type |
|
| By Production |
|
| By Packaging Type |
|
| By Sales Channel |
|
Research Methodology
This study followed a structured approach comprising four key phases to assess the size and scope of the electro-oxidation market. The process began with thorough secondary research to collect data on the target market, related markets, and broader industry context. These findings, along with preliminary assumptions and estimates, were then validated through extensive primary research involving industry experts from across the value chain. To calculate the overall market size, both top-down and bottom-up methodologies were employed. Finally, market segmentation and data triangulation techniques were applied to refine and validate segment-level estimations.
Secondary Research
The secondary research phase involved gathering data from a wide range of credible and published sources. This step helped in identifying industry trends, defining market segmentation, and understanding the market landscape and value chain.
Sources consulted during this phase included:
- Company annual reports, investor presentations, and press releases
- Industry white papers and certified publications
- Trade directories and market-recognized databases
- Articles from authoritative authors and reputable journals
- Gold and silver standard websites
Secondary research was critical in mapping out the industry's value chain and monetary flow, identifying key market segments, understanding regional variations, and tracking significant industry developments.
Other key sources:
- Financial disclosures
- Industry associations and trade bodies
- News outlets and business magazines
- Academic journals and research studies
- Paid industry databases
Primary Research
To validate secondary data and gain deeper market insights, primary research was conducted with key stakeholders across both the supply and demand sides of the market.
On the demand side, participants included decision-makers and influencers from end-user industries—such as CIOs, CTOs, and CSOs—who provided first-hand perspectives on market needs, product usage, and future expectations.
On the supply side, interviews were conducted with manufacturers, industry associations, and institutional participants to gather insights into current offerings, product pipelines, and market challenges.
Primary interviews provided critical inputs such as:
- Market size and revenue data
- Product and service breakdowns
- Market forecasts
- Regional and application-specific trends
Stakeholders consulted included:
- Leading OEM and solution providers
- Channel and distribution partners
- End users across various applications
- Independent consultants and industry specialists
Market Size Estimation and Data Triangulation
- Identifying Key Market Participants (Secondary Research)
- Goal: To identify the major players or companies in the target market. This typically involves using publicly available data sources such as industry reports, market research publications, and financial statements of companies.
- Tools: Reports from firms like Gartner, Forrester, Euromonitor, Statista, IBISWorld, and others. Public financial statements, news articles, and press releases from top market players.
- Extracting Earnings of Key Market Participants
- Goal: To estimate the earnings generated from the product or service being analyzed. This step helps in understanding the revenue potential of each market player in a specific geography.
- Methods: Earnings data can be gathered from:
- Publicly available financial reports (for listed companies).
- Interviews and primary data sources from professionals, such as Directors, VPs, SVPs, etc. This is especially useful for understanding more nuanced, internal data that isn't publicly disclosed.
- Annual reports and investor presentations of key players.
- Data Collation and Development of a Relevant Data Model
- Goal: To collate inputs from both primary and secondary sources into a structured, data-driven model for market estimation. This model will incorporate key market KPIs and any independent variables relevant to the market.
- Key KPIs: These could include:
- Market size, growth rate, and demand drivers.
- Industry-specific metrics like market share, average revenue per customer (ARPC), or average deal size.
- External variables, such as economic growth rates, inflation rates, or commodity prices, that could affect the market.
- Data Modeling: Based on this data, the market forecasts are developed for the next 5 years. A combination of trend analysis, scenario modeling, and statistical regression might be used to generate projections.
- Scenario Analysis
- Goal: To test different assumptions and validate how sensitive the market is to changes in key variables (e.g., market demand, regulatory changes, technological disruptions).
- Types of Scenarios:
- Base Case: Based on current assumptions and historical data.
- Best-Case Scenario: Assuming favorable market conditions, regulatory environments, and technological advancements.
- Worst-Case Scenario: Accounting for adverse factors, such as economic downturns, stricter regulations, or unexpected disruptions.


