Global Low Carbon Building Market Report: Trends, Growth and Forecast (2026-2032)
By Solution Type (Low-Carbon Building Materials, Energy-Efficient Building Systems, Renewable Energy Systems, Building Energy Management Systems, Carbon Assessment & Advisory Services, Others), By Building Type (Residential Buildings, Commercial Buildings, Industrial Buildings, Public & Institutional Buildings), By Project Type (New Construction, Renovation & Retrofit), By Carbon Reduction Type (Operational Carbon Reduction, Embodied Carbon Reduction), By Certification Standards (Leadership in Energy & Environmental Design (LEED), Building Research Establishment Environmental Assessment Method (BREEAM), WELL Building Standard, EDGE Certification, Passivhaus/Passive House, NABERS, Green Star, Others), By Project Stage (Design & Planning, Construction & Installation, Operations & Maintenance, Demolition & Circular Economy), By Region (North America, South America, Europe, Middle East & Africa, Asia Pacific) ... Read more
|
Major Players
|
Global Low Carbon Building Market Statistics and Insights, 2026
- Market Size Statistics
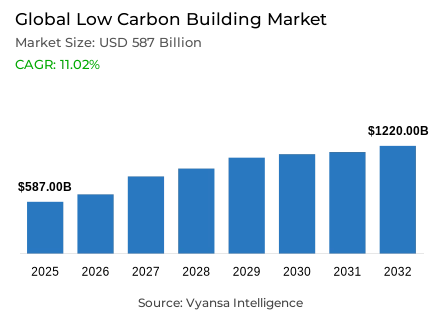
- Low Carbon Building market size was valued at USD 587 billion in 2025 and is estimated at USD 632 billion in 2026.
- The market size is expected to grow to USD 1.22 trillion by 2032.
- Market to register a CAGR of around 11.02% during 2026-32.
- Solution Type Shares
- Low-carbon building materials grabbed market share of 35%.
- Competition
- More than 25 companies are actively engaged in producing low carbon building.
- Top 5 companies acquired around 10% of the market share.
- Saint-Gobain S.A., Holcim Ltd, Heidelberg Materials AG, Schneider Electric SE, Siemens AG etc., are few of the top companies.
- Building Type
- Residential buildings grabbed 40% of the market.
- Region
- Europe leads with a 35% share of the global market.
Global Low Carbon Building Market Outlook
The global low carbon building market size was valued at USD 587 billion in 2025 and is projected to grow from USD 632 billion in 2026 to USD 1.22 trillion by 2032, exhibiting a CAGR of 11.02% during the forecast period. The market is expanding as building owners, developers, contractors, and public authorities shift from conventional construction toward sustainable building solutions that reduce operational carbon, embodied carbon, energy cost, and long-term asset-risk exposure.
The market includes low-carbon materials such as cement, concrete, steel, timber, glass, and insulation, along with energy-efficient windows, heat pumps, HVAC upgrades, smart controls, building energy management systems, lifecycle assessment tools, environmental product declarations, and retrofit services. These solutions are used across residential buildings, commercial buildings, institutional buildings, industrial buildings, public buildings, and large-scale retrofit projects.
low carbon buildings exist because construction and building operations must reduce fossil-fuel dependence, inefficient energy use, material carbon intensity, and compliance risk. Buyers increasingly evaluate buildings through energy performance, lifecycle carbon management, operating cost, renovation readiness, tenant expectations, and alignment with building energy codes. Product adoption therefore moves beyond green positioning and becomes part of asset performance, capital planning, and regulatory readiness.
Growth through 2032 remains shaped by net-zero buildings, energy-efficient construction, embodied carbon reduction, operational carbon reduction, carbon disclosure rules, and green public procurement. Adoption will concentrate where policy, financing, technical capacity, supply-chain readiness, and product availability move together. Future demand will favor integrated building decarbonization packages that combine low-carbon construction materials, efficient envelopes, electrified heating, renewable readiness, and digital controls.

Global Low Carbon Building Market Growth Driver
Building Performance Pressure Accelerates Solution Adoption
The strongest driver is the need to reduce energy use and emissions across building operations and construction materials. UNEP and GlobalABC state that buildings and construction consume 32% of global energy and contribute 34% of global CO2 emissions, while cement and steel are responsible for 18% of global emissions. This creates direct demand for low-carbon construction materials, sustainable insulation, energy-efficient windows, heat pumps, smart building controls, and retrofit services.
The demand chain is clear. High building emissions increase regulatory pressure, regulatory pressure raises performance requirements, and performance requirements translate into product-level adoption across building envelope upgrades, fossil-free heating, low-carbon concrete, low-carbon steel, and building energy management systems. Developers and owners spend because inefficient assets face higher operating costs, retrofit pressure, tenant scrutiny, and future compliance risk. Building decarbonization therefore becomes a commercial requirement linked with lifecycle cost, asset value, and long-term marketability.
Global Low Carbon Building Market Challenge
Retrofit Complexity Slows Deep Decarbonization
The main challenge is the execution difficulty of upgrading existing buildings. The European Commission states that improving building energy performance requires measures across the building envelope, particularly insulation and windows, as well as heating, cooling, domestic hot water systems, and renewable energy. This shows why retrofit projects are complex: they require coordinated upgrades across materials, equipment, controls, electrical systems, and compliance documentation rather than one isolated product replacement.
The barrier is practical and financial. Owners must manage high upfront cost, tenant disruption, contractor availability, payback uncertainty, electrical upgrades, HVAC replacement, façade work, and energy modeling. Deep retrofit programs may require sustainable insulation, energy-efficient windows, heat pumps, smart HVAC controls, ventilation upgrades, solar-ready design, and lifecycle carbon management within the same project. Adoption slows where financing is weak, technical capacity is limited, or small owners cannot coordinate multi-product renovation programs.
Unlock Market Intelligence
Explore the market potential with our data-driven report
Global Low Carbon Building Market Trend
Electrified and Controlled Buildings Reshape Design
The strongest trend is the shift toward electrified, digitally controlled, and energy-optimized building systems. IEA states that heat pumps met more than 10% of global heating needs in buildings in 2023, while heat output from heat pumps must increase at least two-fold by 2030 under the Net Zero pathway. This makes electrified heating a central trend in low-carbon building design.
This transition changes how low carbon buildings are specified and operated. Energy-efficient construction increasingly combines building envelope improvement, heat pumps, smart building controls, low-temperature heating systems, demand-response readiness, and renewable electricity integration. Building automation systems and energy management systems help optimize heating, cooling, ventilation, lighting, and occupancy-based energy use. Product adoption strengthens when electrified HVAC systems are paired with insulation and controls, because equipment efficiency depends heavily on envelope quality and operating intelligence.
Global Low Carbon Building Market Opportunity
Carbon-Documented Materials Create Higher-Value Demand
The strongest opportunity lies in low-carbon materials supported by lifecycle carbon reporting. Cement, concrete, steel, insulation, timber, glass, façade systems, flooring, and wall assemblies lock in embodied carbon before a building is occupied. UNEP and GlobalABC highlight cement and steel as major emissions sources, making material selection central to building decarbonization and long-term carbon performance.
The opportunity is strongest where procurement shifts from cost-only purchasing toward carbon-documented specification. The European Commission lists an EU framework for national calculation of lifecycle global warming potential under building energy-performance documents, supporting material transparency and lifecycle assessment. This creates demand for low-carbon cement, low-carbon concrete, recycled steel, timber construction, bio-based insulation, environmental product declarations, and suppliers that can prove performance, durability, fire safety, and carbon data together. Carbon-documented products are therefore positioned to gain value in green building certification and public procurement.
Global Low Carbon Building Market Regional Analysis

By Region
- North America
- South America
- Europe
- Middle East & Africa
- Asia Pacific
Europe leads with a 35% share of the global market, supported by strict building-energy regulation, renovation planning, fossil-fuel heating phase-down, and lifecycle carbon disclosure. The revised Energy Performance of Buildings Directive entered into force on 28 May 2024, with transposition into national law due by 29 May 2026. The directive also requires all new buildings owned by public bodies to be zero-emission from 2028 and all other new buildings from 2030.
Regional leadership is built on country-level compliance mechanics. Germany, France, the Nordics, the Netherlands, and the UK are pushing building efficiency, heat-pump adoption, material transparency, and renovation planning, while Southern and Eastern Europe add retrofit demand from older and less efficient building stock. The Europe low carbon building market benefits from renovation plans, minimum performance standards, fossil-boiler incentive phase-out, carbon disclosure rules, and green public procurement. This creates a stronger demand base for low-carbon construction materials, heat pumps, smart controls, and retrofit services.
Unlock Market Intelligence
Explore the market potential with our data-driven report
Global Low Carbon Building Market Segmentation Analysis
By Solution Type
- Low-Carbon Building Materials
- Energy-Efficient Building Systems
- Renewable Energy Systems
- Building Energy Management Systems
- Carbon Assessment & Advisory Services
- Others
The segment with the highest share under the Solution Type category is Low-Carbon Building Materials, holding around 35% of the market. Materials lead because every building embeds concrete, steel, insulation, glass, timber, wall systems, flooring, and façade products at the construction stage. Once installed, material-related emissions are difficult to reverse, making early specification central to embodied carbon reduction.
Low-carbon cement, low-carbon concrete, low-carbon steel, sustainable insulation, and low-carbon façade systems lead because they influence the carbon profile of the structure, envelope, and interior from the beginning of the project. Energy-efficient equipment and smart systems remain important, but many can be replaced or upgraded during operation. Materials have a stronger lock-in effect. The emerging shift is toward lifecycle assessment tools, environmental product declarations, and green public procurement, while conventional materials remain behind where they lack verified carbon data.

By Building Type
- Residential Buildings
- Commercial Buildings
- Industrial Buildings
- Public & Institutional Buildings
The segment with the highest share under the Building Type category is Residential Buildings, holding around 40% of the market. Residential buildings lead because homes represent the largest and most distributed building-use base, requiring sustainable insulation, energy-efficient windows, efficient cooling, heat pumps, ventilation systems, smart thermostats, and low-carbon renovation across both new construction and existing housing stock.
IEA states that the residential sector accounts for about 70% of total energy demand in buildings, while commercial and public buildings account for the remaining 30%. This directly supports residential leadership because household heating, cooling, lighting, appliances, and water heating create recurring demand for energy-performance upgrades. Commercial and institutional buildings often have larger project budgets, but residential buildings dominate through scale, policy focus, energy-bill pressure, and household retrofit needs. Future adoption will depend on financing access, contractor capacity, heat-pump deployment, and envelope upgrade affordability.
Market Players in Global Low Carbon Building Market
These market players maintain a significant presence in the Global low carbon building market and contribute to its ongoing evolution.
- Saint-Gobain S.A.
- Holcim Ltd
- Heidelberg Materials AG
- Schneider Electric SE
- Siemens AG
- Johnson Controls International plc
- Honeywell International Inc.
- Kingspan Group plc
- ABB Ltd
- Trane Technologies plc
- Legrand S.A.
- ROCKWOOL A/S
- Owens Corning
- Skanska AB
- Lendlease Group
Market News & Updates
- Holcim Ltd, 2026:
Holcim applied Paebbl Rebond carbon-storing supplementary cementitious material in a commercial-scale concrete project with Goldbeck in South Germany in May 2026. The technology uses accelerated mineralization to turn captured CO₂ into a stable mineral powder for concrete. The application adds a carbon-storing material route for low-carbon construction projects.
- Saint-Gobain S.A., 2025:
Saint-Gobain Gyproc India launched low-carbon plaster certified by an Environmental Product Declaration in June 2025. The launch covered Elite 100, Elite MR, and Xpert+ products manufactured at the Chennai plant using optimized processes and renewable energy. The update expands certified low-carbon building material options for sustainable construction projects
Frequently Asked Questions
Related Report
- Market Segmentation
- Research Scope
- Research Methodology
- Definitions and Assumptions
- Executive Summary
- Global Low Carbon Building Market Policies, Regulations, and Standards
- Global Low Carbon Building Market Porter Five Forces Analysis, 2026
- Global Low Carbon Building Market PESTLE Analysis, 2026
- Global Low Carbon Building Market Dynamics
- Growth Factors
- Challenges
- Trends
- Opportunities
- Global Low Carbon Building Market Statistics, 2022-2032F
- Market Size & Growth Outlook
- By Revenues in USD Million
- By Quantity Sold in Million Tons
- Market Segmentation & Growth Outlook
- By Solution Type
- Low-Carbon Building Materials- Market Insights and Forecast 2022-2032, USD Million
- Energy-Efficient Building Systems- Market Insights and Forecast 2022-2032, USD Million
- Renewable Energy Systems- Market Insights and Forecast 2022-2032, USD Million
- Building Energy Management Systems- Market Insights and Forecast 2022-2032, USD Million
- Carbon Assessment & Advisory Services- Market Insights and Forecast 2022-2032, USD Million
- Others- Market Insights and Forecast 2022-2032, USD Million
- By Building Type
- Residential Buildings- Market Insights and Forecast 2022-2032, USD Million
- Commercial Buildings- Market Insights and Forecast 2022-2032, USD Million
- Industrial Buildings- Market Insights and Forecast 2022-2032, USD Million
- Public & Institutional Buildings- Market Insights and Forecast 2022-2032, USD Million
- By Project Type
- New Construction- Market Insights and Forecast 2022-2032, USD Million
- Renovation & Retrofit- Market Insights and Forecast 2022-2032, USD Million
- By Carbon Reduction Type
- Operational Carbon Reduction- Market Insights and Forecast 2022-2032, USD Million
- Embodied Carbon Reduction- Market Insights and Forecast 2022-2032, USD Million
- By Certification Standards
- Leadership in Energy & Environmental Design (LEED)
- Building Research Establishment Environmental Assessment Method (BREEAM)
- WELL Building Standard
- EDGE Certification
- Passivhaus/Passive House
- NABERS
- Green Star
- Others
- By Project Stage
- Design & Planning
- Construction & Installation
- Operations & Maintenance
- Demolition & Circular Economy
- By Region
- North America
- South America
- Europe
- Middle East & Africa
- Asia Pacific
- By Competitors
- Competition Characteristics
- Market Share & Analysis
- By Solution Type
- Market Size & Growth Outlook
- North America Low Carbon Building Market Statistics, 2022-2032F
- Market Size & Growth Outlook
- By Revenues in USD Million
- By Quantity Sold in Million Tons
- Market Segmentation & Growth Outlook
- By Solution Type- Market Insights and Forecast 2022-2032, USD Million
- By Building Type- Market Insights and Forecast 2022-2032, USD Million
- By Project Type- Market Insights and Forecast 2022-2032, USD Million
- By Carbon Reduction Type- Market Insights and Forecast 2022-2032, USD Million
- By Certification Standard- Market Insights and Forecast 2022-2032, USD Million
- By Project Stage
- By Country
- US
- Canada
- Mexico
- US Low Carbon Building Market Statistics, 2022-2032F
- Market Size & Growth Outlook
- By Revenues in USD Million
- By Quantity Sold in Million Tons
- Market Segmentation & Growth Outlook
- By Solution Type- Market Insights and Forecast 2022-2032, USD Million
- By Building Type- Market Insights and Forecast 2022-2032, USD Million
- By Project Type- Market Insights and Forecast 2022-2032, USD Million
- By Carbon Reduction Type- Market Insights and Forecast 2022-2032, USD Million
- Market Size & Growth Outlook
- Canada Low Carbon Building Market Statistics, 2022-2032F
- Market Size & Growth Outlook
- By Revenues in USD Million
- By Quantity Sold in Million Tons
- Market Segmentation & Growth Outlook
- By Solution Type- Market Insights and Forecast 2022-2032, USD Million
- By Building Type- Market Insights and Forecast 2022-2032, USD Million
- By Project Type- Market Insights and Forecast 2022-2032, USD Million
- By Carbon Reduction Type- Market Insights and Forecast 2022-2032, USD Million
- Market Size & Growth Outlook
- Mexico Low Carbon Building Market Statistics, 2022-2032F
- Market Size & Growth Outlook
- By Revenues in USD Million
- By Quantity Sold in Million Tons
- Market Segmentation & Growth Outlook
- By Solution Type- Market Insights and Forecast 2022-2032, USD Million
- By Building Type- Market Insights and Forecast 2022-2032, USD Million
- By Project Type- Market Insights and Forecast 2022-2032, USD Million
- By Carbon Reduction Type- Market Insights and Forecast 2022-2032, USD Million
- Market Size & Growth Outlook
- Market Size & Growth Outlook
- South America Low Carbon Building Market Statistics, 2022-2032F
- Market Size & Growth Outlook
- By Revenues in USD Million
- By Quantity Sold in Million Tons
- Market Segmentation & Growth Outlook
- By Solution Type- Market Insights and Forecast 2022-2032, USD Million
- By Building Type- Market Insights and Forecast 2022-2032, USD Million
- By Project Type- Market Insights and Forecast 2022-2032, USD Million
- By Carbon Reduction Type- Market Insights and Forecast 2022-2032, USD Million
- By Carbon Reduction Type- Market Insights and Forecast 2022-2032, USD Million
- By Certification Standard- Market Insights and Forecast 2022-2032, USD Million
- By Country
- Brazil
- Chile
- Argentina
- Colombia
- Rest of South America
- Brazil Low Carbon Building Market Statistics, 2022-2032F
- Market Size & Growth Outlook
- By Revenues in USD Million
- By Quantity Sold in Million Tons
- Market Segmentation & Growth Outlook
- By Solution Type- Market Insights and Forecast 2022-2032, USD Million
- By Building Type- Market Insights and Forecast 2022-2032, USD Million
- By Project Type- Market Insights and Forecast 2022-2032, USD Million
- By Carbon Reduction Type- Market Insights and Forecast 2022-2032, USD Million
- Market Size & Growth Outlook
- Chile Low Carbon Building Market Statistics, 2022-2032F
- Market Size & Growth Outlook
- By Revenues in USD Million
- By Quantity Sold in Million Tons
- Market Segmentation & Growth Outlook
- By Solution Type- Market Insights and Forecast 2022-2032, USD Million
- By Building Type- Market Insights and Forecast 2022-2032, USD Million
- By Project Type- Market Insights and Forecast 2022-2032, USD Million
- By Carbon Reduction Type- Market Insights and Forecast 2022-2032, USD Million
- Market Size & Growth Outlook
- Argentina Low Carbon Building Market Statistics, 2022-2032F
- Market Size & Growth Outlook
- By Revenues in USD Million
- By Quantity Sold in Million Tons
- Market Segmentation & Growth Outlook
- By Solution Type- Market Insights and Forecast 2022-2032, USD Million
- By Building Type- Market Insights and Forecast 2022-2032, USD Million
- By Project Type- Market Insights and Forecast 2022-2032, USD Million
- By Carbon Reduction Type- Market Insights and Forecast 2022-2032, USD Million
- Market Size & Growth Outlook
- Colombia Low Carbon Building Market Statistics, 2022-2032F
- Market Size & Growth Outlook
- By Revenues in USD Million
- By Quantity Sold in Million Tons
- Market Segmentation & Growth Outlook
- By Solution Type- Market Insights and Forecast 2022-2032, USD Million
- By Building Type- Market Insights and Forecast 2022-2032, USD Million
- By Project Type- Market Insights and Forecast 2022-2032, USD Million
- By Carbon Reduction Type- Market Insights and Forecast 2022-2032, USD Million
- Market Size & Growth Outlook
- Market Size & Growth Outlook
- Europe Low Carbon Building Market Statistics, 2022-2032F
- Market Size & Growth Outlook
- By Revenues in USD Million
- By Quantity Sold in Million Tons
- Market Segmentation & Growth Outlook
- By Solution Type- Market Insights and Forecast 2022-2032, USD Million
- By Building Type- Market Insights and Forecast 2022-2032, USD Million
- By Project Type- Market Insights and Forecast 2022-2032, USD Million
- By Carbon Reduction Type- Market Insights and Forecast 2022-2032, USD Million
- By Carbon Reduction Type- Market Insights and Forecast 2022-2032, USD Million
- By Certification Standard- Market Insights and Forecast 2022-2032, USD Million
- By Country
- Germany
- France
- The UK
- Italy
- Spain
- Netherlands
- Sweden
- Denmark
- Rest of Europe
- Germany Low Carbon Building Market Statistics, 2022-2032F
- Market Size & Growth Outlook
- By Revenues in USD Million
- By Quantity Sold in Million Tons
- Market Segmentation & Growth Outlook
- By Solution Type- Market Insights and Forecast 2022-2032, USD Million
- By Building Type- Market Insights and Forecast 2022-2032, USD Million
- By Project Type- Market Insights and Forecast 2022-2032, USD Million
- By Carbon Reduction Type- Market Insights and Forecast 2022-2032, USD Million
- Market Size & Growth Outlook
- France Low Carbon Building Market Statistics, 2022-2032F
- Market Size & Growth Outlook
- By Revenues in USD Million
- By Quantity Sold in Million Tons
- Market Segmentation & Growth Outlook
- By Solution Type- Market Insights and Forecast 2022-2032, USD Million
- By Building Type- Market Insights and Forecast 2022-2032, USD Million
- By Project Type- Market Insights and Forecast 2022-2032, USD Million
- By Carbon Reduction Type- Market Insights and Forecast 2022-2032, USD Million
- Market Size & Growth Outlook
- The UK Low Carbon Building Market Statistics, 2022-2032F
- Market Size & Growth Outlook
- By Revenues in USD Million
- By Quantity Sold in Million Tons
- Market Segmentation & Growth Outlook
- By Solution Type- Market Insights and Forecast 2022-2032, USD Million
- By Building Type- Market Insights and Forecast 2022-2032, USD Million
- By Project Type- Market Insights and Forecast 2022-2032, USD Million
- By Carbon Reduction Type- Market Insights and Forecast 2022-2032, USD Million
- Market Size & Growth Outlook
- Italy Low Carbon Building Market Statistics, 2022-2032F
- Market Size & Growth Outlook
- By Revenues in USD Million
- By Quantity Sold in Million Tons
- Market Segmentation & Growth Outlook
- By Solution Type- Market Insights and Forecast 2022-2032, USD Million
- By Building Type- Market Insights and Forecast 2022-2032, USD Million
- By Project Type- Market Insights and Forecast 2022-2032, USD Million
- By Carbon Reduction Type- Market Insights and Forecast 2022-2032, USD Million
- Market Size & Growth Outlook
- Spain Low Carbon Building Market Statistics, 2022-2032F
- Market Size & Growth Outlook
- By Revenues in USD Million
- By Quantity Sold in Million Tons
- Market Segmentation & Growth Outlook
- By Solution Type- Market Insights and Forecast 2022-2032, USD Million
- By Building Type- Market Insights and Forecast 2022-2032, USD Million
- By Project Type- Market Insights and Forecast 2022-2032, USD Million
- By Carbon Reduction Type- Market Insights and Forecast 2022-2032, USD Million
- Market Size & Growth Outlook
- Netherlands Low Carbon Building Market Statistics, 2022-2032F
- Market Size & Growth Outlook
- By Revenues in USD Million
- By Quantity Sold in Million Tons
- Market Segmentation & Growth Outlook
- By Solution Type- Market Insights and Forecast 2022-2032, USD Million
- By Building Type- Market Insights and Forecast 2022-2032, USD Million
- By Project Type- Market Insights and Forecast 2022-2032, USD Million
- By Carbon Reduction Type- Market Insights and Forecast 2022-2032, USD Million
- Market Size & Growth Outlook
- Sweden Low Carbon Building Market Statistics, 2022-2032F
- Market Size & Growth Outlook
- By Revenues in USD Million
- By Quantity Sold in Million Tons
- Market Segmentation & Growth Outlook
- By Solution Type- Market Insights and Forecast 2022-2032, USD Million
- By Building Type- Market Insights and Forecast 2022-2032, USD Million
- By Project Type- Market Insights and Forecast 2022-2032, USD Million
- By Carbon Reduction Type- Market Insights and Forecast 2022-2032, USD Million
- Market Size & Growth Outlook
- Denmark Low Carbon Building Market Statistics, 2022-2032F
- Market Size & Growth Outlook
- By Revenues in USD Million
- By Quantity Sold in Million Tons
- Market Segmentation & Growth Outlook
- By Solution Type- Market Insights and Forecast 2022-2032, USD Million
- By Building Type- Market Insights and Forecast 2022-2032, USD Million
- By Project Type- Market Insights and Forecast 2022-2032, USD Million
- By Carbon Reduction Type- Market Insights and Forecast 2022-2032, USD Million
- Market Size & Growth Outlook
- Market Size & Growth Outlook
- Middle East & Africa Low Carbon Building Market Statistics, 2022-2032F
- Market Size & Growth Outlook
- By Revenues in USD Million
- By Quantity Sold in Million Tons
- Market Segmentation & Growth Outlook
- By Solution Type- Market Insights and Forecast 2022-2032, USD Million
- By Building Type- Market Insights and Forecast 2022-2032, USD Million
- By Project Type- Market Insights and Forecast 2022-2032, USD Million
- By Carbon Reduction Type- Market Insights and Forecast 2022-2032, USD Million
- By Carbon Reduction Type- Market Insights and Forecast 2022-2032, USD Million
- By Certification Standard- Market Insights and Forecast 2022-2032, USD Million
- By Country
- Saudi Arabia
- UAE
- South Africa
- Egypt
- Morocco
- Rest of Middle East & Africa
- Saudi Arabia Low Carbon Building Market Statistics, 2022-2032F
- Market Size & Growth Outlook
- By Revenues in USD Million
- By Quantity Sold in Million Tons
- Market Segmentation & Growth Outlook
- By Solution Type- Market Insights and Forecast 2022-2032, USD Million
- By Building Type- Market Insights and Forecast 2022-2032, USD Million
- By Project Type- Market Insights and Forecast 2022-2032, USD Million
- By Carbon Reduction Type- Market Insights and Forecast 2022-2032, USD Million
- Market Size & Growth Outlook
- UAE Low Carbon Building Market Statistics, 2022-2032F
- Market Size & Growth Outlook
- By Revenues in USD Million
- By Quantity Sold in Million Tons
- Market Segmentation & Growth Outlook
- By Solution Type- Market Insights and Forecast 2022-2032, USD Million
- By Building Type- Market Insights and Forecast 2022-2032, USD Million
- By Project Type- Market Insights and Forecast 2022-2032, USD Million
- By Carbon Reduction Type- Market Insights and Forecast 2022-2032, USD Million
- Market Size & Growth Outlook
- South Africa Low Carbon Building Market Statistics, 2022-2032F
- Market Size & Growth Outlook
- By Revenues in USD Million
- By Quantity Sold in Million Tons
- Market Segmentation & Growth Outlook
- By Solution Type- Market Insights and Forecast 2022-2032, USD Million
- By Building Type- Market Insights and Forecast 2022-2032, USD Million
- By Project Type- Market Insights and Forecast 2022-2032, USD Million
- By Carbon Reduction Type- Market Insights and Forecast 2022-2032, USD Million
- Market Size & Growth Outlook
- Egypt Low Carbon Building Market Statistics, 2022-2032F
- Market Size & Growth Outlook
- By Revenues in USD Million
- By Quantity Sold in Million Tons
- Market Segmentation & Growth Outlook
- By Solution Type- Market Insights and Forecast 2022-2032, USD Million
- By Building Type- Market Insights and Forecast 2022-2032, USD Million
- By Project Type- Market Insights and Forecast 2022-2032, USD Million
- By Carbon Reduction Type- Market Insights and Forecast 2022-2032, USD Million
- Market Size & Growth Outlook
- Morocco Low Carbon Building Market Statistics, 2022-2032F
- Market Size & Growth Outlook
- By Revenues in USD Million
- By Quantity Sold in Million Tons
- Market Segmentation & Growth Outlook
- By Solution Type- Market Insights and Forecast 2022-2032, USD Million
- By Building Type- Market Insights and Forecast 2022-2032, USD Million
- By Project Type- Market Insights and Forecast 2022-2032, USD Million
- By Carbon Reduction Type- Market Insights and Forecast 2022-2032, USD Million
- Market Size & Growth Outlook
- Market Size & Growth Outlook
- Asia Pacific Low Carbon Building Market Statistics, 2022-2032F
- Market Size & Growth Outlook
- By Revenues in USD Million
- By Quantity Sold in Million Tons
- Market Segmentation & Growth Outlook
- By Solution Type- Market Insights and Forecast 2022-2032, USD Million
- By Building Type- Market Insights and Forecast 2022-2032, USD Million
- By Project Type- Market Insights and Forecast 2022-2032, USD Million
- By Carbon Reduction Type- Market Insights and Forecast 2022-2032, USD Million
- By Carbon Reduction Type- Market Insights and Forecast 2022-2032, USD Million
- By Certification Standard- Market Insights and Forecast 2022-2032, USD Million
- By Country
- China
- Japan
- South Korea
- India
- Australia & New Zealand
- Southeast Asia
- Rest of Asia Pacific
- China Low Carbon Building Market Statistics, 2022-2032F
- Market Size & Growth Outlook
- By Revenues in USD Million
- By Quantity Sold in Million Tons
- Market Segmentation & Growth Outlook
- By Solution Type- Market Insights and Forecast 2022-2032, USD Million
- By Building Type- Market Insights and Forecast 2022-2032, USD Million
- By Project Type- Market Insights and Forecast 2022-2032, USD Million
- By Carbon Reduction Type- Market Insights and Forecast 2022-2032, USD Million
- Market Size & Growth Outlook
- Japan Low Carbon Building Market Statistics, 2022-2032F
- Market Size & Growth Outlook
- By Revenues in USD Million
- By Quantity Sold in Million Tons
- Market Segmentation & Growth Outlook
- By Solution Type- Market Insights and Forecast 2022-2032, USD Million
- By Building Type- Market Insights and Forecast 2022-2032, USD Million
- By Project Type- Market Insights and Forecast 2022-2032, USD Million
- By Carbon Reduction Type- Market Insights and Forecast 2022-2032, USD Million
- Market Size & Growth Outlook
- South Korea Low Carbon Building Market Statistics, 2022-2032F
- Market Size & Growth Outlook
- By Revenues in USD Million
- By Quantity Sold in Million Tons
- Market Segmentation & Growth Outlook
- By Solution Type- Market Insights and Forecast 2022-2032, USD Million
- By Building Type- Market Insights and Forecast 2022-2032, USD Million
- By Project Type- Market Insights and Forecast 2022-2032, USD Million
- By Carbon Reduction Type- Market Insights and Forecast 2022-2032, USD Million
- Market Size & Growth Outlook
- India Low Carbon Building Market Statistics, 2022-2032F
- Market Size & Growth Outlook
- By Revenues in USD Million
- By Quantity Sold in Million Tons
- Market Segmentation & Growth Outlook
- By Solution Type- Market Insights and Forecast 2022-2032, USD Million
- By Building Type- Market Insights and Forecast 2022-2032, USD Million
- By Project Type- Market Insights and Forecast 2022-2032, USD Million
- By Carbon Reduction Type- Market Insights and Forecast 2022-2032, USD Million
- Market Size & Growth Outlook
- Australia & New Zealand Low Carbon Building Market Statistics, 2022-2032F
- Market Size & Growth Outlook
- By Revenues in USD Million
- By Quantity Sold in Million Tons
- Market Segmentation & Growth Outlook
- By Solution Type- Market Insights and Forecast 2022-2032, USD Million
- By Building Type- Market Insights and Forecast 2022-2032, USD Million
- By Project Type- Market Insights and Forecast 2022-2032, USD Million
- By Carbon Reduction Type- Market Insights and Forecast 2022-2032, USD Million
- Market Size & Growth Outlook
- Southeast Asia Low Carbon Building Market Statistics, 2022-2032F
- Market Size & Growth Outlook
- By Revenues in USD Million
- By Quantity Sold in Million Tons
- Market Segmentation & Growth Outlook
- By Solution Type- Market Insights and Forecast 2022-2032, USD Million
- By Building Type- Market Insights and Forecast 2022-2032, USD Million
- By Project Type- Market Insights and Forecast 2022-2032, USD Million
- By Carbon Reduction Type- Market Insights and Forecast 2022-2032, USD Million
- Market Size & Growth Outlook
- Market Size & Growth Outlook
- Competitive Outlook
- Company Profiles
- Schneider Electric SE
- Business Description
- Product Portfolio
- Collaborations & Alliances
- Recent Developments
- Financial Details
- Others
- Siemens AG
- Business Description
- Product Portfolio
- Collaborations & Alliances
- Recent Developments
- Financial Details
- Others
- Johnson Controls International plc
- Business Description
- Product Portfolio
- Collaborations & Alliances
- Recent Developments
- Financial Details
- Others
- Honeywell International Inc.
- Business Description
- Product Portfolio
- Collaborations & Alliances
- Recent Developments
- Financial Details
- Others
- Kingspan Group plc
- Business Description
- Product Portfolio
- Collaborations & Alliances
- Recent Developments
- Financial Details
- Others
- Saint-Gobain S.A.
- Business Description
- Product Portfolio
- Collaborations & Alliances
- Recent Developments
- Financial Details
- Others
- Holcim Ltd
- Business Description
- Product Portfolio
- Collaborations & Alliances
- Recent Developments
- Financial Details
- Others
- Heidelberg Materials AG
- Business Description
- Product Portfolio
- Collaborations & Alliances
- Recent Developments
- Financial Details
- Others
- ABB Ltd
- Business Description
- Product Portfolio
- Collaborations & Alliances
- Recent Developments
- Financial Details
- Others
- Trane Technologies plc
- Business Description
- Product Portfolio
- Collaborations & Alliances
- Recent Developments
- Financial Details
- Others
- Legrand S.A.
- Business Description
- Product Portfolio
- Collaborations & Alliances
- Recent Developments
- Financial Details
- Others
- ROCKWOOL A/S
- Business Description
- Product Portfolio
- Collaborations & Alliances
- Recent Developments
- Financial Details
- Others
- Owens Corning
- Business Description
- Product Portfolio
- Collaborations & Alliances
- Recent Developments
- Financial Details
- Others
- Skanska AB
- Business Description
- Product Portfolio
- Collaborations & Alliances
- Recent Developments
- Financial Details
- Others
- Lendlease Group
- Business Description
- Product Portfolio
- Collaborations & Alliances
- Recent Developments
- Financial Details
- Others
- Schneider Electric SE
- Company Profiles
- Disclaimer
| Segment | Sub-Segment |
|---|---|
| By Solution Type |
|
| By Building Type |
|
| By Project Type |
|
| By Carbon Reduction Type |
|
| By Certification Standards |
|
| Building Research Establishment Environmental Assessment Method |
|
| By Project Stage |
|
| By Region |
|
Research Methodology
This study followed a structured approach comprising four key phases to assess the size and scope of the electro-oxidation market. The process began with thorough secondary research to collect data on the target market, related markets, and broader industry context. These findings, along with preliminary assumptions and estimates, were then validated through extensive primary research involving industry experts from across the value chain. To calculate the overall market size, both top-down and bottom-up methodologies were employed. Finally, market segmentation and data triangulation techniques were applied to refine and validate segment-level estimations.
Secondary Research
The secondary research phase involved gathering data from a wide range of credible and published sources. This step helped in identifying industry trends, defining market segmentation, and understanding the market landscape and value chain.
Sources consulted during this phase included:
- Company annual reports, investor presentations, and press releases
- Industry white papers and certified publications
- Trade directories and market-recognized databases
- Articles from authoritative authors and reputable journals
- Gold and silver standard websites
Secondary research was critical in mapping out the industry's value chain and monetary flow, identifying key market segments, understanding regional variations, and tracking significant industry developments.
Other key sources:
- Financial disclosures
- Industry associations and trade bodies
- News outlets and business magazines
- Academic journals and research studies
- Paid industry databases
Primary Research
To validate secondary data and gain deeper market insights, primary research was conducted with key stakeholders across both the supply and demand sides of the market.
On the demand side, participants included decision-makers and influencers from end-user industries—such as CIOs, CTOs, and CSOs—who provided first-hand perspectives on market needs, product usage, and future expectations.
On the supply side, interviews were conducted with manufacturers, industry associations, and institutional participants to gather insights into current offerings, product pipelines, and market challenges.
Primary interviews provided critical inputs such as:
- Market size and revenue data
- Product and service breakdowns
- Market forecasts
- Regional and application-specific trends
Stakeholders consulted included:
- Leading OEM and solution providers
- Channel and distribution partners
- End users across various applications
- Independent consultants and industry specialists
Market Size Estimation and Data Triangulation
- Identifying Key Market Participants (Secondary Research)
- Goal: To identify the major players or companies in the target market. This typically involves using publicly available data sources such as industry reports, market research publications, and financial statements of companies.
- Tools: Reports from firms like Gartner, Forrester, Euromonitor, Statista, IBISWorld, and others. Public financial statements, news articles, and press releases from top market players.
- Extracting Earnings of Key Market Participants
- Goal: To estimate the earnings generated from the product or service being analyzed. This step helps in understanding the revenue potential of each market player in a specific geography.
- Methods: Earnings data can be gathered from:
- Publicly available financial reports (for listed companies).
- Interviews and primary data sources from professionals, such as Directors, VPs, SVPs, etc. This is especially useful for understanding more nuanced, internal data that isn't publicly disclosed.
- Annual reports and investor presentations of key players.
- Data Collation and Development of a Relevant Data Model
- Goal: To collate inputs from both primary and secondary sources into a structured, data-driven model for market estimation. This model will incorporate key market KPIs and any independent variables relevant to the market.
- Key KPIs: These could include:
- Market size, growth rate, and demand drivers.
- Industry-specific metrics like market share, average revenue per customer (ARPC), or average deal size.
- External variables, such as economic growth rates, inflation rates, or commodity prices, that could affect the market.
- Data Modeling: Based on this data, the market forecasts are developed for the next 5 years. A combination of trend analysis, scenario modeling, and statistical regression might be used to generate projections.
- Scenario Analysis
- Goal: To test different assumptions and validate how sensitive the market is to changes in key variables (e.g., market demand, regulatory changes, technological disruptions).
- Types of Scenarios:
- Base Case: Based on current assumptions and historical data.
- Best-Case Scenario: Assuming favorable market conditions, regulatory environments, and technological advancements.
- Worst-Case Scenario: Accounting for adverse factors, such as economic downturns, stricter regulations, or unexpected disruptions.


