Indonesia Colour Cosmetics Market Report: Trends, Growth and Forecast (2026-2032)
By Category (Eye Make-Up (Eye Liner/Pencil, Eye Shadow, Mascara, Others), Facial Make-Up (BB/CC Creams, Blusher/Bronzer/Highlighter, Foundation/Concealer, Powder, Others), Lip Products (Lip Gloss, Lip Liner/Pencil, Lipstick, Others), Nail Products (Nail Polish, Nail Treatments/Strengthener, Polish Remover, Others), Colour Cosmetics Sets/Kits), By Price (Premium, Mass), By Gender (Men, Women, Unisex), By Packaging Type (Travel/Mini Size, Standard Size, Professional/Salon Size), By Form (Creams/Gels, Lotions, Sprays, Solid, Others), By Nature (Organic, Inorganic), By Sales Channel (Retail Offline, Retail Online) ... Read more
|
Major Players
|
Indonesia Colour Cosmetics Market Statistics and Insights, 2026
- Market Size Statistics
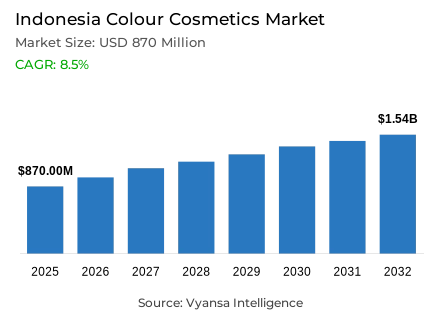
- Colour cosmetics in Indonesia is estimated at USD 870 million in 2025.
- The market size is expected to grow to USD 1.54 billion by 2032.
- Market to register a cagr of around 8.5% during 2026-32.
- Category Shares
- Lip products grabbed market share of 45%.
- Competition
- More than 20 companies are actively engaged in producing colour cosmetics in Indonesia.
- Top 5 companies acquired around 40% of the market share.
- Implora Sukses Abadi PT; Beaute Haul Indonesia PT; Mandom Indonesia Tbk PT; Paragon Technology & Innovation PT; L'Oréal Indonesia PT etc., are few of the top companies.
- Sales Channel
- Retail online grabbed 55% of the market.
Indonesia Colour Cosmetics Market Outlook
The Indonesia colour cosmetics market is set for strong growth through 2032, backed by rising interest among young end user and expanding digital engagement. In 2025, the market is estimated at USD 870 million. In 2024, colour cosmetics achieved healthy growth driven by increased demand in categories such as eye make‑up, facial make‑up, and lip products, as younger Indonesians experimented with beauty looks for self‑expression under the influence of social media and beauty influencers. These trends have encouraged broader adoption of complete makeup routines across age groups.
Local brands tailored to Indonesian skin tones and preferences — including Wardah, Emina, and Make Over — have strengthened the competitive landscape with quality, affordable offerings. Lip products continued to be the largest category in 2024, reflecting strong appeal and high awareness as essential beauty items. Facial make‑up also enjoyed dynamic growth, driven by affordable prices and rising interest among lower‑ to middle‑income end user.
Retail distribution is increasingly digital, with Retail Online capturing around 55% of total market sales, supported by platforms like Shopee, Lazada, and TikTok Shop that offer wide product variety, competitive pricing, and interactive purchasing experiences. This digital shift is especially impactful in reaching end user in both urban and rural areas.
Looking ahead, the market is expected to reach USD 1.54 billion by 2032, registering a CAGR of around 8.5% during 2026–2032. Continued social media influence, digital commerce growth, and strong local brand engagement will support sustained value expansion across the forecast period.

Indonesia Colour Cosmetics Market Growth Driver
Demographic Dividend and Young end user Base
Indonesia demographic profile serves as a key factor supporting the growing uptake of colour cosmetics among the population. As per the 2020 Indonesian Census released by Statistics Indonesia, around 70.72% of Indonesians belong to the active working age group of 15 to 64 years. This represents a substantial base of active and fashionable end users in the country who focus on self-beautification and grooming practices as young generations today.Asia is distinguished by different cultures and fast-changing end user behaviors. In this dynamic market environment, upcoming and innovative brands are emerging as pioneers that will lead the way to drive more growth in the beauty sector within Asia.
The Demographic Dividend will persist into the 2030s and 2040s, making it a continued source of market potential. The International Monetary Fund writes, With a young and growing workforce, Indonesia is expected to benefit from its favorably young population for many decades to come, seeing the employment age population forecast to peak at about 70% in 2031. According to Census 2020, Generation Z trails 27.90% of the population, making up a significant young population and end users. The two main factors of having a significant working population and involvement of the youth will continue to fuel interest and adoption of color cosmetics.
Indonesia Colour Cosmetics Market Challenge
End user Access to Reliable Product Quality Information
Information asymmetry regarding the safety and quality of products remains a critical issue in the colour cosmetics market in Indonesia. Statistics from the Badan Pusat Statistik indicate that the level of spending for household consumption is one critical area that is closely followed as an indicator of the economy, with information being produced regarding consumption. Information regarding the safety and quality of cosmetics is not readily retrievable.
The World Bank records the following household final consumption expenditure for Indonesia in 2024 USD 773.55 billion, proving consistent tracking of consumption rates. However, although consumption rates have been recorded, product safety information, ingredient testing, and beauty product-related quality metrics, which must be government-verified, do not appear to be commonly recorded and made available in end user information materials, which raises concerns about a lack of sources of expert information. A lack of easily accessible government-verified product information and quality sources could lead to uninformed product decisions through unofficial means, which appears to be a structural aspect of the market environment and could be improved through better information availability related to product regulation and end user information.
Unlock Market Intelligence
Explore the market potential with our data-driven report
Indonesia Colour Cosmetics Market Trend
Urbanization and Digital Connectivity
Urbanization is emerging as a significant trend shaping the evolving preferences and behavioral patterns of end users in indonesia. As per the Statistics Indonesia records, urban areas continue to comprise substantial populations, and the urban households consumption pattern remains an important element of the overall expenditure monitored by BPS. As depicted by the International Monetary Fund, the average annual rate for the urban population increase stands at 2.5% to 4.3%, and the rural population shrinks.
Higher urban residency falls in line with the smoother infrastructure development and digital engagement opportunities. Demographic clues derived from the Census of Population in 2020 indicate that the large workforce aged about 70.72% and youth group aged 27.90% Gen Z are rising into the urban regions alongside the growing digital facilities. Urban and digital behavior nowadays tends to set trends and consumption patterns and will likely enhance the demand for color cosmetic products in the indonesian market as the digital infrastructure facility expands.
Indonesia Colour Cosmetics Market Opportunity
Rising Spending Capacity and Consumption
The evolving consumption culture in Indonesia presents a promising opportunity for the expansion of the colour cosmetics market. Government records by Statistics Indonesia emphasize the significance of consumption expenditure as a determinant of the country’s socioeconomic condition, which is, in fact, affirmed through World Bank-taped records that the level of consumption expenditure for households in 2024 is USD 773.55 billion. CEIC Data records the per capita annual expenditure of Indonesians as USD 1,135.677 in 2024, along with the annual growth rate for expenditure by households at 5.11% in 2024 for final consumption expenditure.
As end users set aside a portion of their expenditure on personal care and other discretionary products, driven by consumption growth and the huge working population, there exists a huge demand potential for higher expenditure on cosmetic products, including color cosmetics. With a huge working class of 190.72 million citizens, sandwiched between the working age percentage of 70.72%, along with an annual growth rate in consumption expenditure of 5.11%, structural factors exist to promote expenditures on discretionary products like cosmetic products. Together with increasing digital online platforms and a huge concentration of end users in a city or urban milieu, cosmetic manufacturers can easily match end users’ demands and preferences.
Unlock Market Intelligence
Explore the market potential with our data-driven report
Indonesia Colour Cosmetics Market Segmentation Analysis
By Category
- Eye Make-Up
- Eye Liner/Pencil
- Eye Shadow
- Mascara
- Others
- Facial Make-Up
- BB/CC Creams
- Blusher/Bronzer/Highlighter
- Foundation/Concealer
- Powder
- Others
- Lip Products
- Lip Gloss
- Lip Liner/Pencil
- Lipstick
- Others
- Nail Products
- Nail Polish
- Nail Treatments/Strengthener
- Polish Remover
- Others
- Colour Cosmetics Sets/Kits
The segment with highest market share under category is lip products, which holds a market share of around 45% of the colour cosmetics market in Indonesia. Lip products continue to be a staple in the makeup arsenal of many end users who are familiar with the productand who aspire towards mood-changing beautification. Lip sticks, tints, and lip glosses in particular are most in demand.
The significance of lipstick is further fueled by local brands as well as affordable international brands that appeal to price-sensitive end users, especially younger generations. It has been noticed that this category has a high share as it serves not only as an entry point but also as a mainstay when it comes to everyday makeup.

By Sales Channel
- Retail Offline
- Retail Online
The segment with highest market share under sales channel is retail online, which is around 55% of total market sales. Retail online shopping platforms like Shopee, Lazada, and TikTok Shop are driving factors for easily accessing color cosmetics offerings in Indonesia, and end users can now easily search and purchase color cosmetics online. The online shopping platform provides greater product interaction in terms of product reviews and tutorials. T
he success of retail online can be supported by means of promotions, extensive merchandise options, and the potential to cater to both urban and rural end users. The continued expansion of retail online infrastructure is poised to position digital platforms as a pivotal medium for engaging end users and supporting distribution channels, while complementing existing physical retail networks.
List of Companies Covered in Indonesia Colour Cosmetics Market
The companies listed below are highly influential in the Indonesia colour cosmetics market, with a significant market share and a strong impact on industry developments.
- Implora Sukses Abadi PT
- Beaute Haul Indonesia PT
- Mandom Indonesia Tbk PT
- Paragon Technology & Innovation PT
- L'Oréal Indonesia PT
- Hebe Beauty Style PT
- FLC Internasional Indonesia PT
- Eka Jaya Internasional PT
- Tempo Scan Pacific Tbk PT
- Luxasia Indonesia PT
Competitive Landscape
Indonesia’s colour cosmetics market in 2025 reflects an increasingly competitive landscape led by Paragon Technology & Innovation, which maintains leadership through Wardah, Make Over, and Emina, supported by strong halal positioning, local relevance, and balanced pricing-quality perception. Wardah continues to resonate with Millennials and middle-income consumers, while Make Over strengthens its premium-accessible appeal with dermatologically tested products positioned against global brands such as Maybelline. Hebe Beauty Style emerged as the fastest-growing player, leveraging a multi-brand strategy across Y.O.U Beauty, Barenbliss, Dazzle Me, and Glamfix to target distinct segments and price tiers, supported by aggressive influencer marketing and Korean-inspired branding cues that reinforce trust and aspirational appeal. Meanwhile, affordable Chinese and rising local brands intensify competition online, pushing incumbents to innovate across hybrid formulations, shade relevance, and digital engagement as consumers increasingly mix mass, premium-accessible, and trend-driven labels.
Frequently Asked Questions
Related Report
1. Market Segmentation
1.1. Research Scope
1.2. Research Methodology
1.3. Definitions and Assumptions
2. Executive Summary
3. Indonesia Colour Cosmetics Market Policies, Regulations, and Standards
4. Indonesia Colour Cosmetics Market Dynamics
4.1. Growth Factors
4.2. Challenges
4.3. Trends
4.4. Opportunities
5. Indonesia Colour Cosmetics Market Statistics, 2022-2032F
5.1. Market Size & Growth Outlook
5.1.1.By Revenues in USD Million
5.2. Market Segmentation & Growth Outlook
5.2.1.By Category
5.2.1.1. Eye Make-Up- Market Insights and Forecast 2022-2032, USD Million
5.2.1.1.1. Eye Liner/Pencil- Market Insights and Forecast 2022-2032, USD Million
5.2.1.1.2. Eye Shadow- Market Insights and Forecast 2022-2032, USD Million
5.2.1.1.3. Mascara- Market Insights and Forecast 2022-2032, USD Million
5.2.1.1.4. Others- Market Insights and Forecast 2022-2032, USD Million
5.2.1.2. Facial Make-Up- Market Insights and Forecast 2022-2032, USD Million
5.2.1.2.1. BB/CC Creams- Market Insights and Forecast 2022-2032, USD Million
5.2.1.2.2. Blusher/Bronzer/Highlighter- Market Insights and Forecast 2022-2032, USD Million
5.2.1.2.3. Foundation/Concealer- Market Insights and Forecast 2022-2032, USD Million
5.2.1.2.4. Powder- Market Insights and Forecast 2022-2032, USD Million
5.2.1.2.5. Others- Market Insights and Forecast 2022-2032, USD Million
5.2.1.3. Lip Products- Market Insights and Forecast 2022-2032, USD Million
5.2.1.3.1. Lip Gloss- Market Insights and Forecast 2022-2032, USD Million
5.2.1.3.2. Lip Liner/Pencil- Market Insights and Forecast 2022-2032, USD Million
5.2.1.3.3. Lipstick- Market Insights and Forecast 2022-2032, USD Million
5.2.1.3.4. Others- Market Insights and Forecast 2022-2032, USD Million
5.2.1.4. Nail Products- Market Insights and Forecast 2022-2032, USD Million
5.2.1.4.1. Nail Polish- Market Insights and Forecast 2022-2032, USD Million
5.2.1.4.2. Nail Treatments/Strengthener- Market Insights and Forecast 2022-2032, USD Million
5.2.1.4.3. Polish Remover- Market Insights and Forecast 2022-2032, USD Million
5.2.1.4.4. Others- Market Insights and Forecast 2022-2032, USD Million
5.2.1.5. Colour Cosmetics Sets/Kits- Market Insights and Forecast 2022-2032, USD Million
5.2.2.By Price
5.2.2.1. Premium- Market Insights and Forecast 2022-2032, USD Million
5.2.2.2. Mass- Market Insights and Forecast 2022-2032, USD Million
5.2.3.By Gender
5.2.3.1. Men- Market Insights and Forecast 2022-2032, USD Million
5.2.3.2. Women- Market Insights and Forecast 2022-2032, USD Million
5.2.3.3. Unisex- Market Insights and Forecast 2022-2032, USD Million
5.2.4.By Packaging Type
5.2.4.1. Travel/Mini Size - Market Insights and Forecast 2022-2032, USD Million
5.2.4.2. Standard Size - Market Insights and Forecast 2022-2032, USD Million
5.2.4.3. Professional/Salon Size- Market Insights and Forecast 2022-2032, USD Million
5.2.5.By Form
5.2.5.1. Creams/Gels- Market Insights and Forecast 2022-2032, USD Million
5.2.5.2. Lotions- Market Insights and Forecast 2022-2032, USD Million
5.2.5.3. Sprays- Market Insights and Forecast 2022-2032, USD Million
5.2.5.4. Solid- Market Insights and Forecast 2022-2032, USD Million
5.2.5.5. Others- Market Insights and Forecast 2022-2032, USD Million
5.2.6.By Nature
5.2.6.1. Organic- Market Insights and Forecast 2022-2032, USD Million
5.2.6.2. Inorganic- Market Insights and Forecast 2022-2032, USD Million
5.2.7.By Sales Channel
5.2.7.1. Retail Offline- Market Insights and Forecast 2022-2032, USD Million
5.2.7.2. Retail Online- Market Insights and Forecast 2022-2032, USD Million
5.2.8.By Competitors
5.2.8.1. Competition Characteristics
5.2.8.2. Market Share & Analysis
6. Indonesia Eye Make-Up Colour Cosmetics Market Statistics, 2022-2032
6.1. Market Size & Growth Outlook
6.1.1.By Revenues in USD Million
6.2. Market Segmentation & Growth Outlook
6.2.1.By Category- Market Insights and Forecast 2022-2032, USD Million
6.2.2.By Price- Market Insights and Forecast 2022-2032, USD Million
6.2.3.By Gender- Market Insights and Forecast 2022-2032, USD Million
6.2.4.By Packaging Type- Market Insights and Forecast 2022-2032, USD Million
6.2.5.By Form- Market Insights and Forecast 2022-2032, USD Million
6.2.6.By Nature- Market Insights and Forecast 2022-2032, USD Million
6.2.7.By Sales Channel- Market Insights and Forecast 2022-2032, USD Million
7. Indonesia Facial Make-Up Colour Cosmetics Market Statistics, 2022-2032
7.1. Market Size & Growth Outlook
7.1.1.By Revenues in USD Million
7.2. Market Segmentation & Growth Outlook
7.2.1.By Category- Market Insights and Forecast 2022-2032, USD Million
7.2.2.By Price- Market Insights and Forecast 2022-2032, USD Million
7.2.3.By Gender- Market Insights and Forecast 2022-2032, USD Million
7.2.4.By Packaging Type- Market Insights and Forecast 2022-2032, USD Million
7.2.5.By Form- Market Insights and Forecast 2022-2032, USD Million
7.2.6.By Nature- Market Insights and Forecast 2022-2032, USD Million
7.2.7.By Sales Channel- Market Insights and Forecast 2022-2032, USD Million
8. Indonesia Lip Products Colour Cosmetics Market Statistics, 2022-2032
8.1. Market Size & Growth Outlook
8.1.1.By Revenues in USD Million
8.2. Market Segmentation & Growth Outlook
8.2.1.By Category- Market Insights and Forecast 2022-2032, USD Million
8.2.2.By Price- Market Insights and Forecast 2022-2032, USD Million
8.2.3.By Gender- Market Insights and Forecast 2022-2032, USD Million
8.2.4.By Packaging Type- Market Insights and Forecast 2022-2032, USD Million
8.2.5.By Form- Market Insights and Forecast 2022-2032, USD Million
8.2.6.By Nature- Market Insights and Forecast 2022-2032, USD Million
8.2.7.By Sales Channel- Market Insights and Forecast 2022-2032, USD Million
9. Indonesia Nail Products Colour Cosmetics Market Statistics, 2022-2032
9.1. Market Size & Growth Outlook
9.1.1.By Revenues in USD Million
9.2. Market Segmentation & Growth Outlook
9.2.1.By Category- Market Insights and Forecast 2022-2032, USD Million
9.2.2.By Price- Market Insights and Forecast 2022-2032, USD Million
9.2.3.By Gender- Market Insights and Forecast 2022-2032, USD Million
9.2.4.By Packaging Type- Market Insights and Forecast 2022-2032, USD Million
9.2.5.By Form- Market Insights and Forecast 2022-2032, USD Million
9.2.6.By Nature- Market Insights and Forecast 2022-2032, USD Million
9.2.7.By Sales Channel- Market Insights and Forecast 2022-2032, USD Million
10. Indonesia Colour Cosmetics Sets/Kits Colour Cosmetics Market Statistics, 2022-2032
10.1. Market Size & Growth Outlook
10.1.1. By Revenues in USD Million
10.2. Market Segmentation & Growth Outlook
10.2.1. By Price- Market Insights and Forecast 2022-2032, USD Million
10.2.2. By Gender- Market Insights and Forecast 2022-2032, USD Million
10.2.3. By Packaging Type- Market Insights and Forecast 2022-2032, USD Million
10.2.4. By Form- Market Insights and Forecast 2022-2032, USD Million
10.2.5. By Nature- Market Insights and Forecast 2022-2032, USD Million
10.2.6. By Sales Channel- Market Insights and Forecast 2022-2032, USD Million
11. Competitive Outlook
11.1. Company Profiles
11.1.1. Paragon Technology & Innovation PT
11.1.1.1. Business Description
11.1.1.2. Product Portfolio
11.1.1.3. Collaborations & Alliances
11.1.1.4. Recent Developments
11.1.1.5. Financial Details
11.1.1.6. Others
11.1.2. L'Oréal Indonesia PT
11.1.2.1. Business Description
11.1.2.2. Product Portfolio
11.1.2.3. Collaborations & Alliances
11.1.2.4. Recent Developments
11.1.2.5. Financial Details
11.1.2.6. Others
11.1.3. Hebe Beauty Style PT
11.1.3.1. Business Description
11.1.3.2. Product Portfolio
11.1.3.3. Collaborations & Alliances
11.1.3.4. Recent Developments
11.1.3.5. Financial Details
11.1.3.6. Others
11.1.4. FLC Internasional Indonesia PT
11.1.4.1. Business Description
11.1.4.2. Product Portfolio
11.1.4.3. Collaborations & Alliances
11.1.4.4. Recent Developments
11.1.4.5. Financial Details
11.1.4.6. Others
11.1.5. Eka Jaya Internasional PT
11.1.5.1. Business Description
11.1.5.2. Product Portfolio
11.1.5.3. Collaborations & Alliances
11.1.5.4. Recent Developments
11.1.5.5. Financial Details
11.1.5.6. Others
11.1.6. Implora Sukses Abadi PT
11.1.6.1. Business Description
11.1.6.2. Product Portfolio
11.1.6.3. Collaborations & Alliances
11.1.6.4. Recent Developments
11.1.6.5. Financial Details
11.1.6.6. Others
11.1.7. Beaute Haul Indonesia PT
11.1.7.1. Business Description
11.1.7.2. Product Portfolio
11.1.7.3. Collaborations & Alliances
11.1.7.4. Recent Developments
11.1.7.5. Financial Details
11.1.7.6. Others
11.1.8. Mandom Indonesia Tbk PT
11.1.8.1. Business Description
11.1.8.2. Product Portfolio
11.1.8.3. Collaborations & Alliances
11.1.8.4. Recent Developments
11.1.8.5. Financial Details
11.1.8.6. Others
11.1.9. Tempo Scan Pacific Tbk PT
11.1.9.1. Business Description
11.1.9.2. Product Portfolio
11.1.9.3. Collaborations & Alliances
11.1.9.4. Recent Developments
11.1.9.5. Financial Details
11.1.9.6. Others
11.1.10. Luxasia Indonesia PT
11.1.10.1.Business Description
11.1.10.2.Product Portfolio
11.1.10.3.Collaborations & Alliances
11.1.10.4.Recent Developments
11.1.10.5.Financial Details
11.1.10.6.Others
12. Disclaimer
| Segment | Sub-Segment |
|---|---|
| By Category |
|
| By Price |
|
| By Gender |
|
| By Packaging Type |
|
| By Form |
|
| By Nature |
|
| By Sales Channel |
|
Research Methodology
This study followed a structured approach comprising four key phases to assess the size and scope of the electro-oxidation market. The process began with thorough secondary research to collect data on the target market, related markets, and broader industry context. These findings, along with preliminary assumptions and estimates, were then validated through extensive primary research involving industry experts from across the value chain. To calculate the overall market size, both top-down and bottom-up methodologies were employed. Finally, market segmentation and data triangulation techniques were applied to refine and validate segment-level estimations.
Secondary Research
The secondary research phase involved gathering data from a wide range of credible and published sources. This step helped in identifying industry trends, defining market segmentation, and understanding the market landscape and value chain.
Sources consulted during this phase included:
- Company annual reports, investor presentations, and press releases
- Industry white papers and certified publications
- Trade directories and market-recognized databases
- Articles from authoritative authors and reputable journals
- Gold and silver standard websites
Secondary research was critical in mapping out the industry's value chain and monetary flow, identifying key market segments, understanding regional variations, and tracking significant industry developments.
Other key sources:
- Financial disclosures
- Industry associations and trade bodies
- News outlets and business magazines
- Academic journals and research studies
- Paid industry databases
Primary Research
To validate secondary data and gain deeper market insights, primary research was conducted with key stakeholders across both the supply and demand sides of the market.
On the demand side, participants included decision-makers and influencers from end-user industries—such as CIOs, CTOs, and CSOs—who provided first-hand perspectives on market needs, product usage, and future expectations.
On the supply side, interviews were conducted with manufacturers, industry associations, and institutional participants to gather insights into current offerings, product pipelines, and market challenges.
Primary interviews provided critical inputs such as:
- Market size and revenue data
- Product and service breakdowns
- Market forecasts
- Regional and application-specific trends
Stakeholders consulted included:
- Leading OEM and solution providers
- Channel and distribution partners
- End users across various applications
- Independent consultants and industry specialists
Market Size Estimation and Data Triangulation
- Identifying Key Market Participants (Secondary Research)
- Goal: To identify the major players or companies in the target market. This typically involves using publicly available data sources such as industry reports, market research publications, and financial statements of companies.
- Tools: Reports from firms like Gartner, Forrester, Euromonitor, Statista, IBISWorld, and others. Public financial statements, news articles, and press releases from top market players.
- Extracting Earnings of Key Market Participants
- Goal: To estimate the earnings generated from the product or service being analyzed. This step helps in understanding the revenue potential of each market player in a specific geography.
- Methods: Earnings data can be gathered from:
- Publicly available financial reports (for listed companies).
- Interviews and primary data sources from professionals, such as Directors, VPs, SVPs, etc. This is especially useful for understanding more nuanced, internal data that isn't publicly disclosed.
- Annual reports and investor presentations of key players.
- Data Collation and Development of a Relevant Data Model
- Goal: To collate inputs from both primary and secondary sources into a structured, data-driven model for market estimation. This model will incorporate key market KPIs and any independent variables relevant to the market.
- Key KPIs: These could include:
- Market size, growth rate, and demand drivers.
- Industry-specific metrics like market share, average revenue per customer (ARPC), or average deal size.
- External variables, such as economic growth rates, inflation rates, or commodity prices, that could affect the market.
- Data Modeling: Based on this data, the market forecasts are developed for the next 5 years. A combination of trend analysis, scenario modeling, and statistical regression might be used to generate projections.
- Scenario Analysis
- Goal: To test different assumptions and validate how sensitive the market is to changes in key variables (e.g., market demand, regulatory changes, technological disruptions).
- Types of Scenarios:
- Base Case: Based on current assumptions and historical data.
- Best-Case Scenario: Assuming favorable market conditions, regulatory environments, and technological advancements.
- Worst-Case Scenario: Accounting for adverse factors, such as economic downturns, stricter regulations, or unexpected disruptions.


