Global Water Quality Testing & Monitoring Market Report: Trends, Growth and Forecast (2026-2032)
By Product Type (Water Quality Testing Instruments, Water Quality Sensors & Probes, Test Kits & Reagents, Online Water Quality Monitoring Systems, Portable Water Testing Devices, Software & Data Management Platforms, Others), By Parameter Type (Physical Parameters, Chemical Parameters, Biological/Microbiological Parameters, Radiological Parameters, Others), By Technology (Laboratory-Based Testing, Portable/Field Testing, Online/Real-Time Monitoring, IoT-Based Monitoring, Manual Testing, Others), By Water Source (Drinking Water, Wastewater & Effluent, Surface Water, Groundwater, Industrial Process Water, Recreational Water, Others), By End User (Municipal Water Utilities, Industrial Facilities, Environmental Agencies, Commercial Testing Laboratories, Research & Academic Institutes, Residential & Commercial Users, Others), By Sales Channel (Retail Online (Company-Owned Websites, E-Commerce Platforms, Online Laboratory Service Portals, B2B Procurement Platforms), Retail Offline (Direct Sales, Distributors/Dealers, Specialty Instrument Stores, Laboratory Equipment Suppliers, Local Authorized Sales Partners)), By Region (North America, South America, Europe, Middle East & Africa, Asia Pacific) ... Read more
|
Major Players
|
Global Water Quality Testing & Monitoring Market Statistics and Insights, 2026
- Market Size Statistics
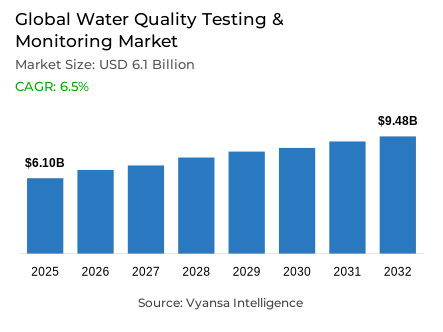
- Water quality testing & monitoring market size in Global was valued at USD 6.1 billion in 2025 and is estimated at USD 6.5 billion in 2026.
- The market size is expected to grow to USD 9.48 billion by 2032.
- Market to register a CAGR of around 6.5% during 2026-32.
- Product Type Shares
- Online water quality monitoring systems grabbed market share of 25%.
- Competition
- More than 25 companies are actively engaged in producing water quality testing & monitoring.
- Top 5 companies acquired around 20% of the market share.
- ABB, Emerson, Yokogawa Electric, Hach, Xylem Analytics/YSI etc., are few of the top companies.
- End User
- Municipal water utilities grabbed 30% of the market.
- Region
- North America leads with a 35% share of the global market.
Global Water Quality Testing & Monitoring Market Outlook
The Global Water Quality Testing and Monitoring Market was valued at USD 6.1 billion in 2025 and is projected to advance from USD 6.5 billion in 2026 to USD 9.48 billion by 2032, registering a CAGR of 6.5% across the forecast period. This sustained and compliance-anchored expansion reflects a structurally sound growth environment shaped by intensifying government, utility, and industrial focus on water safety assurance, regulatory adherence, and continuous quality assessment across increasingly complex supply, treatment, and distribution systems worldwide. Growth is not cyclically driven but institutionally mandated, anchored in the non-discretionary nature of water safety monitoring obligations across both public health and environmental regulatory frameworks globally.
Product demand is led by Online Water Quality Monitoring Systems, which command 25% of the overall product type segment. This position reflects the rising and broadly motivated institutional preference for real-time water quality monitoring systems that enable continuous observation, faster operational response, and more reliable management of changing water conditions across treatment and distribution infrastructure. As procurement decisions shift progressively from periodic sampling toward always-on digital monitoring, solutions that support continuous data capture and integrated operational control are attracting the most commercially consistent and growing procurement demand across the global product landscape.
End-user demand is anchored by Municipal Water Utilities, which hold 30% of the overall market within the end-user segment. This prominence reflects the essential and non-discretionary role of public health water monitoring in helping utilities maintain regulatory compliance, manage treatment performance, and deliver consistent service quality across public water supply networks. As regulatory expectations around water quality documentation and traceability continue to strengthen, utility-led procurement is generating the most stable and institutionally dependable revenue base within the global market structure.
Regional performance is led by North America, which commands a 35% share of total global demand. This geographic concentration reflects the region's mature regulatory enforcement environment, deep infrastructure investment commitment, and high adoption of advanced monitoring technology across both municipal and industrial water management contexts. Taken together, online system product leadership, municipal utility end-user dominance, and North America's commanding regional position collectively define a water quality testing and monitoring market that is compliance-driven, institutionally supported, and well-positioned for sustained value growth through 2032.

Global Water Quality Testing & Monitoring Market Growth Driver
Persistent Global Water Access Deficits Sustain Institutional Monitoring Investment
The large-scale and structurally persistent global gap in safely managed water access and sanitation services is creating a commercially durable and broadly distributed demand foundation for water quality testing equipment and monitoring infrastructure by sustaining continuous institutional pressure on governments, utilities, and public health agencies to verify water safety more frequently, document compliance more rigorously, and expand testing coverage across underserved and at-risk populations. As per data published by the World Health Organization and UNICEF, 2.1 billion people still lacked access to safely managed drinking water in 2024, including 106 million people consuming directly from untreated surface water sources, confirming that the scale of unverified water quality exposure is sufficient to maintain multi-decade institutional investment in testing and monitoring infrastructure across both developing and transitioning economies.
The breadth of the sanitation and hygiene deficit further amplifies this demand driver by widening the surveillance burden placed on utilities and regulators across the full water service delivery chain. According to statistics released by the World Health Organization and UNICEF, 3.4 billion people still lacked safely managed sanitation in 2024 while 1.7 billion people lacked basic hygiene services at home, confirming that the population exposed to waterborne contamination risk remains large enough to sustain high-frequency sampling, continuous compliance verification, and expanding demand for traceable digital monitoring records. As public health expectations around water safety documentation strengthen across both regulated and less formally governed markets, institutional procurement of drinking water quality testing systems is expected to remain persistently active throughout the forecast period.
Global Water Quality Testing & Monitoring Market Challenge
Implementation Capacity Gaps Constrain the Pace of Monitoring Infrastructure Deployment
The most consequential structural constraint on market expansion is not the absence of institutional water safety ambition but the persistent gap between approved policy frameworks and the financing depth, staffing capacity, and execution capability required to translate those frameworks into deployed monitoring infrastructure at meaningful scale. Based on data from the WHO and UNICEF Global Analysis and Assessment of Sanitation and Drinking Water 2025 report, fewer than 13% of countries reported having sufficient financial and human resources to implement their approved drinking-water and sanitation plans, confirming that execution capacity constraints are a structural feature of the implementation environment rather than a temporary gap in a small number of markets. For water quality monitoring system companies and equipment providers, this execution deficit extends procurement timelines, slows monitoring network expansion, and creates deployment uncertainty in the lower-capacity utility environments where water safety improvement need is most acute.
The commercial implications of this challenge are nevertheless nuanced, because capacity constraints reshape rather than eliminate market demand. As indicated by authoritative sources at the WHO and UNICEF GLAAS 2025 report, 70% of countries reported approved urban drinking-water plans and 67% reported approved rural drinking-water plans despite execution capacity remaining far below the level required for full plan implementation, confirming that documented policy intent is broadly present even where deployment speed is constrained. For equipment and platform providers, this environment favours integrated solution offerings that combine monitoring hardware, service support, and compliance-ready reporting capability within procurement packages that reduce implementation complexity and fit within the phased and budget-constrained upgrade cycles that characterise lower-capacity utility procurement across emerging and developing market geographies.
Unlock Market Intelligence
Explore the market potential with our data-driven report
Global Water Quality Testing & Monitoring Market Trend
Continuous Monitoring Is Displacing Periodic Testing as the Institutional Operating Standard
A well-defined and commercially consequential structural trend is reshaping global water quality management practice as governments, regulators, and utilities progressively formalise continuous and data-driven monitoring frameworks in place of periodic manual sampling approaches, creating expanding and recurring demand for IoT water quality monitoring infrastructure, connected sensor networks, and automated reporting platforms across municipal and industrial water management contexts. Evidence drawn from public data released by the WHO and UNICEF Global Analysis and Assessment of Sanitation and Drinking Water 2025 confirms that 75% of countries have a defined set of national monitoring indicators for water, sanitation, and hygiene policies and plans, while 61% of countries reported a formal process to regularly monitor those indicators and incorporate results into sector performance reviews, confirming that structured and ongoing monitoring is becoming a globally normalised institutional practice rather than a capability reserved for the most advanced water management systems.
The regulatory foundation supporting this trend is both broad and deepening in ways that strengthen the commercial sustainability of continuous monitoring adoption. In line with findings from the WHO and UNICEF GLAAS 2025 report, nearly 90% of countries reported having water quality standards for drinking water while more than 75% reported defined service delivery regulations or standards, confirming that the compliance framework requiring documented and regular water quality verification is already in place across the vast majority of national water governance environments. For providers of cloud-based water quality monitoring and automated reporting platforms, this regulatory breadth creates a structurally expanding and institutionally mandated procurement environment that is progressively converting monitoring from a discretionary investment into a non-negotiable operational requirement across both developed and developing market utility contexts.
Global Water Quality Testing & Monitoring Market Opportunity
Under-Digitised Utility Infrastructure Creates a Large and Commercially Accessible Modernisation Pipeline
The vast installed base of water utilities across low- and middle-income countries that continue to rely on low-technology, labour-intensive, and manually managed monitoring practices represents the most commercially significant and structurally durable growth opportunity within the global water quality testing and monitoring market, as the digital retrofitting of these utilities creates multi-layered revenue streams spanning connected sensor deployment, analytics software licensing, and recurring maintenance and calibration service contracts. As per official figures from the World Bank, fewer than 10% of water utilities in low- and middle-income countries currently use tools such as artificial intelligence, big data analytics, or digital twins in their operational management, confirming that the proportion of the global utility base still open to AI-based water quality analytics and smart sensor modernisation is exceptionally large and structurally addressable through commercially scalable platform offerings.
The financial investment environment supporting this modernisation opportunity is both substantial and increasingly well-justified by documented economic returns. Data compiled from internationally recognised public authorities at the World Bank confirms that meeting water supply and sanitation Sustainable Development Goals requires between USD 131 billion and USD 140 billion in annual investment, representing nearly double current public funding levels, while every USD 1 spent on water supply and sanitation in Africa generates USD 7 in economic return. For monitoring technology providers capable of positioning their solutions as integral components of capital-efficient and high-return water infrastructure upgrades, this investment environment creates a commercially compelling and long-cycle procurement opportunity that is expected to strengthen progressively as multilateral and national water sector funding commitments scale through the forecast period.
Global Water Quality Testing & Monitoring Market Regional Analysis

By Region
- North America
- South America
- Europe
- Middle East & Africa
- Asia Pacific
North America holds the commanding position within the global water quality testing and monitoring demand landscape with a 35% market share, a concentration that reflects the region's mature and rigorously enforced regulatory compliance environment, deep public and private water infrastructure investment commitment, and high institutional adoption of advanced monitoring technology across both municipal utility and industrial water management contexts. The North America water quality monitoring demand trajectory is underpinned by comprehensive federal and state-level water quality regulatory frameworks including the Safe Drinking Water Act and Clean Water Act in the United States that mandate continuous compliance documentation and create persistent institutional procurement demand for monitoring equipment, analytical platforms, and professional service support across the full spectrum of public and industrial water management applications throughout the region.
At the broader global level, the regional demand architecture confirms that while North America carries the largest current market share, the Asia-Pacific water quality testing industry and emerging market geographies across Latin America, the Middle East, and Sub-Saharan Africa represent the most commercially dynamic sources of incremental demand growth as regulatory frameworks formalise, infrastructure investment scales, and utility digitalisation programmes progressively expand the installed monitoring infrastructure base across previously underserved and lower-capacity water management environments. As these geographies develop their water quality regulatory and operational frameworks alongside North America's established compliance leadership and Europe's sophisticated monitoring technology adoption, the global market is expected to benefit from a progressively broader and more geographically distributed commercial growth foundation throughout the forecast period.
Unlock Market Intelligence
Explore the market potential with our data-driven report
Global Water Quality Testing & Monitoring Market Segmentation Analysis
By Product Type
- Water Quality Testing Instruments
- Water Quality Sensors & Probes
- Test Kits & Reagents
- Online Water Quality Monitoring Systems
- Portable Water Testing Devices
- Software & Data Management Platforms
- Others
Online Water Quality Monitoring Systems command the highest share within the product type category at 25%, reflecting consistent and institutionally motivated demand for water quality sensors and probes and continuous monitoring platforms that enable real-time operational visibility, faster anomaly detection, and more reliable management of changing water quality conditions across treatment and distribution infrastructure. Utilities, industrial operators, and regulatory agencies consistently prioritise online monitoring systems because they address the most fundamental and continuously evolving water quality management requirement, delivering a commercial proposition that is directly tied to high-frequency data capture, automated compliance documentation, and operational control benefits that periodic sampling-based approaches are structurally unable to provide at equivalent reliability or speed. Its market leadership confirms that continuous data availability, operational integration capability, and compliance reporting functionality are the most commercially durable procurement drivers within the global water quality testing and monitoring product landscape.
Its sustained commercial dominance also reflects a wider market dynamic in which the formalisation of continuous monitoring standards across national regulatory frameworks is progressively converting online system adoption from a premium upgrade decision into a baseline operational requirement for utilities and industrial water managers subject to documented compliance obligations. Online monitoring systems maintain their product leadership because they serve the broadest range of end-user applications, support the most extensive and recurring revenue streams through consumable, calibration, and service components, and benefit from deepening integration with smart water quality sensors and digital water management platform ecosystems. As sensor technology advances and connectivity costs decline, this segment is expected to strengthen its lead throughout the forecast period.

By End User
- Municipal Water Utilities
- Industrial Facilities
- Environmental Agencies
- Commercial Testing Laboratories
- Research & Academic Institutes
- Residential & Commercial Users
- Others
Municipal Water Utilities command the highest share within the end-user category at 30%, establishing public water infrastructure operators as the most commercially significant and institutionally dependable revenue-generating end-user group within the global water quality testing and monitoring market. Utilities consistently represent the highest-frequency and most compliance-driven procurement segment because they operate under non-negotiable public health documentation requirements, manage the largest and most complex water treatment and distribution networks, and face the strongest and most formally enforced regulatory scrutiny around water quality verification, with municipal water treatment monitoring and distribution network surveillance both contributing to the commercial depth and recurring procurement intensity of this end-user segment across regional and national markets. Its dominant position confirms that regulatory obligation, public accountability, and operational scale are the primary commercial demand drivers within the global water quality monitoring end-user landscape.
Its continued commercial leadership is expected to deepen through the forecast period as national water quality regulatory frameworks strengthen, monitoring indicator requirements become more formalised across additional countries, and the shift toward continuous and digitally documented compliance monitoring progressively increases the installed sensor density and software platform requirements within municipal water management operations globally. As environmental compliance monitoring standards advance and utilities invest in more integrated and data-driven operational frameworks, municipal water utilities are expected to retain and strengthen their position as the most strategically significant and highest-volume procurement segment within the Global Water Quality Testing and Monitoring Market through 2032.
Market Players in Global Water Quality Testing & Monitoring Market
These market players maintain a significant presence in the Global water quality testing & monitoring market sector and contribute to its ongoing evolution.
- ABB
- Emerson
- Yokogawa Electric
- Hach
- Xylem Analytics/YSI
- Thermo Fisher Scientific
- HORIBA
- Endress+Hauser
- Teledyne ISCO
- Agilent Technologies
- Shimadzu
- Metrohm
- METTLER TOLEDO Thornton
- Hanna Instruments
- Lovibond / Tintometer
Market News & Updates
- Hach, 2026:
Hach launched the NP6000sc Phosphate Analyzer for nutrient monitoring in water treatment facilities. The analyzer adds an enhanced grab-sample feature, a lighter FX6 filter, continuous measurement across three ranges, and extended cleaning frequency. The launch strengthens Hach’s online phosphate monitoring portfolio for municipal and industrial water compliance.
- ABB, 2025:
ABB launched the AeroStar dissolved oxygen sensors and AWT424 multi-input transmitter for continuous water analysis. The sensors measure ultra-low dissolved oxygen levels, while the transmitter connects up to four sensors for pH, ORP, conductivity, turbidity, chlorine, and dissolved oxygen monitoring. The update expands ABB’s digital water quality monitoring offering.
Frequently Asked Questions
Related Report
- Market Segmentation
- Research Scope
- Research Methodology
- Definitions and Assumptions
- Executive Summary
- Global Water Quality Testing & Monitoring Market Policies, Regulations, and Standards
- Global Water Quality Testing & Monitoring Market Dynamics
- Growth Factors
- Challenges
- Trends
- Opportunities
- Global Water Quality Testing & Monitoring Market Statistics, 2022-2032F
- Market Size & Growth Outlook
- By Revenues in USD Million
- Market Segmentation & Growth Outlook
- By Product Type
- Water Quality Testing Instruments- Market Insights and Forecast 2022-2032, USD Million
- Water Quality Sensors & Probes- Market Insights and Forecast 2022-2032, USD Million
- Test Kits & Reagents- Market Insights and Forecast 2022-2032, USD Million
- Online Water Quality Monitoring Systems- Market Insights and Forecast 2022-2032, USD Million
- Portable Water Testing Devices- Market Insights and Forecast 2022-2032, USD Million
- Software & Data Management Platforms- Market Insights and Forecast 2022-2032, USD Million
- Others- Market Insights and Forecast 2022-2032, USD Million
- By Parameter Type
- Physical Parameters- Market Insights and Forecast 2022-2032, USD Million
- Chemical Parameters- Market Insights and Forecast 2022-2032, USD Million
- Biological/Microbiological Parameters- Market Insights and Forecast 2022-2032, USD Million
- Radiological Parameters- Market Insights and Forecast 2022-2032, USD Million
- Others- Market Insights and Forecast 2022-2032, USD Million
- By Technology
- Laboratory-Based Testing- Market Insights and Forecast 2022-2032, USD Million
- Portable/Field Testing- Market Insights and Forecast 2022-2032, USD Million
- Online/Real-Time Monitoring- Market Insights and Forecast 2022-2032, USD Million
- IoT-Based Monitoring- Market Insights and Forecast 2022-2032, USD Million
- Manual Testing- Market Insights and Forecast 2022-2032, USD Million
- Others- Market Insights and Forecast 2022-2032, USD Million
- By Water Source
- Drinking Water- Market Insights and Forecast 2022-2032, USD Million
- Wastewater & Effluent- Market Insights and Forecast 2022-2032, USD Million
- Surface Water- Market Insights and Forecast 2022-2032, USD Million
- Groundwater- Market Insights and Forecast 2022-2032, USD Million
- Industrial Process Water- Market Insights and Forecast 2022-2032, USD Million
- Recreational Water- Market Insights and Forecast 2022-2032, USD Million
- Others- Market Insights and Forecast 2022-2032, USD Million
- By End User
- Municipal Water Utilities- Market Insights and Forecast 2022-2032, USD Million
- Industrial Facilities- Market Insights and Forecast 2022-2032, USD Million
- Environmental Agencies- Market Insights and Forecast 2022-2032, USD Million
- Commercial Testing Laboratories- Market Insights and Forecast 2022-2032, USD Million
- Research & Academic Institutes- Market Insights and Forecast 2022-2032, USD Million
- Residential & Commercial Users- Market Insights and Forecast 2022-2032, USD Million
- Others- Market Insights and Forecast 2022-2032, USD Million
- By Sales Channel
- Retail Online- Market Insights and Forecast 2022-2032, USD Million
- Company-Owned Websites- Market Insights and Forecast 2022-2032, USD Million
- E-Commerce Platforms- Market Insights and Forecast 2022-2032, USD Million
- Online Laboratory Service Portals- Market Insights and Forecast 2022-2032, USD Million
- B2B Procurement Platforms- Market Insights and Forecast 2022-2032, USD Million
- Retail Offline- Market Insights and Forecast 2022-2032, USD Million
- Direct Sales- Market Insights and Forecast 2022-2032, USD Million
- Distributors/Dealers- Market Insights and Forecast 2022-2032, USD Million
- Specialty Instrument Stores- Market Insights and Forecast 2022-2032, USD Million
- Laboratory Equipment Suppliers- Market Insights and Forecast 2022-2032, USD Million
- Local Authorized Sales Partners- Market Insights and Forecast 2022-2032, USD Million
- Retail Online- Market Insights and Forecast 2022-2032, USD Million
- By Region
- North America
- South America
- Europe
- Middle East & Africa
- Asia Pacific
- By Competitors
- Competition Characteristics
- Market Share & Analysis
- By Product Type
- Market Size & Growth Outlook
- North America Global Water Quality Testing & Monitoring Market Statistics, 2022-2032F
- Market Size & Growth Outlook
- By Revenues in USD Million
- Market Segmentation & Growth Outlook
- By Product Type- Market Insights and Forecast 2022-2032, USD Million
- By Parameter Type- Market Insights and Forecast 2022-2032, USD Million
- By Technology- Market Insights and Forecast 2022-2032, USD Million
- By Water Source- Market Insights and Forecast 2022-2032, USD Million
- By End User- Market Insights and Forecast 2022-2032, USD Million
- By Sales Channel- Market Insights and Forecast 2022-2032, USD Million
- By Country
- US
- Canada
- Mexico
- Rest of North America
- US Global Water Quality Testing & Monitoring Market Statistics, 2022-2032F
- Market Size & Growth Outlook
- By Revenues in USD Million
- Market Segmentation & Growth Outlook
- By Product Type- Market Insights and Forecast 2022-2032, USD Million
- By Parameter Type- Market Insights and Forecast 2022-2032, USD Million
- By Technology- Market Insights and Forecast 2022-2032, USD Million
- By Water Source- Market Insights and Forecast 2022-2032, USD Million
- By End User- Market Insights and Forecast 2022-2032, USD Million
- By Sales Channel- Market Insights and Forecast 2022-2032, USD Million
- Market Size & Growth Outlook
- Canada Global Water Quality Testing & Monitoring Market Statistics, 2022-2032F
- Market Size & Growth Outlook
- By Revenues in USD Million
- Market Segmentation & Growth Outlook
- By Product Type- Market Insights and Forecast 2022-2032, USD Million
- By Parameter Type- Market Insights and Forecast 2022-2032, USD Million
- By Technology- Market Insights and Forecast 2022-2032, USD Million
- By Water Source- Market Insights and Forecast 2022-2032, USD Million
- By End User- Market Insights and Forecast 2022-2032, USD Million
- By Sales Channel- Market Insights and Forecast 2022-2032, USD Million
- Market Size & Growth Outlook
- Mexico Global Water Quality Testing & Monitoring Market Statistics, 2022-2032F
- Market Size & Growth Outlook
- By Revenues in USD Million
- Market Segmentation & Growth Outlook
- By Product Type- Market Insights and Forecast 2022-2032, USD Million
- By Parameter Type- Market Insights and Forecast 2022-2032, USD Million
- By Technology- Market Insights and Forecast 2022-2032, USD Million
- By Water Source- Market Insights and Forecast 2022-2032, USD Million
- By End User- Market Insights and Forecast 2022-2032, USD Million
- By Sales Channel- Market Insights and Forecast 2022-2032, USD Million
- Market Size & Growth Outlook
- Market Size & Growth Outlook
- South America Global Water Quality Testing & Monitoring Market Statistics, 2022-2032F
- Market Size & Growth Outlook
- By Revenues in USD Million
- Market Segmentation & Growth Outlook
- By Product Type- Market Insights and Forecast 2022-2032, USD Million
- By Parameter Type- Market Insights and Forecast 2022-2032, USD Million
- By Technology- Market Insights and Forecast 2022-2032, USD Million
- By Water Source- Market Insights and Forecast 2022-2032, USD Million
- By End User- Market Insights and Forecast 2022-2032, USD Million
- By Sales Channel- Market Insights and Forecast 2022-2032, USD Million
- By Country
- Brazil
- Argentina
- Colombia
- Chile
- Peru
- Rest of South America
- Brazil Global Water Quality Testing & Monitoring Market Statistics, 2022-2032F
- Market Size & Growth Outlook
- By Revenues in USD Million
- Market Segmentation & Growth Outlook
- By Product Type- Market Insights and Forecast 2022-2032, USD Million
- By Parameter Type- Market Insights and Forecast 2022-2032, USD Million
- By Technology- Market Insights and Forecast 2022-2032, USD Million
- By Water Source- Market Insights and Forecast 2022-2032, USD Million
- By End User- Market Insights and Forecast 2022-2032, USD Million
- By Sales Channel- Market Insights and Forecast 2022-2032, USD Million
- Market Size & Growth Outlook
- Argentina Global Water Quality Testing & Monitoring Market Statistics, 2022-2032F
- Market Size & Growth Outlook
- By Revenues in USD Million
- Market Segmentation & Growth Outlook
- By Product Type- Market Insights and Forecast 2022-2032, USD Million
- By Parameter Type- Market Insights and Forecast 2022-2032, USD Million
- By Technology- Market Insights and Forecast 2022-2032, USD Million
- By Water Source- Market Insights and Forecast 2022-2032, USD Million
- By End User- Market Insights and Forecast 2022-2032, USD Million
- By Sales Channel- Market Insights and Forecast 2022-2032, USD Million
- Market Size & Growth Outlook
- Colombia Global Water Quality Testing & Monitoring Market Statistics, 2022-2032F
- Market Size & Growth Outlook
- By Revenues in USD Million
- Market Segmentation & Growth Outlook
- By Product Type- Market Insights and Forecast 2022-2032, USD Million
- By Parameter Type- Market Insights and Forecast 2022-2032, USD Million
- By Technology- Market Insights and Forecast 2022-2032, USD Million
- By Water Source- Market Insights and Forecast 2022-2032, USD Million
- By End User- Market Insights and Forecast 2022-2032, USD Million
- By Sales Channel- Market Insights and Forecast 2022-2032, USD Million
- Market Size & Growth Outlook
- Chile Global Water Quality Testing & Monitoring Market Statistics, 2022-2032F
- Market Size & Growth Outlook
- By Revenues in USD Million
- Market Segmentation & Growth Outlook
- By Product Type- Market Insights and Forecast 2022-2032, USD Million
- By Parameter Type- Market Insights and Forecast 2022-2032, USD Million
- By Technology- Market Insights and Forecast 2022-2032, USD Million
- By Water Source- Market Insights and Forecast 2022-2032, USD Million
- By End User- Market Insights and Forecast 2022-2032, USD Million
- By Sales Channel- Market Insights and Forecast 2022-2032, USD Million
- Market Size & Growth Outlook
- Peru Global Water Quality Testing & Monitoring Market Statistics, 2022-2032F
- Market Size & Growth Outlook
- By Revenues in USD Million
- Market Segmentation & Growth Outlook
- By Product Type- Market Insights and Forecast 2022-2032, USD Million
- By Parameter Type- Market Insights and Forecast 2022-2032, USD Million
- By Technology- Market Insights and Forecast 2022-2032, USD Million
- By Water Source- Market Insights and Forecast 2022-2032, USD Million
- By End User- Market Insights and Forecast 2022-2032, USD Million
- By Sales Channel- Market Insights and Forecast 2022-2032, USD Million
- Market Size & Growth Outlook
- Market Size & Growth Outlook
- Europe Global Water Quality Testing & Monitoring Market Statistics, 2022-2032F
- Market Size & Growth Outlook
- By Revenues in USD Million
- Market Segmentation & Growth Outlook
- By Product Type- Market Insights and Forecast 2022-2032, USD Million
- By Parameter Type- Market Insights and Forecast 2022-2032, USD Million
- By Technology- Market Insights and Forecast 2022-2032, USD Million
- By Water Source- Market Insights and Forecast 2022-2032, USD Million
- By End User- Market Insights and Forecast 2022-2032, USD Million
- By Sales Channel- Market Insights and Forecast 2022-2032, USD Million
- By Country
- Germany
- UK
- France
- Italy
- Spain
- Netherlands
- Poland
- Russia
- Switzerland
- Sweden
- Turkey
- Rest of Europe
- Germany Global Water Quality Testing & Monitoring Market Statistics, 2022-2032F
- Market Size & Growth Outlook
- By Revenues in USD Million
- Market Segmentation & Growth Outlook
- By Product Type- Market Insights and Forecast 2022-2032, USD Million
- By Parameter Type- Market Insights and Forecast 2022-2032, USD Million
- By Technology- Market Insights and Forecast 2022-2032, USD Million
- By Water Source- Market Insights and Forecast 2022-2032, USD Million
- By End User- Market Insights and Forecast 2022-2032, USD Million
- By Sales Channel- Market Insights and Forecast 2022-2032, USD Million
- Market Size & Growth Outlook
- UK Global Water Quality Testing & Monitoring Market Statistics, 2022-2032F
- Market Size & Growth Outlook
- By Revenues in USD Million
- Market Segmentation & Growth Outlook
- By Product Type- Market Insights and Forecast 2022-2032, USD Million
- By Parameter Type- Market Insights and Forecast 2022-2032, USD Million
- By Technology- Market Insights and Forecast 2022-2032, USD Million
- By Water Source- Market Insights and Forecast 2022-2032, USD Million
- By End User- Market Insights and Forecast 2022-2032, USD Million
- By Sales Channel- Market Insights and Forecast 2022-2032, USD Million
- Market Size & Growth Outlook
- France Global Water Quality Testing & Monitoring Market Statistics, 2022-2032F
- Market Size & Growth Outlook
- By Revenues in USD Million
- Market Segmentation & Growth Outlook
- By Product Type- Market Insights and Forecast 2022-2032, USD Million
- By Parameter Type- Market Insights and Forecast 2022-2032, USD Million
- By Technology- Market Insights and Forecast 2022-2032, USD Million
- By Water Source- Market Insights and Forecast 2022-2032, USD Million
- By End User- Market Insights and Forecast 2022-2032, USD Million
- By Sales Channel- Market Insights and Forecast 2022-2032, USD Million
- Market Size & Growth Outlook
- Italy Global Water Quality Testing & Monitoring Market Statistics, 2022-2032F
- Market Size & Growth Outlook
- By Revenues in USD Million
- Market Segmentation & Growth Outlook
- By Product Type- Market Insights and Forecast 2022-2032, USD Million
- By Parameter Type- Market Insights and Forecast 2022-2032, USD Million
- By Technology- Market Insights and Forecast 2022-2032, USD Million
- By Water Source- Market Insights and Forecast 2022-2032, USD Million
- By End User- Market Insights and Forecast 2022-2032, USD Million
- By Sales Channel- Market Insights and Forecast 2022-2032, USD Million
- Market Size & Growth Outlook
- Spain Global Water Quality Testing & Monitoring Market Statistics, 2022-2032F
- Market Size & Growth Outlook
- By Revenues in USD Million
- Market Segmentation & Growth Outlook
- By Product Type- Market Insights and Forecast 2022-2032, USD Million
- By Parameter Type- Market Insights and Forecast 2022-2032, USD Million
- By Technology- Market Insights and Forecast 2022-2032, USD Million
- By Water Source- Market Insights and Forecast 2022-2032, USD Million
- By End User- Market Insights and Forecast 2022-2032, USD Million
- By Sales Channel- Market Insights and Forecast 2022-2032, USD Million
- Market Size & Growth Outlook
- Netherlands Global Water Quality Testing & Monitoring Market Statistics, 2022-2032F
- Market Size & Growth Outlook
- By Revenues in USD Million
- Market Segmentation & Growth Outlook
- By Product Type- Market Insights and Forecast 2022-2032, USD Million
- By Parameter Type- Market Insights and Forecast 2022-2032, USD Million
- By Technology- Market Insights and Forecast 2022-2032, USD Million
- By Water Source- Market Insights and Forecast 2022-2032, USD Million
- By End User- Market Insights and Forecast 2022-2032, USD Million
- By Sales Channel- Market Insights and Forecast 2022-2032, USD Million
- Market Size & Growth Outlook
- Poland Global Water Quality Testing & Monitoring Market Statistics, 2022-2032F
- Market Size & Growth Outlook
- By Revenues in USD Million
- Market Segmentation & Growth Outlook
- By Product Type- Market Insights and Forecast 2022-2032, USD Million
- By Parameter Type- Market Insights and Forecast 2022-2032, USD Million
- By Technology- Market Insights and Forecast 2022-2032, USD Million
- By Water Source- Market Insights and Forecast 2022-2032, USD Million
- By End User- Market Insights and Forecast 2022-2032, USD Million
- By Sales Channel- Market Insights and Forecast 2022-2032, USD Million
- Market Size & Growth Outlook
- Russia Global Water Quality Testing & Monitoring Market Statistics, 2022-2032F
- Market Size & Growth Outlook
- By Revenues in USD Million
- Market Segmentation & Growth Outlook
- By Product Type- Market Insights and Forecast 2022-2032, USD Million
- By Parameter Type- Market Insights and Forecast 2022-2032, USD Million
- By Technology- Market Insights and Forecast 2022-2032, USD Million
- By Water Source- Market Insights and Forecast 2022-2032, USD Million
- By End User- Market Insights and Forecast 2022-2032, USD Million
- By Sales Channel- Market Insights and Forecast 2022-2032, USD Million
- Market Size & Growth Outlook
- Switzerland Global Water Quality Testing & Monitoring Market Statistics, 2022-2032F
- Market Size & Growth Outlook
- By Revenues in USD Million
- Market Segmentation & Growth Outlook
- By Product Type- Market Insights and Forecast 2022-2032, USD Million
- By Parameter Type- Market Insights and Forecast 2022-2032, USD Million
- By Technology- Market Insights and Forecast 2022-2032, USD Million
- By Water Source- Market Insights and Forecast 2022-2032, USD Million
- By End User- Market Insights and Forecast 2022-2032, USD Million
- By Sales Channel- Market Insights and Forecast 2022-2032, USD Million
- Market Size & Growth Outlook
- Sweden Global Water Quality Testing & Monitoring Market Statistics, 2022-2032F
- Market Size & Growth Outlook
- By Revenues in USD Million
- Market Segmentation & Growth Outlook
- By Product Type- Market Insights and Forecast 2022-2032, USD Million
- By Parameter Type- Market Insights and Forecast 2022-2032, USD Million
- By Technology- Market Insights and Forecast 2022-2032, USD Million
- By Water Source- Market Insights and Forecast 2022-2032, USD Million
- By End User- Market Insights and Forecast 2022-2032, USD Million
- By Sales Channel- Market Insights and Forecast 2022-2032, USD Million
- Market Size & Growth Outlook
- Turkey Global Water Quality Testing & Monitoring Market Statistics, 2022-2032F
- Market Size & Growth Outlook
- By Revenues in USD Million
- Market Segmentation & Growth Outlook
- By Product Type- Market Insights and Forecast 2022-2032, USD Million
- By Parameter Type- Market Insights and Forecast 2022-2032, USD Million
- By Technology- Market Insights and Forecast 2022-2032, USD Million
- By Water Source- Market Insights and Forecast 2022-2032, USD Million
- By End User- Market Insights and Forecast 2022-2032, USD Million
- By Sales Channel- Market Insights and Forecast 2022-2032, USD Million
- Market Size & Growth Outlook
- Market Size & Growth Outlook
- Middle East & Africa Global Water Quality Testing & Monitoring Market Statistics, 2022-2032F
- Market Size & Growth Outlook
- By Revenues in USD Million
- Market Segmentation & Growth Outlook
- By Product Type- Market Insights and Forecast 2022-2032, USD Million
- By Parameter Type- Market Insights and Forecast 2022-2032, USD Million
- By Technology- Market Insights and Forecast 2022-2032, USD Million
- By Water Source- Market Insights and Forecast 2022-2032, USD Million
- By End User- Market Insights and Forecast 2022-2032, USD Million
- By Sales Channel- Market Insights and Forecast 2022-2032, USD Million
- By Country
- Saudi Arabia
- UAE
- South Africa
- Egypt
- Israel
- Qatar
- Kuwait
- Kenya
- Rest of Middle East & Africa
- Saudi Arabia Global Water Quality Testing & Monitoring Market Statistics, 2022-2032F
- Market Size & Growth Outlook
- By Revenues in USD Million
- Market Segmentation & Growth Outlook
- By Product Type- Market Insights and Forecast 2022-2032, USD Million
- By Parameter Type- Market Insights and Forecast 2022-2032, USD Million
- By Technology- Market Insights and Forecast 2022-2032, USD Million
- By Water Source- Market Insights and Forecast 2022-2032, USD Million
- By End User- Market Insights and Forecast 2022-2032, USD Million
- By Sales Channel- Market Insights and Forecast 2022-2032, USD Million
- Market Size & Growth Outlook
- UAE Global Water Quality Testing & Monitoring Market Statistics, 2022-2032F
- Market Size & Growth Outlook
- By Revenues in USD Million
- Market Segmentation & Growth Outlook
- By Product Type- Market Insights and Forecast 2022-2032, USD Million
- By Parameter Type- Market Insights and Forecast 2022-2032, USD Million
- By Technology- Market Insights and Forecast 2022-2032, USD Million
- By Water Source- Market Insights and Forecast 2022-2032, USD Million
- By End User- Market Insights and Forecast 2022-2032, USD Million
- By Sales Channel- Market Insights and Forecast 2022-2032, USD Million
- Market Size & Growth Outlook
- South Africa Global Water Quality Testing & Monitoring Market Statistics, 2022-2032F
- Market Size & Growth Outlook
- By Revenues in USD Million
- Market Segmentation & Growth Outlook
- By Product Type- Market Insights and Forecast 2022-2032, USD Million
- By Parameter Type- Market Insights and Forecast 2022-2032, USD Million
- By Technology- Market Insights and Forecast 2022-2032, USD Million
- By Water Source- Market Insights and Forecast 2022-2032, USD Million
- By End User- Market Insights and Forecast 2022-2032, USD Million
- By Sales Channel- Market Insights and Forecast 2022-2032, USD Million
- Market Size & Growth Outlook
- Egypt Global Water Quality Testing & Monitoring Market Statistics, 2022-2032F
- Market Size & Growth Outlook
- By Revenues in USD Million
- Market Segmentation & Growth Outlook
- By Product Type- Market Insights and Forecast 2022-2032, USD Million
- By Parameter Type- Market Insights and Forecast 2022-2032, USD Million
- By Technology- Market Insights and Forecast 2022-2032, USD Million
- By Water Source- Market Insights and Forecast 2022-2032, USD Million
- By End User- Market Insights and Forecast 2022-2032, USD Million
- By Sales Channel- Market Insights and Forecast 2022-2032, USD Million
- Market Size & Growth Outlook
- Israel Global Water Quality Testing & Monitoring Market Statistics, 2022-2032F
- Market Size & Growth Outlook
- By Revenues in USD Million
- Market Segmentation & Growth Outlook
- By Product Type- Market Insights and Forecast 2022-2032, USD Million
- By Parameter Type- Market Insights and Forecast 2022-2032, USD Million
- By Technology- Market Insights and Forecast 2022-2032, USD Million
- By Water Source- Market Insights and Forecast 2022-2032, USD Million
- By End User- Market Insights and Forecast 2022-2032, USD Million
- By Sales Channel- Market Insights and Forecast 2022-2032, USD Million
- Market Size & Growth Outlook
- Qatar Global Water Quality Testing & Monitoring Market Statistics, 2022-2032F
- Market Size & Growth Outlook
- By Revenues in USD Million
- Market Segmentation & Growth Outlook
- By Product Type- Market Insights and Forecast 2022-2032, USD Million
- By Parameter Type- Market Insights and Forecast 2022-2032, USD Million
- By Technology- Market Insights and Forecast 2022-2032, USD Million
- By Water Source- Market Insights and Forecast 2022-2032, USD Million
- By End User- Market Insights and Forecast 2022-2032, USD Million
- By Sales Channel- Market Insights and Forecast 2022-2032, USD Million
- Market Size & Growth Outlook
- Kuwait Global Water Quality Testing & Monitoring Market Statistics, 2022-2032F
- Market Size & Growth Outlook
- By Revenues in USD Million
- Market Segmentation & Growth Outlook
- By Product Type- Market Insights and Forecast 2022-2032, USD Million
- By Parameter Type- Market Insights and Forecast 2022-2032, USD Million
- By Technology- Market Insights and Forecast 2022-2032, USD Million
- By Water Source- Market Insights and Forecast 2022-2032, USD Million
- By End User- Market Insights and Forecast 2022-2032, USD Million
- By Sales Channel- Market Insights and Forecast 2022-2032, USD Million
- Market Size & Growth Outlook
- Kenya Global Water Quality Testing & Monitoring Market Statistics, 2022-2032F
- Market Size & Growth Outlook
- By Revenues in USD Million
- Market Segmentation & Growth Outlook
- By Product Type- Market Insights and Forecast 2022-2032, USD Million
- By Parameter Type- Market Insights and Forecast 2022-2032, USD Million
- By Technology- Market Insights and Forecast 2022-2032, USD Million
- By Water Source- Market Insights and Forecast 2022-2032, USD Million
- By End User- Market Insights and Forecast 2022-2032, USD Million
- By Sales Channel- Market Insights and Forecast 2022-2032, USD Million
- Market Size & Growth Outlook
- Market Size & Growth Outlook
- Asia Pacific Global Water Quality Testing & Monitoring Market Statistics, 2022-2032F
- Market Size & Growth Outlook
- By Revenues in USD Million
- Market Segmentation & Growth Outlook
- By Product Type- Market Insights and Forecast 2022-2032, USD Million
- By Parameter Type- Market Insights and Forecast 2022-2032, USD Million
- By Technology- Market Insights and Forecast 2022-2032, USD Million
- By Water Source- Market Insights and Forecast 2022-2032, USD Million
- By End User- Market Insights and Forecast 2022-2032, USD Million
- By Sales Channel- Market Insights and Forecast 2022-2032, USD Million
- By Country
- China
- India
- Japan
- South Korea
- Australia & New Zealand
- Thailand
- Singapore
- Indonesia
- Malaysia
- Vietnam
- Philippines
- Taiwan
- Rest of Asia-Pacific
- China Global Water Quality Testing & Monitoring Market Statistics, 2022-2032F
- Market Size & Growth Outlook
- By Revenues in USD Million
- Market Segmentation & Growth Outlook
- By Product Type- Market Insights and Forecast 2022-2032, USD Million
- By Parameter Type- Market Insights and Forecast 2022-2032, USD Million
- By Technology- Market Insights and Forecast 2022-2032, USD Million
- By Water Source- Market Insights and Forecast 2022-2032, USD Million
- By End User- Market Insights and Forecast 2022-2032, USD Million
- By Sales Channel- Market Insights and Forecast 2022-2032, USD Million
- Market Size & Growth Outlook
- India Global Water Quality Testing & Monitoring Market Statistics, 2022-2032F
- Market Size & Growth Outlook
- By Revenues in USD Million
- Market Segmentation & Growth Outlook
- By Product Type- Market Insights and Forecast 2022-2032, USD Million
- By Parameter Type- Market Insights and Forecast 2022-2032, USD Million
- By Technology- Market Insights and Forecast 2022-2032, USD Million
- By Water Source- Market Insights and Forecast 2022-2032, USD Million
- By End User- Market Insights and Forecast 2022-2032, USD Million
- By Sales Channel- Market Insights and Forecast 2022-2032, USD Million
- Market Size & Growth Outlook
- Japan Global Water Quality Testing & Monitoring Market Statistics, 2022-2032F
- Market Size & Growth Outlook
- By Revenues in USD Million
- Market Segmentation & Growth Outlook
- By Product Type- Market Insights and Forecast 2022-2032, USD Million
- By Parameter Type- Market Insights and Forecast 2022-2032, USD Million
- By Technology- Market Insights and Forecast 2022-2032, USD Million
- By Water Source- Market Insights and Forecast 2022-2032, USD Million
- By End User- Market Insights and Forecast 2022-2032, USD Million
- By Sales Channel- Market Insights and Forecast 2022-2032, USD Million
- Market Size & Growth Outlook
- South Korea Global Water Quality Testing & Monitoring Market Statistics, 2022-2032F
- Market Size & Growth Outlook
- By Revenues in USD Million
- Market Segmentation & Growth Outlook
- By Product Type- Market Insights and Forecast 2022-2032, USD Million
- By Parameter Type- Market Insights and Forecast 2022-2032, USD Million
- By Technology- Market Insights and Forecast 2022-2032, USD Million
- By Water Source- Market Insights and Forecast 2022-2032, USD Million
- By End User- Market Insights and Forecast 2022-2032, USD Million
- By Sales Channel- Market Insights and Forecast 2022-2032, USD Million
- Market Size & Growth Outlook
- Australia & New Zealand Global Water Quality Testing & Monitoring Market Statistics, 2022-2032F
- Market Size & Growth Outlook
- By Revenues in USD Million
- Market Segmentation & Growth Outlook
- By Product Type- Market Insights and Forecast 2022-2032, USD Million
- By Parameter Type- Market Insights and Forecast 2022-2032, USD Million
- By Technology- Market Insights and Forecast 2022-2032, USD Million
- By Water Source- Market Insights and Forecast 2022-2032, USD Million
- By End User- Market Insights and Forecast 2022-2032, USD Million
- By Sales Channel- Market Insights and Forecast 2022-2032, USD Million
- Market Size & Growth Outlook
- Thailand Global Water Quality Testing & Monitoring Market Statistics, 2022-2032F
- Market Size & Growth Outlook
- By Revenues in USD Million
- Market Segmentation & Growth Outlook
- By Product Type- Market Insights and Forecast 2022-2032, USD Million
- By Parameter Type- Market Insights and Forecast 2022-2032, USD Million
- By Technology- Market Insights and Forecast 2022-2032, USD Million
- By Water Source- Market Insights and Forecast 2022-2032, USD Million
- By End User- Market Insights and Forecast 2022-2032, USD Million
- By Sales Channel- Market Insights and Forecast 2022-2032, USD Million
- Market Size & Growth Outlook
- Singapore Global Water Quality Testing & Monitoring Market Statistics, 2022-2032F
- Market Size & Growth Outlook
- By Revenues in USD Million
- Market Segmentation & Growth Outlook
- By Product Type- Market Insights and Forecast 2022-2032, USD Million
- By Parameter Type- Market Insights and Forecast 2022-2032, USD Million
- By Technology- Market Insights and Forecast 2022-2032, USD Million
- By Water Source- Market Insights and Forecast 2022-2032, USD Million
- By End User- Market Insights and Forecast 2022-2032, USD Million
- By Sales Channel- Market Insights and Forecast 2022-2032, USD Million
- Market Size & Growth Outlook
- Indonesia Global Water Quality Testing & Monitoring Market Statistics, 2022-2032F
- Market Size & Growth Outlook
- By Revenues in USD Million
- Market Segmentation & Growth Outlook
- By Product Type- Market Insights and Forecast 2022-2032, USD Million
- By Parameter Type- Market Insights and Forecast 2022-2032, USD Million
- By Technology- Market Insights and Forecast 2022-2032, USD Million
- By Water Source- Market Insights and Forecast 2022-2032, USD Million
- By End User- Market Insights and Forecast 2022-2032, USD Million
- By Sales Channel- Market Insights and Forecast 2022-2032, USD Million
- Market Size & Growth Outlook
- Malaysia Global Water Quality Testing & Monitoring Market Statistics, 2022-2032F
- Market Size & Growth Outlook
- By Revenues in USD Million
- Market Segmentation & Growth Outlook
- By Product Type- Market Insights and Forecast 2022-2032, USD Million
- By Parameter Type- Market Insights and Forecast 2022-2032, USD Million
- By Technology- Market Insights and Forecast 2022-2032, USD Million
- By Water Source- Market Insights and Forecast 2022-2032, USD Million
- By End User- Market Insights and Forecast 2022-2032, USD Million
- By Sales Channel- Market Insights and Forecast 2022-2032, USD Million
- Market Size & Growth Outlook
- Vietnam Global Water Quality Testing & Monitoring Market Statistics, 2022-2032F
- Market Size & Growth Outlook
- By Revenues in USD Million
- Market Segmentation & Growth Outlook
- By Product Type- Market Insights and Forecast 2022-2032, USD Million
- By Parameter Type- Market Insights and Forecast 2022-2032, USD Million
- By Technology- Market Insights and Forecast 2022-2032, USD Million
- By Water Source- Market Insights and Forecast 2022-2032, USD Million
- By End User- Market Insights and Forecast 2022-2032, USD Million
- By Sales Channel- Market Insights and Forecast 2022-2032, USD Million
- Market Size & Growth Outlook
- Philippines Global Water Quality Testing & Monitoring Market Statistics, 2022-2032F
- Market Size & Growth Outlook
- By Revenues in USD Million
- Market Segmentation & Growth Outlook
- By Product Type- Market Insights and Forecast 2022-2032, USD Million
- By Parameter Type- Market Insights and Forecast 2022-2032, USD Million
- By Technology- Market Insights and Forecast 2022-2032, USD Million
- By Water Source- Market Insights and Forecast 2022-2032, USD Million
- By End User- Market Insights and Forecast 2022-2032, USD Million
- By Sales Channel- Market Insights and Forecast 2022-2032, USD Million
- Market Size & Growth Outlook
- Taiwan Global Water Quality Testing & Monitoring Market Statistics, 2022-2032F
- Market Size & Growth Outlook
- By Revenues in USD Million
- Market Segmentation & Growth Outlook
- By Product Type- Market Insights and Forecast 2022-2032, USD Million
- By Parameter Type- Market Insights and Forecast 2022-2032, USD Million
- By Technology- Market Insights and Forecast 2022-2032, USD Million
- By Water Source- Market Insights and Forecast 2022-2032, USD Million
- By End User- Market Insights and Forecast 2022-2032, USD Million
- By Sales Channel- Market Insights and Forecast 2022-2032, USD Million
- Market Size & Growth Outlook
- Market Size & Growth Outlook
- Competitive Outlook
- Company Profiles
- Hach
- Business Description
- Product Portfolio
- Collaborations & Alliances
- Recent Developments
- Financial Details
- Others
- Xylem Analytics/YSI
- Business Description
- Product Portfolio
- Collaborations & Alliances
- Recent Developments
- Financial Details
- Others
- Thermo Fisher Scientific
- Business Description
- Product Portfolio
- Collaborations & Alliances
- Recent Developments
- Financial Details
- Others
- HORIBA
- Business Description
- Product Portfolio
- Collaborations & Alliances
- Recent Developments
- Financial Details
- Others
- Endress+Hauser
- Business Description
- Product Portfolio
- Collaborations & Alliances
- Recent Developments
- Financial Details
- Others
- ABB
- Business Description
- Product Portfolio
- Collaborations & Alliances
- Recent Developments
- Financial Details
- Others
- Emerson
- Business Description
- Product Portfolio
- Collaborations & Alliances
- Recent Developments
- Financial Details
- Others
- Yokogawa Electric
- Business Description
- Product Portfolio
- Collaborations & Alliances
- Recent Developments
- Financial Details
- Others
- Teledyne ISCO
- Business Description
- Product Portfolio
- Collaborations & Alliances
- Recent Developments
- Financial Details
- Others
- Agilent Technologies
- Business Description
- Product Portfolio
- Collaborations & Alliances
- Recent Developments
- Financial Details
- Others
- Shimadzu
- Business Description
- Product Portfolio
- Collaborations & Alliances
- Recent Developments
- Financial Details
- Others
- Metrohm
- Business Description
- Product Portfolio
- Collaborations & Alliances
- Recent Developments
- Financial Details
- Others
- METTLER TOLEDO Thornton
- Business Description
- Product Portfolio
- Collaborations & Alliances
- Recent Developments
- Financial Details
- Others
- Hanna Instruments
- Business Description
- Product Portfolio
- Collaborations & Alliances
- Recent Developments
- Financial Details
- Others
- Lovibond/Tintometer
- Business Description
- Product Portfolio
- Collaborations & Alliances
- Recent Developments
- Financial Details
- Others
- Hach
- Company Profiles
- Disclaimer
| Segment | Sub-Segment |
|---|---|
| By Product Type |
|
| By Parameter Type |
|
| By Technology |
|
| By Water Source |
|
| By End User |
|
| By Sales Channel |
|
| By Region |
|
Research Methodology
This study followed a structured approach comprising four key phases to assess the size and scope of the electro-oxidation market. The process began with thorough secondary research to collect data on the target market, related markets, and broader industry context. These findings, along with preliminary assumptions and estimates, were then validated through extensive primary research involving industry experts from across the value chain. To calculate the overall market size, both top-down and bottom-up methodologies were employed. Finally, market segmentation and data triangulation techniques were applied to refine and validate segment-level estimations.
Secondary Research
The secondary research phase involved gathering data from a wide range of credible and published sources. This step helped in identifying industry trends, defining market segmentation, and understanding the market landscape and value chain.
Sources consulted during this phase included:
- Company annual reports, investor presentations, and press releases
- Industry white papers and certified publications
- Trade directories and market-recognized databases
- Articles from authoritative authors and reputable journals
- Gold and silver standard websites
Secondary research was critical in mapping out the industry's value chain and monetary flow, identifying key market segments, understanding regional variations, and tracking significant industry developments.
Other key sources:
- Financial disclosures
- Industry associations and trade bodies
- News outlets and business magazines
- Academic journals and research studies
- Paid industry databases
Primary Research
To validate secondary data and gain deeper market insights, primary research was conducted with key stakeholders across both the supply and demand sides of the market.
On the demand side, participants included decision-makers and influencers from end-user industries—such as CIOs, CTOs, and CSOs—who provided first-hand perspectives on market needs, product usage, and future expectations.
On the supply side, interviews were conducted with manufacturers, industry associations, and institutional participants to gather insights into current offerings, product pipelines, and market challenges.
Primary interviews provided critical inputs such as:
- Market size and revenue data
- Product and service breakdowns
- Market forecasts
- Regional and application-specific trends
Stakeholders consulted included:
- Leading OEM and solution providers
- Channel and distribution partners
- End users across various applications
- Independent consultants and industry specialists
Market Size Estimation and Data Triangulation
- Identifying Key Market Participants (Secondary Research)
- Goal: To identify the major players or companies in the target market. This typically involves using publicly available data sources such as industry reports, market research publications, and financial statements of companies.
- Tools: Reports from firms like Gartner, Forrester, Euromonitor, Statista, IBISWorld, and others. Public financial statements, news articles, and press releases from top market players.
- Extracting Earnings of Key Market Participants
- Goal: To estimate the earnings generated from the product or service being analyzed. This step helps in understanding the revenue potential of each market player in a specific geography.
- Methods: Earnings data can be gathered from:
- Publicly available financial reports (for listed companies).
- Interviews and primary data sources from professionals, such as Directors, VPs, SVPs, etc. This is especially useful for understanding more nuanced, internal data that isn't publicly disclosed.
- Annual reports and investor presentations of key players.
- Data Collation and Development of a Relevant Data Model
- Goal: To collate inputs from both primary and secondary sources into a structured, data-driven model for market estimation. This model will incorporate key market KPIs and any independent variables relevant to the market.
- Key KPIs: These could include:
- Market size, growth rate, and demand drivers.
- Industry-specific metrics like market share, average revenue per customer (ARPC), or average deal size.
- External variables, such as economic growth rates, inflation rates, or commodity prices, that could affect the market.
- Data Modeling: Based on this data, the market forecasts are developed for the next 5 years. A combination of trend analysis, scenario modeling, and statistical regression might be used to generate projections.
- Scenario Analysis
- Goal: To test different assumptions and validate how sensitive the market is to changes in key variables (e.g., market demand, regulatory changes, technological disruptions).
- Types of Scenarios:
- Base Case: Based on current assumptions and historical data.
- Best-Case Scenario: Assuming favorable market conditions, regulatory environments, and technological advancements.
- Worst-Case Scenario: Accounting for adverse factors, such as economic downturns, stricter regulations, or unexpected disruptions.


