US Water Quality Testing & Monitoring Market Report: Trends, Growth and Forecast (2026-2032)
By Product Type (Water Quality Testing Instruments, Water Quality Sensors & Probes, Test Kits & Reagents, Online Water Quality Monitoring Systems, Portable Water Testing Devices, Software & Data Management Platforms, Others), By Parameter Type (Physical Parameters, Chemical Parameters, Biological/Microbiological Parameters, Radiological Parameters, Others), By Technology (Laboratory-Based Testing, Portable/Field Testing, Online/Real-Time Monitoring, IoT-Based Monitoring, Manual Testing, Others), By Water Source (Drinking Water, Wastewater & Effluent, Surface Water, Groundwater, Industrial Process Water, Recreational Water, Others), By End User (Municipal Water Utilities, Industrial Facilities, Environmental Agencies, Commercial Testing Laboratories, Research & Academic Institutes, Residential & Commercial Users, Others), By Sales Channel (Retail Online (Company-Owned Websites, E-Commerce Platforms, Online Laboratory Service Portals, B2B Procurement Platforms), Retail Offline (Direct Sales, Distributors/Dealers, Specialty Instrument Stores, Laboratory Equipment Suppliers, Local Authorized Sales Partners)), By Region (West, Midwest, South, North, Northeast) ... Read more
|
Major Players
|
US Water Quality Testing & Monitoring Market Statistics and Insights, 2026
- Market Size Statistics
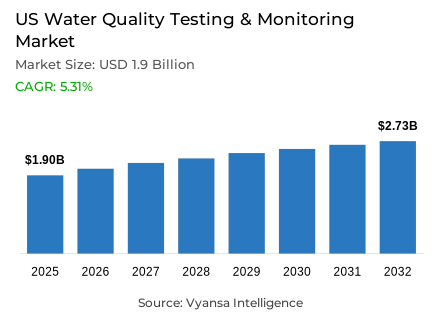
- Water quality testing & monitoring market size in US was valued at USD 1.9 billion in 2025 and is estimated at USD 2 billion in 2026.
- The market size is expected to grow to USD 2.73 billion by 2032.
- Market to register a CAGR of around 5.31% during 2026-32.
- Product Type Shares
- Online water quality monitoring systems grabbed market share of 20%.
- Competition
- More than 10 companies are actively engaged in producing water quality testing & monitoring in US.
- Top 5 companies acquired around 15% of the market share.
- IDEXX, In-Situ, LaMotte, Hach, Xylem / YSI etc., are few of the top companies.
- Parameter Type
- Chemical parameters grabbed 40% of the market.
US Water Quality Testing & Monitoring Market Outlook
Valued at USD 1.9 billion in 2025, the US water quality testing and monitoring market is advancing from USD 2 billion in 2026 toward USD 2.73 billion by 2032, representing 5.31% compound annual growth rate throughout the forecast window. This steady growth trajectory reflects continued need for accurate testing systems and reliable monitoring solutions across diverse water management and treatment activities throughout the country. Market momentum remains underpinned by stricter contaminant regulation mandating mandatory recurring testing, substantial public funding supporting infrastructure and compliance upgrades, and industry-wide shift toward real-time online visibility replacing periodic manual monitoring approaches.
Stricter contaminant regulation and mandatory monitoring requirements establish foundational market driver sustaining consistent demand for water quality testing and monitoring solutions. Evidence from US Environmental Protection Agency (EPA) reveals public water systems must complete initial monitoring for regulated PFAS by 2027, continue ongoing compliance monitoring thereafter, and begin informing public about PFAS levels in 2027. This regulatory mandate directly translates into heightened market relevance for water quality testing solutions emphasizing accurate contaminant measurement and rapid result validation. Published data from US EPA indicates PFAS rule implementation is expected to reduce PFAS exposure for approximately 100 million Americans served by public drinking water systems, establishing substantial scale supporting sustained investment in testing and monitoring infrastructure.
Real-time monitoring infrastructure expansion and continuous data visibility shift reshape US water quality testing and monitoring market toward online systems replacing periodic manual approaches. Data from US Geological Survey indicates water data for the nation platform includes over 13,500 real-time stream, lake, reservoir, precipitation, water quality, and groundwater monitoring locations, establishing comprehensive digital monitoring infrastructure. Published evidence from US Geological Survey reveals water data for the nation provides over 135 years of water data from more than one million monitoring locations, supporting wider use of connected dashboards, online sensors, and continuous comparison of current conditions with historical baselines. This data foundation enables service providers developing advanced online monitoring platforms to capture market share through continuous visibility and predictive analytics capabilities.
Market segmentation demonstrates pronounced demand concentration within online monitoring infrastructure and chemical parameter analysis. Online Water Quality Monitoring Systems commands 20% market share through alignment with continuous observation supporting faster response and organized tracking of changing water conditions, while Chemical Parameters account for 40% of demand reflecting central importance of contaminant measurement in regulatory compliance. This US water quality testing and monitoring market structure indicates utilities and municipalities increasingly prioritize real-time monitoring solutions and comprehensive chemical analysis supporting compliance tracking and treatment optimization.

US Water Quality Testing & Monitoring Market Growth Driver
PFAS Compliance Keeps Demand Rising
Stricter contaminant regulation and mandatory testing requirements establish sustained demand for water quality testing and monitoring solutions throughout US water utility operations. Statistics from US EPA confirm public water systems must complete initial monitoring for regulated PFAS by 2027, continue ongoing compliance monitoring thereafter, and begin informing public about PFAS levels in 2027. This regulatory mandate directly translates into heightened market relevance for water quality testing solutions emphasizing accurate measurement and rapid result validation. Regulatory structure ensures utilities remain dependent on frequent professional water quality testing and monitoring services supporting consistent compliance with mandated testing cycles.
Large population exposure scope and public health significance strengthen commercial foundation for comprehensive water quality testing and monitoring systems. Published data from US EPA indicates PFAS rule implementation is expected to reduce PFAS exposure for approximately 100 million Americans served by public drinking water systems, establishing substantial scale supporting sustained investment in testing infrastructure. This large-scale public health protection requirement creates durable commercial foundation for service providers developing PFAS detection capabilities and compliance monitoring solutions. Population-level health protection imperatives ensure sustained regulatory commitment supporting persistent demand for water quality testing and monitoring services.
US Water Quality Testing & Monitoring Market Challenge
Aging Systems Keep Execution Burdens High
Water quality testing and monitoring market faces substantial challenge from heavy infrastructure burden affecting utility budgets and monitoring upgrade prioritization. Official records from US EPA indicate drinking water systems will need USD 625 billion over next 20 years for pipe replacement, treatment plant upgrades, storage tanks, and other key assets, establishing enormous capital requirement competing with monitoring program investment. This infrastructure burden creates pressure on utility budgets delaying spending on broader monitoring upgrades when core repair and replacement needs remain urgent. Service providers must develop cost-effective solutions addressing budget constraints facing resource-limited utilities.
Lead service line contamination risks and legacy infrastructure verification requirements create additional operational complexity affecting monitoring program scaling. Evidence from US EPA reveals estimated 4 million lead service lines still serve properties in communities across United States, establishing large replacement and verification workload. This contamination legacy creates substantial monitoring demands competing for utility resources alongside infrastructure correction and regulatory reporting obligations. Service providers must develop adaptive monitoring protocols addressing varied infrastructure conditions and contamination risks throughout heterogeneous US water system landscape.
Unlock Market Intelligence
Explore the market potential with our data-driven report
US Water Quality Testing & Monitoring Market Trend
Real-Time Monitoring Moves to the Center
US water quality testing and monitoring industry demonstrates pronounced shift toward real-time and online water-quality visibility replacing periodic manual testing approaches. Market data from US Geological Survey indicates water data for the nation platform includes over 13,500 real-time stream, lake, reservoir, precipitation, water quality, and groundwater monitoring locations, establishing comprehensive real-time monitoring infrastructure. This data infrastructure shows water management is moving toward faster condition tracking and continuous information flows instead of relying exclusively on periodic manual testing. Real-time monitoring adoption supports market expansion for online sensors and connected dashboard technologies.
Long-running historical data foundation and continuous monitoring capability emphasis strengthen industry-wide technology adoption momentum. Published data from US Geological Survey reveals water data for the nation provides over 135 years of water data from more than one million monitoring locations, supporting wider use of connected dashboards, online sensors, and continuous comparison of current conditions with historical baselines. This extensive data foundation enables service providers developing sophisticated water quality analytics platforms and predictive monitoring capabilities to establish competitive advantages. Data-driven monitoring approaches support more efficient water management and proactive contamination response throughout US water system operations.
US Water Quality Testing & Monitoring Market Opportunity
Federal Support Opens a Larger Runway
Strong opportunities emerge from substantial public funding supporting water-system upgrades and compliance monitoring capabilities. Official records from US EPA indicate FY2025 allotments provided USD 8.9 billion to states, Tribes, and territories through Clean Water and Drinking Water State Revolving Funds, establishing significant capital availability for monitoring system improvements. This public funding expansion creates meaningful room for utilities and municipalities to invest in better monitoring systems, testing programs, and data-management capabilities alongside broader infrastructure improvement plans. Funding availability directly supports demand for water quality testing equipment and online monitoring system installation.
Targeted support for small water system compliance strengthens commercial opportunity for accessible monitoring solutions and technical support services. Evidence from US EPA reveals in April 2026 it announced up to USD 30.7 million under RealWaterTA Initiative, including approximately USD 26 million for small public water systems achieving and maintaining Safe Drinking Water Act compliance. This dedicated small-system support creates added commercial space for testing providers, sensor companies, and technical-support firms serving under-resourced utilities. Service providers developing affordable monitoring solutions and turnkey compliance packages position themselves advantageously to capture small-utility market segment.
Unlock Market Intelligence
Explore the market potential with our data-driven report
US Water Quality Testing & Monitoring Market Segmentation Analysis
By Product Type
- Water Quality Testing Instruments
- Water Quality Sensors & Probes
- Test Kits & Reagents
- Online Water Quality Monitoring Systems
- Portable Water Testing Devices
- Software & Data Management Platforms
- Others
Online water quality monitoring systems commands market leadership at 20% share within US water quality testing and monitoring market, establishing dominant product-type positioning through essential role in continuous observation and operational visibility. This market segment maintains leading position due to utility prioritization of systems supporting continuous observation, quicker response, and more organized tracking of changing water conditions across utility and industrial environments. Online monitoring solutions deliver accessible positioning supporting routine water quality tracking while enabling rapid response to changing conditions, establishing broad appeal across municipal, industrial, and environmental applications.
This market leadership position reflects utilities' continued selection of continuous monitoring systems reducing gaps between testing cycles and response actions. Online water quality monitoring systems remain important because they help move monitoring from periodic checks to consistent oversight supporting faster condition tracking. The 20% market share indicates this segment continues shaping product demand, technology adoption, and investment focus across broader US water quality testing and monitoring industry landscape. Service providers maintaining online monitoring system excellence develop competitive advantages enabling customer retention and profitable recurring revenue models supporting category expansion.

By Parameter Type
- Physical Parameters
- Chemical Parameters
- Biological/Microbiological Parameters
- Radiological Parameters
- Others
Chemical parameters commands market leadership at 40% share within US water quality testing and monitoring market, establishing dominant parameter-type positioning through central importance in regulatory compliance and treatment decision-making. This market segment maintains leading position due to utility prioritization of measuring contaminants and chemical conditions directly affecting regulatory compliance, treatment decisions, and overall water safety across diverse end-use settings. Chemical parameter solutions deliver accessible positioning supporting routine compliance work while enabling operational decision-making across varied water environments, establishing broad appeal across municipal, industrial, and environmental applications.
This market leadership position reflects utilities' continued selection of chemical parameter testing supporting contaminant identification and compliance tracking. Chemical Parameters remain important because they support routine compliance work and guide operational decisions more directly than many other parameter groups. The 40% market share indicates this segment continues shaping testing priorities, monitoring design, and broader commercial direction throughout US water quality testing and monitoring industry. Service providers maintaining chemical parameter testing excellence develop competitive advantages enabling customer retention and sustainable market growth supporting category expansion throughout extended forecast period.
List of Companies Covered in US Water Quality Testing & Monitoring Market
The companies listed below are highly influential in the US water quality testing & monitoring market, with a significant market share and a strong impact on industry developments.
- IDEXX
- In-Situ
- LaMotte
- Hach
- Xylem / YSI
- Thermo Fisher Scientific
- Teledyne ISCO
- Agilent Technologies
- Hanna Instruments
- Myron L Company
Market News & Updates
- IDEXX, 2026:
IDEXX reports one of the strongest verified financial updates for the US water testing space. In its February 2026 official results, the company states that Water revenues grew 12% reported and 10% organically in Q4 2025, with growth supported by both the US and international regions. This signals sustained demand for microbiology water testing across drinking water, wastewater, building water, and recreational water applications. IDEXX’s US water portfolio includes Colilert, Colilert-18, Enterolert, Legiolert, and IDEXX Tecta, which the company describes as the first US EPA-approved automated water microbiology testing system. This strengthens the market by supporting faster compliance testing, broader laboratory adoption, and automated detection of microbial risks in US water systems.
- In-Situ, 2026:
In-Situ’s acquisition by Veralto is the most significant strategic consolidation update among the listed US water monitoring companies. Veralto confirmed in February 2026 that it completed the acquisition of In-Situ in late January, expanding its water analytics portfolio into high-growth environmental water and hydrology markets. The original official transaction announcement valued the deal at USD 435 million, subject to customary adjustments, and identified Colorado-based In-Situ as a provider of water quality sondes, sensors, and data management solutions for surface-water and groundwater monitoring. This directly impacts the US market by combining In-Situ’s field monitoring capabilities with Veralto’s broader Water Quality platform, improving scale, software integration, and competitive positioning in environmental monitoring, municipal water, groundwater, and surface-water applications.
Frequently Asked Questions
Related Report
- Market Segmentation
- Research Scope
- Research Methodology
- Definitions and Assumptions
- Executive Summary
- US Water Quality Testing & Monitoring Market Policies, Regulations, and Standards
- US Water Quality Testing & Monitoring Market Dynamics
- Growth Factors
- Challenges
- Trends
- Opportunities
- US Water Quality Testing & Monitoring Market Statistics, 2022-2032F
- Market Size & Growth Outlook
- By Revenues in USD Million
- Market Segmentation & Growth Outlook
- By Product Type
- Water Quality Testing Instruments- Market Insights and Forecast 2022-2032, USD Million
- Water Quality Sensors & Probes- Market Insights and Forecast 2022-2032, USD Million
- Test Kits & Reagents- Market Insights and Forecast 2022-2032, USD Million
- Online Water Quality Monitoring Systems- Market Insights and Forecast 2022-2032, USD Million
- Portable Water Testing Devices- Market Insights and Forecast 2022-2032, USD Million
- Software & Data Management Platforms- Market Insights and Forecast 2022-2032, USD Million
- Others- Market Insights and Forecast 2022-2032, USD Million
- By Parameter Type
- Physical Parameters- Market Insights and Forecast 2022-2032, USD Million
- Chemical Parameters- Market Insights and Forecast 2022-2032, USD Million
- Biological/Microbiological Parameters- Market Insights and Forecast 2022-2032, USD Million
- Radiological Parameters- Market Insights and Forecast 2022-2032, USD Million
- Others- Market Insights and Forecast 2022-2032, USD Million
- By Technology
- Laboratory-Based Testing- Market Insights and Forecast 2022-2032, USD Million
- Portable/Field Testing- Market Insights and Forecast 2022-2032, USD Million
- Online/Real-Time Monitoring- Market Insights and Forecast 2022-2032, USD Million
- IoT-Based Monitoring- Market Insights and Forecast 2022-2032, USD Million
- Manual Testing- Market Insights and Forecast 2022-2032, USD Million
- Others- Market Insights and Forecast 2022-2032, USD Million
- By Water Source
- Drinking Water- Market Insights and Forecast 2022-2032, USD Million
- Wastewater & Effluent- Market Insights and Forecast 2022-2032, USD Million
- Surface Water- Market Insights and Forecast 2022-2032, USD Million
- Groundwater- Market Insights and Forecast 2022-2032, USD Million
- Industrial Process Water- Market Insights and Forecast 2022-2032, USD Million
- Recreational Water- Market Insights and Forecast 2022-2032, USD Million
- Others- Market Insights and Forecast 2022-2032, USD Million
- By End User
- Municipal Water Utilities- Market Insights and Forecast 2022-2032, USD Million
- Industrial Facilities- Market Insights and Forecast 2022-2032, USD Million
- Environmental Agencies- Market Insights and Forecast 2022-2032, USD Million
- Commercial Testing Laboratories- Market Insights and Forecast 2022-2032, USD Million
- Research & Academic Institutes- Market Insights and Forecast 2022-2032, USD Million
- Residential & Commercial Users- Market Insights and Forecast 2022-2032, USD Million
- Others- Market Insights and Forecast 2022-2032, USD Million
- By Sales Channel
- Retail Online- Market Insights and Forecast 2022-2032, USD Million
- Company-Owned Websites- Market Insights and Forecast 2022-2032, USD Million
- E-Commerce Platforms- Market Insights and Forecast 2022-2032, USD Million
- Online Laboratory Service Portals- Market Insights and Forecast 2022-2032, USD Million
- B2B Procurement Platforms- Market Insights and Forecast 2022-2032, USD Million
- Retail Offline- Market Insights and Forecast 2022-2032, USD Million
- Direct Sales- Market Insights and Forecast 2022-2032, USD Million
- Distributors/Dealers- Market Insights and Forecast 2022-2032, USD Million
- Specialty Instrument Stores- Market Insights and Forecast 2022-2032, USD Million
- Laboratory Equipment Suppliers- Market Insights and Forecast 2022-2032, USD Million
- Local Authorized Sales Partners- Market Insights and Forecast 2022-2032, USD Million
- Retail Online- Market Insights and Forecast 2022-2032, USD Million
- By Region
- West- Market Insights and Forecast 2022-2032, USD Million
- Midwest- Market Insights and Forecast 2022-2032, USD Million
- South- Market Insights and Forecast 2022-2032, USD Million
- North- Market Insights and Forecast 2022-2032, USD Million
- Northeast- Market Insights and Forecast 2022-2032, USD Million
- By Competitors
- Competition Characteristics
- Market Share & Analysis
- By Product Type
- Market Size & Growth Outlook
- US Water Quality Testing Instruments Market Statistics, 2022-2032
- Market Size & Growth Outlook
- By Revenues in USD Million
- Market Segmentation & Growth Outlook
- By Parameter Type- Market Insights and Forecast 2022-2032, USD Million
- By Technology- Market Insights and Forecast 2022-2032, USD Million
- By Water Source- Market Insights and Forecast 2022-2032, USD Million
- By End User- Market Insights and Forecast 2022-2032, USD Million
- By Sales Channel- Market Insights and Forecast 2022-2032, USD Million
- By Region- Market Insights and Forecast 2022-2032, USD Million
- Market Size & Growth Outlook
- US Water Quality Sensors & Probes Market Statistics, 2022-2032
- Market Size & Growth Outlook
- By Revenues in USD Million
- Market Segmentation & Growth Outlook
- By Parameter Type- Market Insights and Forecast 2022-2032, USD Million
- By Technology- Market Insights and Forecast 2022-2032, USD Million
- By Water Source- Market Insights and Forecast 2022-2032, USD Million
- By End User- Market Insights and Forecast 2022-2032, USD Million
- By Sales Channel- Market Insights and Forecast 2022-2032, USD Million
- By Region- Market Insights and Forecast 2022-2032, USD Million
- Market Size & Growth Outlook
- US Test Kits & Reagents Market Statistics, 2022-2032
- Market Size & Growth Outlook
- By Revenues in USD Million
- Market Segmentation & Growth Outlook
- By Parameter Type- Market Insights and Forecast 2022-2032, USD Million
- By Technology- Market Insights and Forecast 2022-2032, USD Million
- By Water Source- Market Insights and Forecast 2022-2032, USD Million
- By End User- Market Insights and Forecast 2022-2032, USD Million
- By Sales Channel- Market Insights and Forecast 2022-2032, USD Million
- By Region- Market Insights and Forecast 2022-2032, USD Million
- Market Size & Growth Outlook
- US Online Water Quality Monitoring Systems Market Statistics, 2022-2032
- Market Size & Growth Outlook
- By Revenues in USD Million
- Market Segmentation & Growth Outlook
- By Parameter Type- Market Insights and Forecast 2022-2032, USD Million
- By Technology- Market Insights and Forecast 2022-2032, USD Million
- By Water Source- Market Insights and Forecast 2022-2032, USD Million
- By End User- Market Insights and Forecast 2022-2032, USD Million
- By Sales Channel- Market Insights and Forecast 2022-2032, USD Million
- By Region- Market Insights and Forecast 2022-2032, USD Million
- Market Size & Growth Outlook
- US Portable Water Testing Devices Market Statistics, 2022-2032
- Market Size & Growth Outlook
- By Revenues in USD Million
- Market Segmentation & Growth Outlook
- By Parameter Type- Market Insights and Forecast 2022-2032, USD Million
- By Technology- Market Insights and Forecast 2022-2032, USD Million
- By Water Source- Market Insights and Forecast 2022-2032, USD Million
- By End User- Market Insights and Forecast 2022-2032, USD Million
- By Sales Channel- Market Insights and Forecast 2022-2032, USD Million
- By Region- Market Insights and Forecast 2022-2032, USD Million
- Market Size & Growth Outlook
- US Software & Data Management Platforms Market Statistics, 2022-2032
- Market Size & Growth Outlook
- By Revenues in USD Million
- Market Segmentation & Growth Outlook
- By Parameter Type- Market Insights and Forecast 2022-2032, USD Million
- By Technology- Market Insights and Forecast 2022-2032, USD Million
- By Water Source- Market Insights and Forecast 2022-2032, USD Million
- By End User- Market Insights and Forecast 2022-2032, USD Million
- By Sales Channel- Market Insights and Forecast 2022-2032, USD Million
- By Region- Market Insights and Forecast 2022-2032, USD Million
- Market Size & Growth Outlook
- Competitive Outlook
- Company Profiles
- Hach
- Business Description
- Product Portfolio
- Collaborations & Alliances
- Recent Developments
- Financial Details
- Others
- Xylem/YSI
- Business Description
- Product Portfolio
- Collaborations & Alliances
- Recent Developments
- Financial Details
- Others
- Thermo Fisher Scientific
- Business Description
- Product Portfolio
- Collaborations & Alliances
- Recent Developments
- Financial Details
- Others
- Teledyne ISCO
- Business Description
- Product Portfolio
- Collaborations & Alliances
- Recent Developments
- Financial Details
- Others
- Agilent Technologies
- Business Description
- Product Portfolio
- Collaborations & Alliances
- Recent Developments
- Financial Details
- Others
- IDEXX
- Business Description
- Product Portfolio
- Collaborations & Alliances
- Recent Developments
- Financial Details
- Others
- In-Situ
- Business Description
- Product Portfolio
- Collaborations & Alliances
- Recent Developments
- Financial Details
- Others
- LaMotte
- Business Description
- Product Portfolio
- Collaborations & Alliances
- Recent Developments
- Financial Details
- Others
- Hanna Instruments
- Business Description
- Product Portfolio
- Collaborations & Alliances
- Recent Developments
- Financial Details
- Others
- Myron L Company
- Business Description
- Product Portfolio
- Collaborations & Alliances
- Recent Developments
- Financial Details
- Others
- Hach
- Company Profiles
- Disclaimer
| Segment | Sub-Segment |
|---|---|
| By Product Type |
|
| By Parameter Type |
|
| By Technology |
|
| By Water Source |
|
| By End User |
|
| By Sales Channel |
|
| By Region |
|
Research Methodology
This study followed a structured approach comprising four key phases to assess the size and scope of the electro-oxidation market. The process began with thorough secondary research to collect data on the target market, related markets, and broader industry context. These findings, along with preliminary assumptions and estimates, were then validated through extensive primary research involving industry experts from across the value chain. To calculate the overall market size, both top-down and bottom-up methodologies were employed. Finally, market segmentation and data triangulation techniques were applied to refine and validate segment-level estimations.
Secondary Research
The secondary research phase involved gathering data from a wide range of credible and published sources. This step helped in identifying industry trends, defining market segmentation, and understanding the market landscape and value chain.
Sources consulted during this phase included:
- Company annual reports, investor presentations, and press releases
- Industry white papers and certified publications
- Trade directories and market-recognized databases
- Articles from authoritative authors and reputable journals
- Gold and silver standard websites
Secondary research was critical in mapping out the industry's value chain and monetary flow, identifying key market segments, understanding regional variations, and tracking significant industry developments.
Other key sources:
- Financial disclosures
- Industry associations and trade bodies
- News outlets and business magazines
- Academic journals and research studies
- Paid industry databases
Primary Research
To validate secondary data and gain deeper market insights, primary research was conducted with key stakeholders across both the supply and demand sides of the market.
On the demand side, participants included decision-makers and influencers from end-user industries—such as CIOs, CTOs, and CSOs—who provided first-hand perspectives on market needs, product usage, and future expectations.
On the supply side, interviews were conducted with manufacturers, industry associations, and institutional participants to gather insights into current offerings, product pipelines, and market challenges.
Primary interviews provided critical inputs such as:
- Market size and revenue data
- Product and service breakdowns
- Market forecasts
- Regional and application-specific trends
Stakeholders consulted included:
- Leading OEM and solution providers
- Channel and distribution partners
- End users across various applications
- Independent consultants and industry specialists
Market Size Estimation and Data Triangulation
- Identifying Key Market Participants (Secondary Research)
- Goal: To identify the major players or companies in the target market. This typically involves using publicly available data sources such as industry reports, market research publications, and financial statements of companies.
- Tools: Reports from firms like Gartner, Forrester, Euromonitor, Statista, IBISWorld, and others. Public financial statements, news articles, and press releases from top market players.
- Extracting Earnings of Key Market Participants
- Goal: To estimate the earnings generated from the product or service being analyzed. This step helps in understanding the revenue potential of each market player in a specific geography.
- Methods: Earnings data can be gathered from:
- Publicly available financial reports (for listed companies).
- Interviews and primary data sources from professionals, such as Directors, VPs, SVPs, etc. This is especially useful for understanding more nuanced, internal data that isn't publicly disclosed.
- Annual reports and investor presentations of key players.
- Data Collation and Development of a Relevant Data Model
- Goal: To collate inputs from both primary and secondary sources into a structured, data-driven model for market estimation. This model will incorporate key market KPIs and any independent variables relevant to the market.
- Key KPIs: These could include:
- Market size, growth rate, and demand drivers.
- Industry-specific metrics like market share, average revenue per customer (ARPC), or average deal size.
- External variables, such as economic growth rates, inflation rates, or commodity prices, that could affect the market.
- Data Modeling: Based on this data, the market forecasts are developed for the next 5 years. A combination of trend analysis, scenario modeling, and statistical regression might be used to generate projections.
- Scenario Analysis
- Goal: To test different assumptions and validate how sensitive the market is to changes in key variables (e.g., market demand, regulatory changes, technological disruptions).
- Types of Scenarios:
- Base Case: Based on current assumptions and historical data.
- Best-Case Scenario: Assuming favorable market conditions, regulatory environments, and technological advancements.
- Worst-Case Scenario: Accounting for adverse factors, such as economic downturns, stricter regulations, or unexpected disruptions.


