US Proteomics Market Report: Trends, Growth and Forecast (2026-2032)
By Technology (Spectroscopy (Mass Spectroscopy, NMR Spectroscopy, CD Spectroscopy), Chromatography (HPLC Chromatography, Affinity Chromatography, Supercritical Fluid Chromatography, Ion Exchange Chromatography), Electrophoresis (Gel Electrophoresis, Capillary Electrophoresis), Protein Microarray (Biochip, Lab-on-Chip, Protein Chip, Microarray Instrument, Integrated System, Microarray Scanner, Arrayers), Crystallography (Surface Plasma Resonance, Fractionation, Others)), By Reagent (Immunoassay Reagents, Spectroscopy Reagents, Chromatography Reagents, Protein Microarray Reagents, X-Ray Crystallography Reagents, Electrophoresis Reagents, Protein Fractionation Reagents, Others), By Offering (Core Proteomics Services (Protein Identification, Protein Characterization, Quantitative Proteomic, Protein Purification, Protein Sequencing, Custom Assay), Bioinformatics Software & Services (Bioinformatics Software, Bioinformatics Tools, Bioinformatics Databases)), By Application (Drug Discovery (Target Discovery, Lead Identification, Lead Optimization, Preclinical Studies), Clinical Diagnostics (Oncology, Infectious Diseases, Diabetes, Neurological Disorder, Autoimmune Diseases, Cardiovascular Diseases, Others)), By End-User (Academic & Research Institutes, Contract Research Organizations, Pharmaceutical & Biotechnology Companies, Others), By Region (West, Midwest, South, North, Northeast) ... Read more
|
Major Players
|
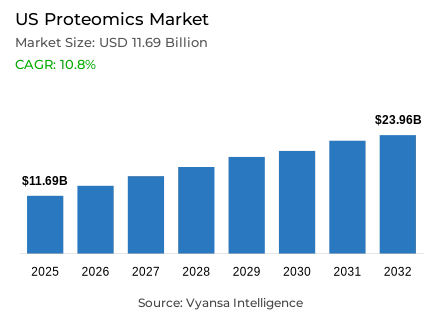
US Proteomics Market Statistics and Insights, 2026
- Market Size Statistics
- Proteomics market size in US was valued at USD 11.69 billion in 2025 and is estimated at USD 12.95 billion in 2026.
- The market size is expected to grow to USD 23.96 billion by 2032.
- Market to register a CAGR of around 10.8% during 2026-32.
- Technology Shares
- Mass spectroscopy grabbed market share of 45%.
- Competition
- More than 10 companies are actively engaged in producing proteomics in US.
- Top 5 companies acquired around 25% of the market share.
- Bio-Techne, Standard BioTools, Illumina, Thermo Fisher Scientific, Danaher (SCIEX) etc., are few of the top companies.
- Application
- Drug discovery grabbed 40% of the market.
US Proteomics Market Outlook
The US proteomics market was valued at USD 11.69 billion in 2025, establishing a commercially robust and scientifically well-anchored foundation within the world's most advanced and highest-capacity biomedical research ecosystem. Projected to advance from USD 12.95 billion in 2026 to USD 23.96 billion by 2032, the sector registers a CAGR of 10.8% across the forecast horizon. This strong and structurally supported expansion trajectory reflects the convergence of sustained institutional research funding at unprecedented scale, the systematic advancement of protein-centric analytical methodologies, and the deepening pharmaceutical market commitment to precision medicine whose protein-level data requirements are driving consistent and compounding adoption of advanced proteomics platforms across academic institutions, research centers, and drug development organizations throughout the United States. Growth is anchored in genuine scientific necessity and therapeutic development imperative rather than technology adoption cycles, giving this market a commercial resilience that sustains consistent tool and platform investment across diverse research and clinical application contexts.
The technology architecture defining this market's commercial structure is anchored in mass spectrometry capabilities. Mass Spectrometry commands approximately 45% of total technology market share, reflecting the consistent and deeply embedded scientific preference for analytical platforms whose detection sensitivity, molecular specificity, and comprehensive protein identification capacity make them the reference technology across protein biomarker discovery, disease mechanism research, and therapeutic target validation workflows across the United States. This technology concentration confirms that research institutions and pharmaceutical organizations continue to prioritize proven, analytically superior mass spectrometry-based approaches whose performance credentials and established methodology frameworks sustain disproportionate procurement share across both discovery-stage research and translational validation applications within the American proteomics landscape.
The application architecture reinforces the structural centrality of drug discovery as the category's dominant research focus. Drug Discovery accounts for approximately 40% of total application market share, reflecting the foundational role of protein-level analysis in therapeutic target identification, biomarker validation, and mechanism-of-action research across pharmaceutical development programs whose success increasingly depends on early-stage protein expression profiling and pathway understanding. This application concentration signals that pharmaceutical research investment remains the primary commercial driver of proteomics platform adoption across the United States, where protein-centric data generation directly supports candidate selection efficiency, clinical trial design improvement, and translational research acceleration across the market's most commercially significant research segments.
The future outlook is defined by four converging structural forces whose combined commercial impact creates a proteomics market of sustained and exceptionally strong expansion momentum. The National Institutes of Health's annual research funding of nearly USD 48 billion, with the bulk directed toward biomedical research activities, establishes an institutional funding foundation whose scale and continuity create persistent demand for advanced proteomics platforms and research infrastructure across the nation's most significant academic and research institutions. The National Cancer Institute's operation of the Proteomic Data Commons as the largest public repository of comprehensive tumor proteomic datasets, incorporating 218 studies, 70 terabytes of data, and 193,024 data files covering 6,051 cases and 16,860 proteins, confirms the institutional commitment to proteomics research standardization and accessibility that is progressively elevating proteomics adoption across broader research communities. The National Cancer Institute's December 17, 2025 release of Proteomic Data Commons 2.0 with enhanced filtering, improved study data linking, and centralized documentation confirms the systematic advancement of multi-omics integration infrastructure whose development is progressively reshaping research workflows toward integrated proteomic, genomic, imaging, and clinical data analysis. The FDA's documentation of 46 novel drug approvals in 2025 and the identification of fewer than 200 proteins currently targeted by FDA-approved cancer drugs confirms the substantial unmet opportunity for proteomics-enabled target discovery and therapeutic development across oncology and broader precision medicine applicationsover the forecast period.

US Proteomics Market Growth Driver
Sustained Federal Research Funding Sustains Institutional Demand
The sustained and exceptional scale of federal research funding through the National Institutes of Health represents the primary structural driver of American proteomics demand, functioning as a persistent institutional and pharmaceutical investment imperative that sustains consistent research funding, platform procurement, and analytical capability development across both academic institutions and commercial research organizations throughout the United States. This federally-supported demand dynamic transcends private sector funding cycle fluctuations, reflecting a durable institutional and scientific necessity whose research investment generation is structurally anchored in the irreducible requirement for deeper biological understanding and more precise biomarker identification that advanced proteomics platforms uniquely enable.
The quantitative evidence validating this federally-supported demand dynamic is documented with precision by the National Institutes of Health and supporting research infrastructure documentation. The NIH invests approximately USD 48 billion annually in medical research, confirming that federal research funding provides an institutional foundation whose scale and continuity create persistent demand for advanced proteomics platforms and research infrastructure across the nation's most significant academic and research institutions. The National Cancer Institute's operation of the Proteomic Data Commons as the largest public repository of tumor proteomic datasets, incorporating 218 studies and 70 terabytes of comprehensive proteomic data, establishes that federal investment in proteomics research infrastructure and standardization is advancing at a pace that progressively expands the addressable market for commercial proteomics solutions. These funding metrics validate a research investment demand dynamic of sufficient institutional scale and stability to sustain structural proteomics market growthover the forecast period.
US Proteomics Market Challenge
Multi-Omics Data Integration Complexity Elevates Execution Burden
The progressively expanding complexity of integrating proteomic data with genomic, imaging, and clinical information at scale represents the most consequential structural challenge confronting the American proteomics market, creating systematic execution burden, technical infrastructure requirements, and analytical standardization obstacles that elevate the capability threshold for effective proteomics research adoption across academic and pharmaceutical research organizations. In a research environment where proteomics increasingly functions as one data layer within integrated multi-omics analysis frameworks rather than standalone protein analysis, the operational requirements for seamless data harmonization, cross-platform integration, and unified interpretation have expanded substantially, creating differentiation advantages for platform providers capable of delivering comprehensive multi-omics analytical solutions.
The structural depth and technical specificity of this integration complexity are quantified with precision by the National Cancer Institute. The Proteomic Data Commons documents 218 studies, 70 terabytes of data, 193,024 data files, 6,051 cases, and 16,860 proteins, confirming that proteomics data volume has scaled to levels where conventional analysis approaches become computationally challenging and standardization increasingly critical. The NCI further documents that integrating proteomic data with genomic, imaging, or clinical data requires different identifiers and standards across data types, creating a harmonization burden that necessitates powerful computing resources and sophisticated data management infrastructure. For proteomics platform providers, navigating this challenge demands strategic investment in cloud-based analytical infrastructure, multi-omics integration capability, and data standardization frameworks that can progressively expand the addressable market for integrated multi-layer research analysisover the forecast period.
Unlock Market Intelligence
Explore the market potential with our data-driven report
US Proteomics Market Trend
Multi-Omics Integration Reshapes Research Infrastructure and Analytical Requirements
The systematic shift from single-layer omics analysis toward integrated multi-omics research approaches represents the defining structural trend reshaping proteomics research methodologies, analytical platform design priorities, and competitive differentiation parameters across the American market. This multi-omics integration trend is progressively transforming the functional role of proteomics from standalone protein analysis into a coordinated data layer whose integration with genomic, imaging, and clinical insights enables more comprehensive disease characterization, more robust biomarker discovery, and more clinically actionable biological interpretation than any single omics modality can deliver independently.
The institutional momentum and structural specificity of this multi-omics integration trend are documented with authority by the National Cancer Institute. The NCI's December 17, 2025 release of Proteomic Data Commons 2.0 adds enhanced filters, clearer links to related study data, and centralized documentation, explicitly positioning integrated proteomic, genomic, imaging, and clinical data as the cornerstone of precision medicine development. The NCI's operation of multi-omics analysis capability within the Cancer Research Data Commons ecosystem without data downloading requirements confirms that multi-omics research standardization is advancing at an institutional level that will progressively formalize proteomics integration expectations across government-supported and regulated research programs. As multi-omics research becomes more deeply integrated into major disease study programs and precision medicine development pathways, proteomics platform providers whose systems support seamless integration with genomic and imaging data streams will capture disproportionate share of institutional research funding and pharmaceutical development investmentover the forecast period.
US Proteomics Market Opportunity
Therapeutic Target Discovery Creates Sustained High-Value Market Expansion
The continuous expansion of precision-targeted pharmaceutical research and the accelerating adoption of proteomics-enabled target discovery methodologies creates a structurally significant and commercially compelling opportunity for proteomics platform and service providers whose capabilities align with the specific protein biomarker identification, therapeutic target validation, and mechanism-of-action research requirements of pharmaceutical development programs. This drug discovery opportunity is distinguished from academic research demand by its commercial scale, its direct linkage to therapeutic development success metrics, and its consistent funding visibility across pharmaceutical market segments whose research investment decisions are driven by therapeutic opportunity assessment and competitive positioning considerations.
The quantitative scale and pharmaceutical market specificity of this target discovery opportunity are documented with precision by the FDA and the National Cancer Institute. The FDA's documentation of 46 novel drug approvals in 2025 confirms that pharmaceutical development momentum is sustaining robust expansion whose success increasingly depends on protein-level biological insights that advanced proteomics platforms deliver at discovery and preclinical development stages. The National Cancer Institute's documentation of pan-cancer proteogenomics data across 1,043 patients spanning 10 cancer types, combined with the identification that fewer than 200 proteins are currently targeted by FDA-approved cancer drugs, establishes that substantial therapeutic target discovery opportunity remains available for proteomics-enabled drug development. For proteomics service providers and platform developers that invest in pharmaceutical development relevance, biomarker validation credibility, and research methodology communication capability, the therapeutic target discovery market represents a commercially attractive and durably sustainable growth opportunity whose expansion is directly proportional to pharmaceutical development momentum and therapeutic innovation pipeline scaleover the forecast period.
Unlock Market Intelligence
Explore the market potential with our data-driven report
US Proteomics Market Segmentation Analysis
By Technology
- Spectroscopy
- Mass Spectroscopy
- NMR Spectroscopy
- CD Spectroscopy
- Chromatography
- HPLC Chromatography
- Affinity Chromatography
- Supercritical Fluid Chromatography
- Ion Exchange Chromatography
- Electrophoresis
- Gel Electrophoresis
- Capillary Electrophoresis
- Protein Microarray
- Biochip
- Lab-on-Chip
- Protein Chip
- Microarray Instrument
- Integrated System
- Microarray Scanner
- Arrayers
- Crystallography
- Surface Plasma Resonance
- Fractionation
- Others
The segment with highest market share under the Technology is Mass Spectrometry, accounting for approximately 45% of the total market. This commanding position reflects the deep structural alignment between mass spectrometry analytical capabilities and the specific protein identification, biomarker discovery, and molecular characterization requirements of the American research and pharmaceutical development community, where detection sensitivity, molecular specificity, and comprehensive analytical coverage make mass spectrometry-based platforms the reference technology standard across oncology research, translational medicine, and therapeutic development workflows. With nearly half of total market value concentrated within a single technology category, Mass Spectrometry defines the research methodology priorities, analytical platform investment frameworks, and competitive positioning strategies of the US proteomics market.
The structural leadership of Mass Spectrometry is sustained by the analytical performance and methodological maturity that have established this technology as the gold standard for protein-centric discovery research across academic and pharmaceutical environments throughout the United States. As multi-omics integration advances and precision medicine research demands increasingly sophisticated protein profiling across complex biological systems, mass spectrometry platforms are progressively evolving to support higher-throughput capacity, improved quantification accuracy, and more seamless integration with genomic, imaging, and clinical data streams. This technological evolution positions established mass spectrometry platform providers to capture both sustained replacement demand and expanding application breadth procurement across the American research and pharmaceutical development market base. The segment's structural dominance as the market's primary technology revenue contributor is expected to consolidateover the forecast period.

By Application
- Drug Discovery
- Target Discovery
- Lead Identification
- Lead Optimization
- Preclinical Studies
- Clinical Diagnostics
- Oncology
- Infectious Diseases
- Diabetes
- Neurological Disorder
- Autoimmune Diseases
- Cardiovascular Diseases
- Others
The segment with highest market share under the Application is Drug Discovery, accounting for approximately 40% of the total market. This dominant position reflects the foundational role of protein-level analysis in pharmaceutical research where biomarker identification, therapeutic target validation, and mechanism-of-action characterization directly support drug candidate selection, clinical development pathway optimization, and translational research acceleration across the market's most commercially significant pharmaceutical development programs. With two-fifths of total market value anchored in drug discovery applications, this segment defines the research investment priorities, analytical capability requirements, and competitive positioning strategies that shape proteomics platform development and supplier competitive advantage across the American market.
The structural leadership of Drug Discovery is being actively sustained by the accelerating pharmaceutical innovation momentum and the progressively more protein-centric approach to early-stage drug development that characterizes contemporary therapeutic research programs across the United States. The FDA's documentation of 46 novel drug approvals in 2025 confirms that pharmaceutical development activity is sustaining robust expansion momentum whose success increasingly depends on protein-level biological insights that advanced proteomics platforms uniquely deliver at discovery and preclinical development stages. The National Cancer Institute's quantification of pan-cancer proteogenomics data across 1,043 patients spanning 10 cancer types, coupled with the identification that fewer than 200 proteins are targeted by FDA-approved cancer drugs, establishes that substantial therapeutic target discovery opportunity remains available for proteomics-enabled drug development programs. As pharmaceutical research becomes more targeted and evidence-driven, the commercial importance of proteomics tools in supporting earlier, more confident candidate selection decisions and reducing late-stage development failures is driving sustained and expanding investment in proteomics platform procurement across the American pharmaceutical development ecosystem. The Drug Discovery segment's position as the market's dominant application anchor and primary revenue driver is expected to strengthenover the forecast period.
List of Companies Covered in US Proteomics Market
The companies listed below are highly influential in the US proteomics market, with a significant market share and a strong impact on industry developments.
- Bio-Techne
- Standard BioTools
- Illumina
- Thermo Fisher Scientific
- Danaher (SCIEX)
- Agilent Technologies
- Bruker
- Waters Corporation
- Revvity
- Shimadzu Scientific Instruments
Market News & Updates
- OmniActive Health Technologies, 2025:
OmniActive announced that the U.S. FDA acknowledged Lutemax Free Lutein for use in infant formula, and the company said this regulatory milestone opens a new category for its flagship lutein ingredient by giving infant-formula manufacturers a differentiated carotenoid source to support infant eye and brain development. For the U.S. phytonutrients market, this is a highly significant update because it expands lutein’s addressable market into one of the most tightly regulated nutrition segments and strengthens the commercial relevance of carotenoid-based phytonutrients in early-life nutrition
- Lycored, 2025:
Lycored announced at IFT FIRST in Chicago the debut of three superstable, nature-based color emulsions—including new yellow and orange shades positioned as replacements for Yellow 5 and 6—while also emphasizing that its lycopene-based red solutions can replace Red 3 and Red 40 across beverages, gummies, sauces, supplements, and fruit preparations. For the U.S. phytonutrients market, this is one of the clearest product-led developments because it directly connects carotenoid-based natural color systems with reformulation demand in the U.S. food and supplement industry, where brands are increasingly looking for stable plant-derived alternatives to synthetic dyes.
Frequently Asked Questions
Related Report
- Market Segmentation
- Research Scope
- Research Methodology
- Definitions and Assumptions
- Executive Summary
- US Proteomics Market Policies, Regulations, and Standards
- US Proteomics Market Dynamics
- Growth Factors
- Challenges
- Trends
- Opportunities
- US Proteomics Market Statistics, 2022-2032F
- Market Size & Growth Outlook
- By Revenues in USD Million
- Market Segmentation & Growth Outlook
- By Technology
- Spectroscopy- Market Insights and Forecast 2022-2032, USD Million
- Mass Spectroscopy- Market Insights and Forecast 2022-2032, USD Million
- NMR Spectroscopy- Market Insights and Forecast 2022-2032, USD Million
- CD Spectroscopy- Market Insights and Forecast 2022-2032, USD Million
- Chromatography- Market Insights and Forecast 2022-2032, USD Million
- HPLC Chromatography- Market Insights and Forecast 2022-2032, USD Million
- Affinity Chromatography- Market Insights and Forecast 2022-2032, USD Million
- Supercritical Fluid Chromatography- Market Insights and Forecast 2022-2032, USD Million
- Ion Exchange Chromatography- Market Insights and Forecast 2022-2032, USD Million
- Electrophoresis- Market Insights and Forecast 2022-2032, USD Million
- Gel Electrophoresis- Market Insights and Forecast 2022-2032, USD Million
- Capillary Electrophoresis- Market Insights and Forecast 2022-2032, USD Million
- Protein Microarray- Market Insights and Forecast 2022-2032, USD Million
- Biochip- Market Insights and Forecast 2022-2032, USD Million
- Lab-on-Chip- Market Insights and Forecast 2022-2032, USD Million
- Protein Chip- Market Insights and Forecast 2022-2032, USD Million
- Microarray Instrument- Market Insights and Forecast 2022-2032, USD Million
- Integrated System- Market Insights and Forecast 2022-2032, USD Million
- Microarray Scanner- Market Insights and Forecast 2022-2032, USD Million
- Arrayers- Market Insights and Forecast 2022-2032, USD Million
- Crystallography- Market Insights and Forecast 2022-2032, USD Million
- Surface Plasma Resonance- Market Insights and Forecast 2022-2032, USD Million
- Fractionation- Market Insights and Forecast 2022-2032, USD Million
- Others- Market Insights and Forecast 2022-2032, USD Million
- Spectroscopy- Market Insights and Forecast 2022-2032, USD Million
- By Reagent
- Immunoassay Reagents- Market Insights and Forecast 2022-2032, USD Million
- Spectroscopy Reagents- Market Insights and Forecast 2022-2032, USD Million
- Chromatography Reagents- Market Insights and Forecast 2022-2032, USD Million
- Protein Microarray Reagents- Market Insights and Forecast 2022-2032, USD Million
- X-Ray Crystallography Reagents- Market Insights and Forecast 2022-2032, USD Million
- Electrophoresis Reagents- Market Insights and Forecast 2022-2032, USD Million
- Protein Fractionation Reagents- Market Insights and Forecast 2022-2032, USD Million
- Others- Market Insights and Forecast 2022-2032, USD Million
- By Offering
- Core Proteomics Services- Market Insights and Forecast 2022-2032, USD Million
- Protein Identification- Market Insights and Forecast 2022-2032, USD Million
- Protein Characterization- Market Insights and Forecast 2022-2032, USD Million
- Quantitative Proteomic- Market Insights and Forecast 2022-2032, USD Million
- Protein Purification- Market Insights and Forecast 2022-2032, USD Million
- Protein Sequencing- Market Insights and Forecast 2022-2032, USD Million
- Custom Assay- Market Insights and Forecast 2022-2032, USD Million
- Bioinformatics Software & Services- Market Insights and Forecast 2022-2032, USD Million
- Bioinformatics Software- Market Insights and Forecast 2022-2032, USD Million
- Bioinformatics Tools- Market Insights and Forecast 2022-2032, USD Million
- Bioinformatics Databases- Market Insights and Forecast 2022-2032, USD Million
- Core Proteomics Services- Market Insights and Forecast 2022-2032, USD Million
- By Application
- Drug Discovery- Market Insights and Forecast 2022-2032, USD Million
- Target Discovery- Market Insights and Forecast 2022-2032, USD Million
- Lead Identification- Market Insights and Forecast 2022-2032, USD Million
- Lead Optimization- Market Insights and Forecast 2022-2032, USD Million
- Preclinical Studies - Market Insights and Forecast 2022-2032, USD Million
- Clinical Diagnostics- Market Insights and Forecast 2022-2032, USD Million
- Oncology- Market Insights and Forecast 2022-2032, USD Million
- Infectious Diseases- Market Insights and Forecast 2022-2032, USD Million
- Diabetes- Market Insights and Forecast 2022-2032, USD Million
- Neurological Disorder- Market Insights and Forecast 2022-2032, USD Million
- Autoimmune Diseases- Market Insights and Forecast 2022-2032, USD Million
- Cardiovascular Diseases- Market Insights and Forecast 2022-2032, USD Million
- Others- Market Insights and Forecast 2022-2032, USD Million
- Drug Discovery- Market Insights and Forecast 2022-2032, USD Million
- By End-User
- Academic & Research Institutes- Market Insights and Forecast 2022-2032, USD Million
- Contract Research Organizations- Market Insights and Forecast 2022-2032, USD Million
- Pharmaceutical & Biotechnology Companies- Market Insights and Forecast 2022-2032, USD Million
- Others- Market Insights and Forecast 2022-2032, USD Million
- By Region
- West
- Midwest
- South
- North
- Northeast
- By Competitors
- Competition Characteristics
- Market Share & Analysis
- By Technology
- Market Size & Growth Outlook
- US Spectroscopy Market Statistics, 2022-2032
- Market Size & Growth Outlook
- By Revenues in USD Million
- Market Segmentation & Growth Outlook
- By Reagent- Market Insights and Forecast 2022-2032, USD Million
- By Offering- Market Insights and Forecast 2022-2032, USD Million
- By Application- Market Insights and Forecast 2022-2032, USD Million
- By End-User- Market Insights and Forecast 2022-2032, USD Million
- By Region- Market Insights and Forecast 2022-2032, USD Million
- Market Size & Growth Outlook
- US Chromatography Market Statistics, 2022-2032
- Market Size & Growth Outlook
- By Revenues in USD Million
- Market Segmentation & Growth Outlook
- By Reagent- Market Insights and Forecast 2022-2032, USD Million
- By Offering- Market Insights and Forecast 2022-2032, USD Million
- By Application- Market Insights and Forecast 2022-2032, USD Million
- By End-User- Market Insights and Forecast 2022-2032, USD Million
- By Region- Market Insights and Forecast 2022-2032, USD Million
- Market Size & Growth Outlook
- US Electrophoresis Market Statistics, 2022-2032
- Market Size & Growth Outlook
- By Revenues in USD Million
- Market Segmentation & Growth Outlook
- By Reagent- Market Insights and Forecast 2022-2032, USD Million
- By Offering- Market Insights and Forecast 2022-2032, USD Million
- By Application- Market Insights and Forecast 2022-2032, USD Million
- By End-User- Market Insights and Forecast 2022-2032, USD Million
- By Region- Market Insights and Forecast 2022-2032, USD Million
- Market Size & Growth Outlook
- US Protein Microarray Market Statistics, 2022-2032
- Market Size & Growth Outlook
- By Revenues in USD Million
- Market Segmentation & Growth Outlook
- By Reagent- Market Insights and Forecast 2022-2032, USD Million
- By Offering- Market Insights and Forecast 2022-2032, USD Million
- By Application- Market Insights and Forecast 2022-2032, USD Million
- By End-User- Market Insights and Forecast 2022-2032, USD Million
- By Region- Market Insights and Forecast 2022-2032, USD Million
- Market Size & Growth Outlook
- US Crystallography Market Statistics, 2022-2032
- Market Size & Growth Outlook
- By Revenues in USD Million
- Market Segmentation & Growth Outlook
- By Reagent- Market Insights and Forecast 2022-2032, USD Million
- By Offering- Market Insights and Forecast 2022-2032, USD Million
- By Application- Market Insights and Forecast 2022-2032, USD Million
- By End-User- Market Insights and Forecast 2022-2032, USD Million
- By Region- Market Insights and Forecast 2022-2032, USD Million
- Market Size & Growth Outlook
- Competitive Outlook
- Company Profiles
- Thermo Fisher Scientific
- Business Description
- Product Portfolio
- Collaborations & Alliances
- Recent Developments
- Financial Details
- Others
- Danaher (SCIEX)
- Business Description
- Product Portfolio
- Collaborations & Alliances
- Recent Developments
- Financial Details
- Others
- Agilent Technologies
- Business Description
- Product Portfolio
- Collaborations & Alliances
- Recent Developments
- Financial Details
- Others
- Bruker
- Business Description
- Product Portfolio
- Collaborations & Alliances
- Recent Developments
- Financial Details
- Others
- Waters Corporation
- Business Description
- Product Portfolio
- Collaborations & Alliances
- Recent Developments
- Financial Details
- Others
- Bio-Techne
- Business Description
- Product Portfolio
- Collaborations & Alliances
- Recent Developments
- Financial Details
- Others
- Standard BioTools
- Business Description
- Product Portfolio
- Collaborations & Alliances
- Recent Developments
- Financial Details
- Others
- Illumina
- Business Description
- Product Portfolio
- Collaborations & Alliances
- Recent Developments
- Financial Details
- Others
- Revvity
- Business Description
- Product Portfolio
- Collaborations & Alliances
- Recent Developments
- Financial Details
- Others
- Shimadzu Scientific Instruments
- Business Description
- Product Portfolio
- Collaborations & Alliances
- Recent Developments
- Financial Details
- Others
- Thermo Fisher Scientific
- Company Profiles
- Disclaimer
| Segment | Sub-Segment |
|---|---|
| By Technology |
|
| By Reagent |
|
| By Offering |
|
| By Application |
|
| By End-User |
|
| By Region |
|
Research Methodology
This study followed a structured approach comprising four key phases to assess the size and scope of the electro-oxidation market. The process began with thorough secondary research to collect data on the target market, related markets, and broader industry context. These findings, along with preliminary assumptions and estimates, were then validated through extensive primary research involving industry experts from across the value chain. To calculate the overall market size, both top-down and bottom-up methodologies were employed. Finally, market segmentation and data triangulation techniques were applied to refine and validate segment-level estimations.
Secondary Research
The secondary research phase involved gathering data from a wide range of credible and published sources. This step helped in identifying industry trends, defining market segmentation, and understanding the market landscape and value chain.
Sources consulted during this phase included:
- Company annual reports, investor presentations, and press releases
- Industry white papers and certified publications
- Trade directories and market-recognized databases
- Articles from authoritative authors and reputable journals
- Gold and silver standard websites
Secondary research was critical in mapping out the industry's value chain and monetary flow, identifying key market segments, understanding regional variations, and tracking significant industry developments.
Other key sources:
- Financial disclosures
- Industry associations and trade bodies
- News outlets and business magazines
- Academic journals and research studies
- Paid industry databases
Primary Research
To validate secondary data and gain deeper market insights, primary research was conducted with key stakeholders across both the supply and demand sides of the market.
On the demand side, participants included decision-makers and influencers from end-user industries—such as CIOs, CTOs, and CSOs—who provided first-hand perspectives on market needs, product usage, and future expectations.
On the supply side, interviews were conducted with manufacturers, industry associations, and institutional participants to gather insights into current offerings, product pipelines, and market challenges.
Primary interviews provided critical inputs such as:
- Market size and revenue data
- Product and service breakdowns
- Market forecasts
- Regional and application-specific trends
Stakeholders consulted included:
- Leading OEM and solution providers
- Channel and distribution partners
- End users across various applications
- Independent consultants and industry specialists
Market Size Estimation and Data Triangulation
- Identifying Key Market Participants (Secondary Research)
- Goal: To identify the major players or companies in the target market. This typically involves using publicly available data sources such as industry reports, market research publications, and financial statements of companies.
- Tools: Reports from firms like Gartner, Forrester, Euromonitor, Statista, IBISWorld, and others. Public financial statements, news articles, and press releases from top market players.
- Extracting Earnings of Key Market Participants
- Goal: To estimate the earnings generated from the product or service being analyzed. This step helps in understanding the revenue potential of each market player in a specific geography.
- Methods: Earnings data can be gathered from:
- Publicly available financial reports (for listed companies).
- Interviews and primary data sources from professionals, such as Directors, VPs, SVPs, etc. This is especially useful for understanding more nuanced, internal data that isn't publicly disclosed.
- Annual reports and investor presentations of key players.
- Data Collation and Development of a Relevant Data Model
- Goal: To collate inputs from both primary and secondary sources into a structured, data-driven model for market estimation. This model will incorporate key market KPIs and any independent variables relevant to the market.
- Key KPIs: These could include:
- Market size, growth rate, and demand drivers.
- Industry-specific metrics like market share, average revenue per customer (ARPC), or average deal size.
- External variables, such as economic growth rates, inflation rates, or commodity prices, that could affect the market.
- Data Modeling: Based on this data, the market forecasts are developed for the next 5 years. A combination of trend analysis, scenario modeling, and statistical regression might be used to generate projections.
- Scenario Analysis
- Goal: To test different assumptions and validate how sensitive the market is to changes in key variables (e.g., market demand, regulatory changes, technological disruptions).
- Types of Scenarios:
- Base Case: Based on current assumptions and historical data.
- Best-Case Scenario: Assuming favorable market conditions, regulatory environments, and technological advancements.
- Worst-Case Scenario: Accounting for adverse factors, such as economic downturns, stricter regulations, or unexpected disruptions.


