US Insecticides Market Report: Trends, Growth and Forecast (2026-2032)
By Origin (Synthetic Insecticides, Bio-Insecticides), By Product Type (Pyrethroids, Organophosphate, Carbamates, Neonicotinoids, Botanicals, Others), By Crop Type (Cereals & Grains, Oilseeds & Pulses, Fruits & Vegetables, Commercial Crops, Others), By Form (Sprays, Baits, Strips), By Formulation (Wettable Powder, Emulsifiable Concentrate, Suspension Concentrate, Granules, Others), By Insect Pest Type (Sucking Pest Insecticides, Biting and Chewing Pest Insecticides), By Region (West, Midwest, South, North, Northeast) ... Read more
|
Major Players
|
US Insecticides Market Statistics and Insights, 2026
- Market Size Statistics
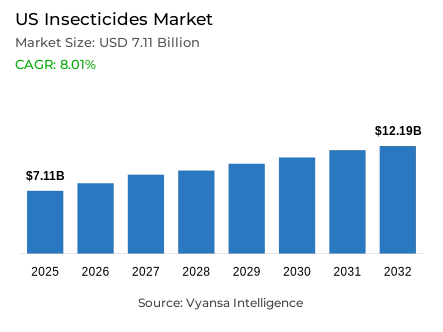
- Insecticides market size in US was valued at USD 7.11 billion in 2025 and is estimated at USD 8.18 billion in 2026.
- The market size is expected to grow to USD 12.19 billion by 2032.
- Market to register a CAGR of around 8.01% during 2026-32.
- Origin Shares
- Synthetic insecticides grabbed market share of 80%.
- Competition
- More than 10 companies are actively engaged in producing insecticides in US.
- Top 5 companies acquired around 40% of the market share.
- UPL NA Inc. , ADAMA US , Sumitomo Chemicals , Syngenta Crop Protection LLC , Bayer CropScience LP etc., are few of the top companies.
- Product Type
- Pyrethroids grabbed 30% of the market.
US Insecticides Market Outlook
The US insecticides market size was valued at USD 7.11 billion in 2025 and is projected to grow from USD 8.18 billion in 2026 to USD 12.19 billion by 2032, exhibiting a CAGR of 8.01% during the forecast period. Demand expands as growers use crop protection insecticides to protect establishment, canopy health, fiber quality, fruit appearance, grain development, and harvestable output across row crops, cotton, vegetables, fruits, nuts, and protected cultivation systems.
The market includes synthetic insecticides, bio-insecticides, pyrethroids, organophosphates, carbamates, neonicotinoids, botanicals, microbial products, biochemical products, insecticide sprays, baits, strips, and formulation systems used against sucking, biting, chewing, and soil-associated crop insects. It excludes herbicides, fungicides, fertilizers, seed genetics, and non-agricultural pest-control products unless directly used for agricultural insect management in commercial farming programs where timing, coverage, formulation choice, and biology influence yield, quality, and market access.
US agricultural insecticides exist because pest pressure can reduce yield and crop quality before losses become fully visible. Sucking pests weaken plant vigor and may transmit disease, while chewing pests damage leaves, stems, fruits, flowers, pods, bolls, and reproductive structures. insecticides reduce pest populations during sensitive crop stages and protect grower spending on seed, fertilizer, labor, machinery, irrigation, and crop-management programs across corn, soybeans, cotton, potatoes, and specialty crops.
The outlook remains shaped by direct insecticide use in cotton and specialty crops, EPA insecticide registration priorities, integrated pest management, pyrethroid rotation discipline, and biological pest-control adoption in residue-sensitive production. Synthetic insecticides remain central because they provide fast control, while bio-insecticides gain relevance where growers need pest resistance management, lower residue exposure, and better fit with specialty crop programs. The insecticides market in the US therefore moves toward more disciplined, crop-specific use rather than broad application growth, especially as label compliance, residue compliance, pollinator protection, and state-level pest monitoring shape treatment decisions.

US Insecticides Market Growth Driver
Treated Crop Systems Sustain Insect-Control Demand
The strongest driver in the US insecticides market is direct insecticide use in crops where pest pressure can quickly reduce crop value, not only the size of planted acreage. Cotton, vegetables, fruits, and specialty crops require insect pest control programs because feeding injury can affect stand establishment, lint quality, pod formation, fruit appearance, processor acceptance, and fresh-market grade. Growers adopt crop protection insecticides when scouting, pest thresholds, crop value, and treatment economics show that unmanaged insects can cost more than timely application.
USDA NASS reported that insecticides were applied to 39% of U.S. cotton planted acres in the 2025 crop year, while its cotton survey covered 13 states accounting for 97% of the 9.3 million acres planted. USDA NASS also reported insecticides were applied to 71% of squash planted acres and 44% of snap bean planted acres in 2024. These direct use figures support demand in cotton and vegetables. The upward trajectory mechanism is crop yield protection: demand strengthens where growers need rapid knockdown, residual control, systemic activity, or targeted suppression to protect farm productivity, marketable quality, and harvest timing across commercial farming systems. This keeps demand recurring across seasons with changing pest biology and local weather patterns.
US Insecticides Market Challenge
Endangered Species Mitigation Raises Application Complexity
The main challenge in the US insecticides market is the rising stewardship burden around insecticide use. Growers still need insecticides to protect crops, but product use faces greater scrutiny related to endangered species, spray drift, runoff, aquatic exposure, pollinators, worker safety, label compliance, and residue compliance. This increases application complexity because insect-control decisions must consider pest thresholds, crop value, field location, mitigation options, buffer requirements, equipment setup, wind conditions, runoff potential, and timing.
EPA states that its Insecticide Strategy identifies mitigations aimed at protecting more than 900 species listed by the U.S. Fish and Wildlife Service that EPA considers when registering a new insecticide or reevaluating an existing one. EPA also clarifies that the strategy is a framework for registration and re-registration, not an immediate user mandate. This affects suppliers because EPA insecticide registration increasingly needs ecological-risk alignment. A pyrethroid, organophosphate, carbamate, neonicotinoid, or bio-insecticide may control the pest, but growers must still use it under crop, rate, drift, and mitigation conditions. Products with clearer labels, lower drift risk, targeted activity, and integrated pest management fit gain preference. This raises demand for retailer guidance, applicator training, digital label tools, and location-specific use planning during field-level treatment decisions each season.
Unlock Market Intelligence
Explore the market potential with our data-driven report
US Insecticides Market Trend
Integrated Programs Reshape Product Use
The strongest trend in the US insecticides market is the shift toward integrated pest management programs that combine chemical insecticides, bio-insecticides, scouting, economic thresholds, resistance rotation, residue management, and emerging pest-control tools. Growers are not abandoning synthetic insecticides, but they are using them more deliberately within broader systems. Repeated use of one mode of action can accelerate resistance, while residue, pollinator, worker-safety, and environmental pressures require better-timed and more selective applications.
IR-4’s 2024 Annual Report states that EPA actions established 52 new tolerances for 8 active ingredients, supporting 1,024 potential new uses on food crops. It also describes Integrated Solutions projects using chemical pesticides, biopesticides, and emerging technologies to manage hard-to-control pests, resistance, residues, and organic crop needs. This supports a shift toward multi-tool programs, especially in specialty crops. Synthetic products remain important for fast suppression, while biological insecticides, botanicals, microbial products, pheromone systems, and precision spraying support rotation and low-residue crop protection. The upward trajectory mechanism is value retention: integrated programs help preserve existing active ingredients by reducing unnecessary applications and matching products with crop stage and pest biology. This improves timing discipline in residue-sensitive and resistance-prone production systems across specialty crops and greenhouse cultivation programs nationally.
US Insecticides Market Opportunity
Bio-Insecticide Rotation Creates Targeted Growth
The strongest opportunity in the US insecticides market is bio-insecticide use as a rotation and residue-management tool in specialty crops, organic systems, greenhouse cultivation, and high-value fresh-market crops. This should not be framed as full replacement for synthetic insecticides. It is a targeted demand pocket where growers need pest suppression while managing resistance risk, pre-harvest intervals, pollinator exposure, worker re-entry considerations, and buyer residue expectations.
EPA’s biopesticide active ingredient list includes biochemical and microbial active ingredients registered by EPA as of February 12, 2026, including newer entries such as Priestia megaterium strain SYM36613 in 2026 and Beauveria bassiana strain BW149 in 2025. This supports opportunity creation because new active ingredients widen the toolkit available to growers and advisers. Specialty crop growers often face contracts and buyer specifications where visible insect injury, residue concerns, and harvest timing affect market access. Bio-insecticides can support rotation, reduce pressure on conventional modes of action, and fit programs where softer profiles or targeted biological activity are valuable. The opportunity is therefore residue-aware and resistance-aware control in crops where quality loss is commercially expensive. This favors suppliers with stable formulations, clear timing guidance, and compatibility with synthetic programs, especially fruits and vegetables and nut systems.
Unlock Market Intelligence
Explore the market potential with our data-driven report
US Insecticides Market Segmentation Analysis
By Origin
- Synthetic Insecticides
- Bio-Insecticides
The segment with the highest share under the Origin category is Synthetic insecticides, holding around 80% of the market, based on supplied market-share input. Synthetic insecticides lead because they provide fast, familiar, and commercially reliable pest control across row crops, cotton, vegetables, fruits, nuts, and other systems. Growers use them when insect pressure threatens establishment, tissue integrity, lint quality, fruit appearance, pod set, grain development, or harvest timing.
These crop protection insecticides include pyrethroids, organophosphates, carbamates, neonicotinoids, and other chemical classes with different modes of action, pest spectra, residual profiles, mobility, and crop fit. Their leadership reflects distributor availability, applicator familiarity, broad label coverage, fast control, and integration into seasonal crop-protection plans. Bio-insecticides are gaining relevance, but they remain behind where performance is sensitive to pest stage, temperature, humidity, UV exposure, coverage, storage, and timing. Future competition in the US insecticides market is likely to be program-based rather than origin-based. Synthetic products will remain central where immediate control is required, while biological crop protection expands where residue management, rotation, and targeted suppression matter. This keeps the segment tied to urgent field economics, not only legacy product familiarity, across commercial farming and specialty crop programs under label compliance pressures in practice.

By Product Type
- Pyrethroids
- Organophosphate
- Carbamates
- Neonicotinoids
- Botanicals
- Others
The segment with the highest share under the Product Type category is Pyrethroids, holding around 30% of the market, based on supplied market-share input. Pyrethroids lead because they offer fast knockdown, broad-spectrum activity, familiar application behavior, and cost-effective control across many agricultural pest situations. In crop systems, pyrethroid insecticides are valued when growers need rapid suppression of chewing insects and selected sucking pests during economically sensitive stages.
USDA NASS vegetable chemical-use data provides direct U.S.-specific evidence for pyrethroid active ingredient use in selected vegetables. In 2024, bifenthrin was applied to 27% of sweet corn planted acres, lambda-cyhalothrin to 18% of sweet corn planted acres, and zeta-cypermethrin to 24% of squash planted acres. Other product types remain important: organophosphates and carbamates can provide strong activity, neonicotinoids offer systemic control in permitted uses, and botanicals or microbial insecticides fit residue-sensitive programs. The limitation for pyrethroids is resistance and ecological stewardship. Future demand depends on timing, rate discipline, mode-of-action rotation, drift management, and integration with scouting thresholds within integrated pest management systems. Within the US crop insecticide market, they remain practical, but their long-term role depends on responsible deployment under label compliance and resistance-management expectations within commercial crop systems each season.
List of Companies Covered in US Insecticides Market
The companies listed below are highly influential in the US insecticides market, with a significant market share and a strong impact on industry developments.
- UPL NA Inc.
- ADAMA US
- Sumitomo Chemicals
- Syngenta Crop Protection LLC
- Bayer CropScience LP
- Corteva Inc.
- BASF Corporation
- FMC Corporation
- Nufarm Americas Inc.
- Valent U.S.A. LLC
Market News & Updates
- ADAMA US, 2026:
ADAMA launched Ateka insecticide in March 2026 for U.S. fruit and vegetable crops. The product is a high-load spirotetramat suspension concentrate powered by Ayalon Formulation Technology, designed for systemic movement and faster plant uptake. It targets aphids, psyllids, mites, scales, thrips, leafminers, mealybugs and whiteflies across citrus, pome fruit, stone fruit, grapes, leafy greens and fruiting vegetables, supporting sucking pest control programs in specialty crop production across the U.S. market and adjacent horticulture supply channels nationally. for specialty crop growers.
- Syngenta Crop Protection, 2025:
Syngenta received U.S. EPA registration for PLINAZOLIN technology in December 2025. The active ingredient will power five insecticide products for corn, cotton, vegetables, tree fruit, cereals and other crops, subject to state approvals. The technology belongs to IRAC Group 30 and is positioned for broad-spectrum insect pest management, supporting U.S. growers with a new mode-of-action option for resistance management across major row and specialty crop systems in the insecticides market nationally and commercially. across major producing states and specialty regions.
Frequently Asked Questions
Related Report
- Market Segmentation
- Research Scope
- Research Methodology
- Definitions and Assumptions
- Executive Summary
- US Insecticides Market Policies, Regulations, and Standards
- US Insecticides Market Dynamics
- Growth Factors
- Challenges
- Trends
- Opportunities
- US Insecticides Market Statistics, 2022-2032F
- Market Size & Growth Outlook
- By Revenues in USD Million
- By Quantity Sold in Million Tons
- Market Segmentation & Growth Outlook
- By Origin
- Synthetic Insecticides- Market Insights and Forecast 2022-2032, USD Million
- Bio-Insecticides- Market Insights and Forecast 2022-2032, USD Million
- By Product Type
- Pyrethroids- Market Insights and Forecast 2022-2032, USD Million
- Organophosphate- Market Insights and Forecast 2022-2032, USD Million
- Carbamates- Market Insights and Forecast 2022-2032, USD Million
- Neonicotinoids- Market Insights and Forecast 2022-2032, USD Million
- Botanicals- Market Insights and Forecast 2022-2032, USD Million
- Others- Market Insights and Forecast 2022-2032, USD Million
- By Crop Type
- Cereals & Grains- Market Insights and Forecast 2022-2032, USD Million
- Oilseeds & Pulses- Market Insights and Forecast 2022-2032, USD Million
- Fruits & Vegetables- Market Insights and Forecast 2022-2032, USD Million
- Commercial Crops- Market Insights and Forecast 2022-2032, USD Million
- Others- Market Insights and Forecast 2022-2032, USD Million
- By Form
- Sprays- Market Insights and Forecast 2022-2032, USD Million
- Baits- Market Insights and Forecast 2022-2032, USD Million
- Strips- Market Insights and Forecast 2022-2032, USD Million
- By Formulation
- Wettable Powder- Market Insights and Forecast 2022-2032, USD Million
- Emulsifiable Concentrate- Market Insights and Forecast 2022-2032, USD Million
- Suspension Concentrate- Market Insights and Forecast 2022-2032, USD Million
- Granules- Market Insights and Forecast 2022-2032, USD Million
- Others- Market Insights and Forecast 2022-2032, USD Million
- By Insect Pest Type
- Sucking Pest Insecticides- Market Insights and Forecast 2022-2032, USD Million
- Biting and Chewing Pest Insecticides- Market Insights and Forecast 2022-2032, USD Million
- By Region
- West- Market Insights and Forecast 2022-2032, USD Million
- Midwest- Market Insights and Forecast 2022-2032, USD Million
- South- Market Insights and Forecast 2022-2032, USD Million
- North- Market Insights and Forecast 2022-2032, USD Million
- Northeast- Market Insights and Forecast 2022-2032, USD Million
- By Competitors
- Competition Characteristics
- Market Share & Analysis
- By Origin
- Market Size & Growth Outlook
- US Synthetic Insecticides Market Statistics, 2022-2032
- Market Size & Growth Outlook
- By Revenues in USD Million
- By Quantity Sold in Million Tons
- Market Segmentation & Growth Outlook
- By Product Type- Market Insights and Forecast 2022-2032, USD Million
- By Crop Type- Market Insights and Forecast 2022-2032, USD Million
- By Form- Market Insights and Forecast 2022-2032, USD Million
- By Formulation- Market Insights and Forecast 2022-2032, USD Million
- By Insect Pest Type- Market Insights and Forecast 2022-2032, USD Million
- By Region- Market Insights and Forecast 2022-2032, USD Million
- Market Size & Growth Outlook
- US Bio-Insecticides Market Statistics, 2022-2032
- Market Size & Growth Outlook
- By Revenues in USD Million
- By Quantity Sold in Million Tons
- Market Segmentation & Growth Outlook
- By Product Type- Market Insights and Forecast 2022-2032, USD Million
- By Crop Type- Market Insights and Forecast 2022-2032, USD Million
- By Form- Market Insights and Forecast 2022-2032, USD Million
- By Formulation- Market Insights and Forecast 2022-2032, USD Million
- By Insect Pest Type- Market Insights and Forecast 2022-2032, USD Million
- By Region- Market Insights and Forecast 2022-2032, USD Million
- Market Size & Growth Outlook
- Competitive Outlook
- Company Profiles
- Syngenta Crop Protection, LLC
- Business Description
- Product Portfolio
- Collaborations & Alliances
- Recent Developments
- Financial Details
- Others
- Bayer CropScience LP
- Business Description
- Product Portfolio
- Collaborations & Alliances
- Recent Developments
- Financial Details
- Others
- Corteva, Inc.
- Business Description
- Product Portfolio
- Collaborations & Alliances
- Recent Developments
- Financial Details
- Others
- BASF Corporation
- Business Description
- Product Portfolio
- Collaborations & Alliances
- Recent Developments
- Financial Details
- Others
- FMC Corporation
- Business Description
- Product Portfolio
- Collaborations & Alliances
- Recent Developments
- Financial Details
- Others
- UPL NA Inc.
- Business Description
- Product Portfolio
- Collaborations & Alliances
- Recent Developments
- Financial Details
- Others
- ADAMA US
- Business Description
- Product Portfolio
- Collaborations & Alliances
- Recent Developments
- Financial Details
- Others
- Sumitomo Chemicals
- Business Description
- Product Portfolio
- Collaborations & Alliances
- Recent Developments
- Financial Details
- Others
- Nufarm Americas Inc.
- Business Description
- Product Portfolio
- Collaborations & Alliances
- Recent Developments
- Financial Details
- Others
- Valent U.S.A. LLC
- Business Description
- Product Portfolio
- Collaborations & Alliances
- Recent Developments
- Financial Details
- Others
- Syngenta Crop Protection, LLC
- Company Profiles
- Disclaimer
| Segment | Sub-Segment |
|---|---|
| By Origin |
|
| By Product Type |
|
| By Crop Type |
|
| By Form |
|
| By Formulation |
|
| By Insect Pest Type |
|
| By Region |
|
Research Methodology
This study followed a structured approach comprising four key phases to assess the size and scope of the electro-oxidation market. The process began with thorough secondary research to collect data on the target market, related markets, and broader industry context. These findings, along with preliminary assumptions and estimates, were then validated through extensive primary research involving industry experts from across the value chain. To calculate the overall market size, both top-down and bottom-up methodologies were employed. Finally, market segmentation and data triangulation techniques were applied to refine and validate segment-level estimations.
Secondary Research
The secondary research phase involved gathering data from a wide range of credible and published sources. This step helped in identifying industry trends, defining market segmentation, and understanding the market landscape and value chain.
Sources consulted during this phase included:
- Company annual reports, investor presentations, and press releases
- Industry white papers and certified publications
- Trade directories and market-recognized databases
- Articles from authoritative authors and reputable journals
- Gold and silver standard websites
Secondary research was critical in mapping out the industry's value chain and monetary flow, identifying key market segments, understanding regional variations, and tracking significant industry developments.
Other key sources:
- Financial disclosures
- Industry associations and trade bodies
- News outlets and business magazines
- Academic journals and research studies
- Paid industry databases
Primary Research
To validate secondary data and gain deeper market insights, primary research was conducted with key stakeholders across both the supply and demand sides of the market.
On the demand side, participants included decision-makers and influencers from end-user industries—such as CIOs, CTOs, and CSOs—who provided first-hand perspectives on market needs, product usage, and future expectations.
On the supply side, interviews were conducted with manufacturers, industry associations, and institutional participants to gather insights into current offerings, product pipelines, and market challenges.
Primary interviews provided critical inputs such as:
- Market size and revenue data
- Product and service breakdowns
- Market forecasts
- Regional and application-specific trends
Stakeholders consulted included:
- Leading OEM and solution providers
- Channel and distribution partners
- End users across various applications
- Independent consultants and industry specialists
Market Size Estimation and Data Triangulation
- Identifying Key Market Participants (Secondary Research)
- Goal: To identify the major players or companies in the target market. This typically involves using publicly available data sources such as industry reports, market research publications, and financial statements of companies.
- Tools: Reports from firms like Gartner, Forrester, Euromonitor, Statista, IBISWorld, and others. Public financial statements, news articles, and press releases from top market players.
- Extracting Earnings of Key Market Participants
- Goal: To estimate the earnings generated from the product or service being analyzed. This step helps in understanding the revenue potential of each market player in a specific geography.
- Methods: Earnings data can be gathered from:
- Publicly available financial reports (for listed companies).
- Interviews and primary data sources from professionals, such as Directors, VPs, SVPs, etc. This is especially useful for understanding more nuanced, internal data that isn't publicly disclosed.
- Annual reports and investor presentations of key players.
- Data Collation and Development of a Relevant Data Model
- Goal: To collate inputs from both primary and secondary sources into a structured, data-driven model for market estimation. This model will incorporate key market KPIs and any independent variables relevant to the market.
- Key KPIs: These could include:
- Market size, growth rate, and demand drivers.
- Industry-specific metrics like market share, average revenue per customer (ARPC), or average deal size.
- External variables, such as economic growth rates, inflation rates, or commodity prices, that could affect the market.
- Data Modeling: Based on this data, the market forecasts are developed for the next 5 years. A combination of trend analysis, scenario modeling, and statistical regression might be used to generate projections.
- Scenario Analysis
- Goal: To test different assumptions and validate how sensitive the market is to changes in key variables (e.g., market demand, regulatory changes, technological disruptions).
- Types of Scenarios:
- Base Case: Based on current assumptions and historical data.
- Best-Case Scenario: Assuming favorable market conditions, regulatory environments, and technological advancements.
- Worst-Case Scenario: Accounting for adverse factors, such as economic downturns, stricter regulations, or unexpected disruptions.


