Global Feed Prebiotics Market Report: Trends, Growth and Forecast (2026-2032)
By Product Type (Mannan Oligosaccharides, Fructo-Oligosaccharides, Galacto-Oligosaccharides, Inulin, Xylo-Oligosaccharides, Beta-Glucans, Others), By Livestock (Poultry, Swine, Ruminants, Aquaculture, Pets, Equine, Others), By Source (Plant-Based, Yeast-Derived, Microbial and Fermentation-Derived, Others), By Form (Powder, Granules, Liquid), By Function (Gut Health Management, Immune Support, Nutrient Absorption, Feed Efficiency Improvement, Pathogen Pressure Management, Others), By Region (North America, South America, Europe, Middle East and Africa, Asia Pacific) ... Read more
|
Major Players
|
Global Feed Prebiotics Market Statistics and Insights, 2026
- Market Size Statistics
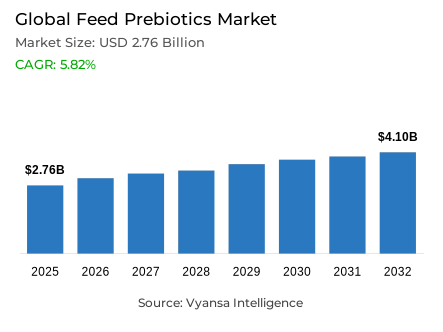
- Feed Prebiotics market size was valued at USD 2.76 billion in 2025 and is estimated at USD 3.05 billion in 2026.
- The market size is expected to grow to USD 4.1 billion by 2032.
- Market to register a CAGR of around 5.82% during 2026-32.
- Product Type Shares
- Inulin grabbed market share of 25%.
- Competition
- Global feed prebiotics market is currently being catered to by more than 15 companies.
- Top 5 companies acquired around 35% of the market share.
- Phileo by Lesaffre (Safmannan), Lallemand Inc. (OPTIWALL), Purina Animal Nutrition LLC (Land O Lakes), Alltech Inc. (Bio-Mos), Archer Daniels Midland Company etc., are few of the top companies.
- Livestock
- Poultry grabbed 45% of the market.
- Region
- Asia Pacific leads with a 30% share of the global market.
Global Feed Prebiotics Market Outlook
The global feed prebiotics market covers non-digestible functional feed ingredients used to support animal gut microbiota, nutrient absorption, immune function, and production performance across livestock, aquaculture, and companion animals. Valued at USD 2.76 Billion in 2025, it reaches USD 3.05 Billion in 2026 and is forecast to reach USD 4.10 Billion by 2032, expanding at 5.82% CAGR during 2026-2032. The global feed prebiotics industry is positioned within functional feed additives, animal nutrition prebiotics, and antibiotic-free animal nutrition systems.
Compound feed expansion, disease-management pressure, and antimicrobial stewardship are increasing interest in prebiotic feed additives that improve intestinal stability without therapeutic drug positioning. The 2026 Alltech Agri-Food Outlook reported that global feed production reached an estimated 1.44 billion metric tons in 2025, up 2.9%, giving the global feed prebiotics market a larger formulation base across poultry, swine, ruminants, aqua feed, and pet nutrition.
Ingredient suppliers, premix formulators, and integrated feed companies are using prebiotic animal feed solutions to protect margins through performance-oriented formulations rather than commodity nutrition alone. Demand benefits when producers shift procurement toward gut health additives, feed conversion support, and residue-conscious production systems, while manufacturers with stable inulin, MOS, beta-glucan, and FOS supply improve channel access with feed mills and species-specific nutrition programs across contract manufacturing, premix distribution, and branded additive portfolios.
Supplier positioning is increasingly shaped by documented ingredient functionality, regulatory readiness, and regional livestock intensification. The global feed prebiotics market is gaining stronger 2026 traction as animal nutrition companies package prebiotics with enzymes, probiotics, organic acids, and yeast fractions, creating synbiotic feed additives and multi-functional premixes that support preventive animal health management. The global feed prebiotics industry therefore remains demand-led rather than promotion-led, with adoption linked to measurable digestive performance, technical credibility, and compliant formulation claims. This supports recurrent procurement across feed mills and animal nutrition additive distributors.

Global Feed Prebiotics Market Growth Driver
Antibiotic Stewardship Accelerates Gut-Health Procurement
Antimicrobial stewardship and antibiotic-free livestock production are pushing feed mills toward gut-health additives that can support intestinal balance before disease pressure reduces productivity. Prebiotics fit this procurement shift because they work through microbiome modulation, selective bacterial fermentation, and digestive resilience rather than drug-like treatment claims. For the global feed prebiotics market, this creates demand from poultry, swine, and ruminant producers seeking preventive animal nutrition tools that align with residue-control programs and retailer-led antibiotic reduction commitments.
Nature Communications reported in 2025 that global livestock antibiotic use could reach about 143,481 tons by 2040 under a business-as-usual scenario, 29.5% above the 2019 baseline of 110,777 tons. That risk profile strengthens procurement interest in prebiotic feed additives, MOS feed additives, and inulin-based animal feed additives, while the global feed prebiotics industry gains demand from producers looking to reduce antibiotic dependency without weakening feed efficiency or flock performance across commercial livestock operations.
Global Feed Prebiotics Market Challenge
Compliance Proof Burdens Slow Supplier Conversion
Regulatory proof requirements and formulation variability limit faster commercialization because feed prebiotics must be positioned as safe, consistent, and technically defensible ingredients across different species and feed systems. Variable animal response, raw-material quality, heat stability, and inclusion-rate economics can slow buyer conversion, especially when feed mills compare prebiotics against enzymes, probiotics, organic acids, and lower-cost gut-health additives. This raises technical validation costs for the global feed prebiotics market. Smaller suppliers face slower approvals and weaker procurement leverage in regulated markets.
The European Commission stated in its 2026 feed-safety guidance that only authorised additives can be used in the EU, and they must be pre-approved after EFSA safety assessment. This compliance structure strengthens product credibility, but it also raises dossier, documentation, traceability, and labeling burdens for suppliers. The global feed prebiotics industry therefore faces higher market-entry complexity when ingredient claims, animal categories, and feed-premix uses require clear evidence before commercial expansion.
Unlock Market Intelligence
Explore the market potential with our data-driven report
Global Feed Prebiotics Market Trend
Microbiome-Led Blends Reshape Functional Feed Formulation
Microbiome-focused formulation is moving feed programs from single-function additives toward blended digestive-health systems that combine prebiotics, probiotics, enzymes, organic acids, and yeast derivatives. This trend strengthens technical differentiation because suppliers can position prebiotics within measurable outcomes such as gut barrier function, nutrient absorption, immune function support, and feed conversion ratio. The global feed prebiotics market gains from this shift as buyers seek functional feed additives rather than isolated commodity ingredients across higher value animal nutrition channels and premix procurement programs.
EFSA stated that products containing microorganisms, or prepared from or with microorganisms, are among the most abundant feed additives, and its 2025 microorganism characterization guidance becomes fully applicable to technical dossiers from 1 April 2026. The update reinforces data quality expectations across microbial and fermentation-derived inputs, supporting stronger formulation discipline. The global feed prebiotics industry benefits when suppliers align product claims, quality documentation, and species-specific evidence with regulator-facing technical expectations.
Global Feed Prebiotics Market Opportunity
Aquafeed and Young-Animal Nutrition Create Premium White Space
Aquaculture and young-animal nutrition offer whitespace for suppliers because both areas face intensive production conditions, disease sensitivity, and performance losses linked to digestive instability. Prebiotic solutions can support fish gut health, piglet digestive health, calf nutrition, and antibiotic-free poultry nutrition through targeted premixes and species-specific inclusion strategies. For the global feed prebiotics market, this creates scope for premium positioning beyond conventional compound feed. Specialty distributors can capture demand through technical service and localized trials with feed mill partners.
FAO reported in 2024 that global aquaculture production reached 130.9 million tonnes, including 94.4 million tonnes of aquatic animals, and aquaculture became the main producer of aquatic animals for the first time. That scale expands demand for aquafeed prebiotics, synbiotic feed additives, and sustainable animal nutrition systems. The global feed prebiotics industry can improve market access by serving aqua-feed formulators that require digestibility, disease-resistance support, and performance consistency under intensive farming conditions.
Global Feed Prebiotics Market Regional Analysis

By Region
- North America
- South America
- Europe
- Middle East and Africa
- Asia Pacific
Asia Pacific leads regional demand with 30% share because livestock production, aquaculture concentration, feed-mill density, and poultry growth are strongest across China, India, Indonesia, Viet Nam, Thailand, and Japan. The region’s demand base supports scale purchasing of animal feed prebiotics, prebiotic feed additives, and functional feed additives, while large integrated feed chains create faster adoption routes for gut health programs. This strengthens the global feed prebiotics market across high-volume production systems.
FAO’s 2024 SOFIA data shows Asia accounted for 70% of aquatic animal production, with China at 36%, India at 8%, Indonesia at 7%, and Viet Nam at 5% among main producers. This production concentration strengthens demand for aquaculture feed prebiotics and livestock gut health additives because disease resilience, digestive efficiency, and feed conversion remain central to regional output stability. Suppliers with local distribution, species-specific trials, and formulation support are better positioned across Asia Pacific and feed mills.
Unlock Market Intelligence
Explore the market potential with our data-driven report
Global Feed Prebiotics Market Segmentation Analysis
By Product Type
- Mannan Oligosaccharides
- Fructo-Oligosaccharides
- Galacto-Oligosaccharides
- Inulin
- Xylo-Oligosaccharides
- Beta-Glucans
- Others
Inulin leads product-type allocation because it combines recognized prebiotic functionality, plant-based sourcing, formulation stability, and use across farm animals and pets. Inulin holds 25% share, supported by its role as a fiber-based prebiotic that can reach the lower intestine and support beneficial bacterial fermentation. This positioning gives the global feed prebiotics market a technically clear ingredient anchor for animal nutrition prebiotics and digestive health additives. It also fits clean-label and sustainability-oriented formulation narratives for technical feed buyers and procurement teams.
BENEO states that its inulin-type fructans are resistant to digestive enzymes, remain stable under thermal and acid conditions, and are available in dry or liquid form with varying concentrations and polymerisation grades. Its Orafti IPS inulin shows 90% concentration, while Orafti SIPS shows 86%. These specifications support consistent formulation, inventory planning, and differentiated product claims, helping the global feed prebiotics industry maintain stronger pricing power around plant-based prebiotic feed additives.

By Livestock
- Poultry
- Swine
- Ruminants
- Aquaculture
- Pets
- Equine
- Others
Poultry leads livestock demand because broiler and layer systems operate through large-volume compound feed programs, short production cycles, and tight feed-conversion economics. Poultry holds 45% share, reflecting the segment’s strong need for gut health enhancement, immune function support, and non-antibiotic performance strategies across intensive farms. For the global feed prebiotics market, poultry creates recurring demand because inclusion decisions can be scaled rapidly through integrated feed mills and premix suppliers.
Alltech reported in 2025 that broiler feed production reached 385.415 million metric tons, rising 1.8%, while layer feed reached 173.038 million metric tons, rising 1.4%. This production scale strengthens demand for poultry feed prebiotics because flock productivity depends on digestive stability, nutrient absorption, and pathogen pressure management. Suppliers with MOS, beta-glucan, FOS, and synbiotic blends therefore gain stronger access to poultry nutrition programs. This also improves visibility for bulk supply contracts and regional distributor stocking across major feed production hubs.
Market Players in Global Feed Prebiotics Market
These market players maintain a significant presence in the Global feed prebiotics market and contribute to its ongoing evolution.
- Phileo by Lesaffre (Safmannan)
- Lallemand Inc. (OPTIWALL)
- Purina Animal Nutrition LLC (Land O Lakes)
- Alltech Inc. (Bio-Mos)
- Archer Daniels Midland Company
- DSM-Firmenich AG (Levabon)
- BENEO GmbH
- TEREOS GROUP (Tereos Starch & Sweeteners Europe)
- AB Agri Limited (AB Vista)
- COSUCRA Groupe Warcoing S.A. (COSUCRA ANIMAL NUTRITION)
- Ingredion Incorporated
- Ohly GmbH
- AngelYeast Co. Ltd.
- Kemin Industries Inc. (Aleta)
Market News & Updates
- Alltech Inc. (Bio-Mos), 2025:
Alltech positioned Bio-Mos 2 in 2025 as a new feed supplement for cattle, designed to support average daily gain and reinforce a healthy gut microbiome without antibiotics. The product builds on Alltech’s yeast-derived Bio-Mos technology and supports gut integrity, colostrum quality, and gastrointestinal stability. The update expands Alltech’s prebiotic-oriented gut health portfolio for ruminant nutrition programs.
- Kemin Industries Inc. (Aleta), 2025:
Kemin’s June 2025 swine product portfolio listed Aleta as a 1,3-beta glucan product within its gut health offering. The portfolio places Aleta alongside active microbials, intestinal integrity products, acidifiers, and pathogen-control solutions for swine production. The update supports beta-glucan-based feed additive positioning within preventive gut health and immune-support programs for commercial livestock operations.
Frequently Asked Questions
Related Report
- Market Segmentation
- Research Scope
- Research Methodology
- Definitions and Assumptions
- Executive Summary
- Global Feed Prebiotics Market Policies, Regulations, and Standards
- Global Feed Prebiotics Market Production (Metric Tons) Trend 2022-2032
- Global Feed Prebiotics Market Production (Metric Tons) Trend By Product Type
- Mannan Oligosaccharides
- Fructo-Oligosaccharides
- Galacto-Oligosaccharides
- Inulin
- Xylo-Oligosaccharides
- Company Wise Production Plants and Statistics
- Installed Production Capacity
- Actual Production
- Planned Production Target
- Global Feed Prebiotics Market Production (Metric Tons) Trend By Product Type
- Global Feed Prebiotics Market Pricing Analysis 2022-2032
- Global Feed Prebiotics Market Pricing Trend (USD/ Metric Tons) 2022-2032
- Global Feed Prebiotics Market Pricing Trend (USD/ Metric Tons) By Regions 2022-2032
- North America
- South America
- Europe
- Middle East and Africa
- Asia Pacific
- Global Feed Prebiotics Market Pricing Trend (USD/ Metric Tons) By Product Type 2022-2032
- Mannan Oligosaccharides
- Fructo-Oligosaccharides
- Galacto-Oligosaccharides
- Inulin
- Xylo-Oligosaccharides
- Global Feed Prebiotics Market Dynamics
- Growth Factors
- Challenges
- Trends
- Opportunities
- Global Feed Prebiotics Market Statistics, 2022-2032F
- Market Size & Growth Outlook
- By Revenues in USD Million
- By Quantity Sold in Metric Tons
- Market Segmentation & Growth Outlook
- By Product Type
- Mannan Oligosaccharides- Market Insights and Forecast 2022-2032, USD Million
- Fructo-Oligosaccharides- Market Insights and Forecast 2022-2032, USD Million
- Galacto-Oligosaccharides- Market Insights and Forecast 2022-2032, USD Million
- Inulin- Market Insights and Forecast 2022-2032, USD Million
- Xylo-Oligosaccharides- Market Insights and Forecast 2022-2032, USD Million
- Beta-Glucans- Market Insights and Forecast 2022-2032, USD Million
- Others- Market Insights and Forecast 2022-2032, USD Million
- By Livestock
- Poultry- Market Insights and Forecast 2022-2032, USD Million
- Swine- Market Insights and Forecast 2022-2032, USD Million
- Ruminants- Market Insights and Forecast 2022-2032, USD Million
- Aquaculture- Market Insights and Forecast 2022-2032, USD Million
- Pets- Market Insights and Forecast 2022-2032, USD Million
- Equine- Market Insights and Forecast 2022-2032, USD Million
- Others- Market Insights and Forecast 2022-2032, USD Million
- By Source
- Plant-Based- Market Insights and Forecast 2022-2032, USD Million
- Yeast-Derived- Market Insights and Forecast 2022-2032, USD Million
- Microbial and Fermentation-Derived- Market Insights and Forecast 2022-2032, USD Million
- Others- Market Insights and Forecast 2022-2032, USD Million
- By Form
- Powder- Market Insights and Forecast 2022-2032, USD Million
- Granules- Market Insights and Forecast 2022-2032, USD Million
- Liquid- Market Insights and Forecast 2022-2032, USD Million
- By Function
- Gut Health Management- Market Insights and Forecast 2022-2032, USD Million
- Immune Support- Market Insights and Forecast 2022-2032, USD Million
- Nutrient Absorption- Market Insights and Forecast 2022-2032, USD Million
- Feed Efficiency Improvement- Market Insights and Forecast 2022-2032, USD Million
- Pathogen Pressure Management- Market Insights and Forecast 2022-2032, USD Million
- Others- Market Insights and Forecast 2022-2032, USD Million
- By Region
- North America
- South America
- Europe
- Middle East and Africa
- Asia Pacific
- By Competitors
- Competition Characteristics
- Market Share & Analysis
- Alltech Inc. (Bio-Mos)
- Archer Daniels Midland Company
- DSM-Firmenich AG (Levabon)
- BENEO GmbH
- TEREOS GROUP (Tereos Starch & Sweeteners Europe)
- By Product Type
- Market Size & Growth Outlook
- North America Feed Prebiotics Market Statistics, 2022-2032F
- Market Size & Growth Outlook
- By Revenues in USD Million
- By Quantity Sold in Metric Tons
- Market Segmentation & Growth Outlook
- By Product Type- Market Insights and Forecast 2022-2032, USD Million
- By Livestock- Market Insights and Forecast 2022-2032, USD Million
- By Source- Market Insights and Forecast 2022-2032, USD Million
- By Form- Market Insights and Forecast 2022-2032, USD Million
- By Function- Market Insights and Forecast 2022-2032, USD Million
- By Country
- The US
- Canada
- Mexico
- Rest of North America
- The US Feed Prebiotics Market Statistics, 2022-2032F
- Market Size & Growth Outlook
- By Revenues in USD Million
- By Quantity Sold in Metric Tons
- Market Segmentation & Growth Outlook
- By Product Type- Market Insights and Forecast 2022-2032, USD Million
- By Livestock- Market Insights and Forecast 2022-2032, USD Million
- By Source- Market Insights and Forecast 2022-2032, USD Million
- By Form- Market Insights and Forecast 2022-2032, USD Million
- By Function- Market Insights and Forecast 2022-2032, USD Million
- Market Size & Growth Outlook
- Canada Feed Prebiotics Market Statistics, 2022-2032F
- Market Size & Growth Outlook
- By Revenues in USD Million
- By Quantity Sold in Metric Tons
- Market Segmentation & Growth Outlook
- By Product Type- Market Insights and Forecast 2022-2032, USD Million
- By Livestock- Market Insights and Forecast 2022-2032, USD Million
- By Source- Market Insights and Forecast 2022-2032, USD Million
- By Form- Market Insights and Forecast 2022-2032, USD Million
- By Function- Market Insights and Forecast 2022-2032, USD Million
- Market Size & Growth Outlook
- Mexico Feed Prebiotics Market Statistics, 2022-2032F
- Market Size & Growth Outlook
- By Revenues in USD Million
- By Quantity Sold in Metric Tons
- Market Segmentation & Growth Outlook
- By Product Type- Market Insights and Forecast 2022-2032, USD Million
- By Livestock- Market Insights and Forecast 2022-2032, USD Million
- By Source- Market Insights and Forecast 2022-2032, USD Million
- By Form- Market Insights and Forecast 2022-2032, USD Million
- By Function- Market Insights and Forecast 2022-2032, USD Million
- Market Size & Growth Outlook
- Market Size & Growth Outlook
- South America Feed Prebiotics Market Statistics, 2022-2032F
- Market Size & Growth Outlook
- By Revenues in USD Million
- By Quantity Sold in Metric Tons
- Market Segmentation & Growth Outlook
- By Product Type- Market Insights and Forecast 2022-2032, USD Million
- By Livestock- Market Insights and Forecast 2022-2032, USD Million
- By Source- Market Insights and Forecast 2022-2032, USD Million
- By Form- Market Insights and Forecast 2022-2032, USD Million
- By Function- Market Insights and Forecast 2022-2032, USD Million
- By Country
- Brazil
- Argentina
- Chile
- Rest of South America
- Brazil Feed Prebiotics Market Statistics, 2022-2032F
- Market Size & Growth Outlook
- By Revenues in USD Million
- By Quantity Sold in Metric Tons
- Market Segmentation & Growth Outlook
- By Product Type- Market Insights and Forecast 2022-2032, USD Million
- By Livestock- Market Insights and Forecast 2022-2032, USD Million
- By Source- Market Insights and Forecast 2022-2032, USD Million
- By Form- Market Insights and Forecast 2022-2032, USD Million
- By Function- Market Insights and Forecast 2022-2032, USD Million
- Market Size & Growth Outlook
- Argentina Feed Prebiotics Market Statistics, 2022-2032F
- Market Size & Growth Outlook
- By Revenues in USD Million
- By Quantity Sold in Metric Tons
- Market Segmentation & Growth Outlook
- By Product Type- Market Insights and Forecast 2022-2032, USD Million
- By Livestock- Market Insights and Forecast 2022-2032, USD Million
- By Source- Market Insights and Forecast 2022-2032, USD Million
- By Form- Market Insights and Forecast 2022-2032, USD Million
- By Function- Market Insights and Forecast 2022-2032, USD Million
- Market Size & Growth Outlook
- Chile Feed Prebiotics Market Statistics, 2022-2032F
- Market Size & Growth Outlook
- By Revenues in USD Million
- By Quantity Sold in Metric Tons
- Market Segmentation & Growth Outlook
- By Product Type- Market Insights and Forecast 2022-2032, USD Million
- By Livestock- Market Insights and Forecast 2022-2032, USD Million
- By Source- Market Insights and Forecast 2022-2032, USD Million
- By Form- Market Insights and Forecast 2022-2032, USD Million
- By Function- Market Insights and Forecast 2022-2032, USD Million
- Market Size & Growth Outlook
- Market Size & Growth Outlook
- Europe Feed Prebiotics Market Statistics, 2022-2032F
- Market Size & Growth Outlook
- By Revenues in USD Million
- By Quantity Sold in Metric Tons
- Market Segmentation & Growth Outlook
- By Product Type- Market Insights and Forecast 2022-2032, USD Million
- By Livestock- Market Insights and Forecast 2022-2032, USD Million
- By Source- Market Insights and Forecast 2022-2032, USD Million
- By Form- Market Insights and Forecast 2022-2032, USD Million
- By Function- Market Insights and Forecast 2022-2032, USD Million
- By Country
- Germany
- France
- The UK
- Italy
- Spain
- Russia
- Rest of Europe
- Germany Feed Prebiotics Market Statistics, 2022-2032F
- Market Size & Growth Outlook
- By Revenues in USD Million
- By Quantity Sold in Metric Tons
- Market Segmentation & Growth Outlook
- By Product Type- Market Insights and Forecast 2022-2032, USD Million
- By Livestock- Market Insights and Forecast 2022-2032, USD Million
- By Source- Market Insights and Forecast 2022-2032, USD Million
- By Form- Market Insights and Forecast 2022-2032, USD Million
- By Function- Market Insights and Forecast 2022-2032, USD Million
- Market Size & Growth Outlook
- France Feed Prebiotics Market Statistics, 2022-2032F
- Market Size & Growth Outlook
- By Revenues in USD Million
- By Quantity Sold in Metric Tons
- Market Segmentation & Growth Outlook
- By Product Type- Market Insights and Forecast 2022-2032, USD Million
- By Livestock- Market Insights and Forecast 2022-2032, USD Million
- By Source- Market Insights and Forecast 2022-2032, USD Million
- By Form- Market Insights and Forecast 2022-2032, USD Million
- By Function- Market Insights and Forecast 2022-2032, USD Million
- Market Size & Growth Outlook
- The UK Feed Prebiotics Market Statistics, 2022-2032F
- Market Size & Growth Outlook
- By Revenues in USD Million
- By Quantity Sold in Metric Tons
- Market Segmentation & Growth Outlook
- By Product Type- Market Insights and Forecast 2022-2032, USD Million
- By Livestock- Market Insights and Forecast 2022-2032, USD Million
- By Source- Market Insights and Forecast 2022-2032, USD Million
- By Form- Market Insights and Forecast 2022-2032, USD Million
- By Function- Market Insights and Forecast 2022-2032, USD Million
- Market Size & Growth Outlook
- Italy Feed Prebiotics Market Statistics, 2022-2032F
- Market Size & Growth Outlook
- By Revenues in USD Million
- By Quantity Sold in Metric Tons
- Market Segmentation & Growth Outlook
- By Product Type- Market Insights and Forecast 2022-2032, USD Million
- By Livestock- Market Insights and Forecast 2022-2032, USD Million
- By Source- Market Insights and Forecast 2022-2032, USD Million
- By Form- Market Insights and Forecast 2022-2032, USD Million
- By Function- Market Insights and Forecast 2022-2032, USD Million
- Market Size & Growth Outlook
- Spain Feed Prebiotics Market Statistics, 2022-2032F
- Market Size & Growth Outlook
- By Revenues in USD Million
- By Quantity Sold in Metric Tons
- Market Segmentation & Growth Outlook
- By Product Type- Market Insights and Forecast 2022-2032, USD Million
- By Livestock- Market Insights and Forecast 2022-2032, USD Million
- By Source- Market Insights and Forecast 2022-2032, USD Million
- By Form- Market Insights and Forecast 2022-2032, USD Million
- By Function- Market Insights and Forecast 2022-2032, USD Million
- Market Size & Growth Outlook
- Russia Feed Prebiotics Market Statistics, 2022-2032F
- Market Size & Growth Outlook
- By Revenues in USD Million
- By Quantity Sold in Metric Tons
- Market Segmentation & Growth Outlook
- By Product Type- Market Insights and Forecast 2022-2032, USD Million
- By Livestock- Market Insights and Forecast 2022-2032, USD Million
- By Source- Market Insights and Forecast 2022-2032, USD Million
- By Form- Market Insights and Forecast 2022-2032, USD Million
- By Function- Market Insights and Forecast 2022-2032, USD Million
- Market Size & Growth Outlook
- Market Size & Growth Outlook
- Middle East and Africa Feed Prebiotics Market Statistics, 2022-2032F
- Market Size & Growth Outlook
- By Revenues in USD Million
- By Quantity Sold in Metric Tons
- Market Segmentation & Growth Outlook
- By Product Type- Market Insights and Forecast 2022-2032, USD Million
- By Livestock- Market Insights and Forecast 2022-2032, USD Million
- By Source- Market Insights and Forecast 2022-2032, USD Million
- By Form- Market Insights and Forecast 2022-2032, USD Million
- By Function- Market Insights and Forecast 2022-2032, USD Million
- By Country
- Saudi Arabia
- The UAE
- South Africa
- Egypt
- Rest of Middle East and Africa
- Saudi Arabia Feed Prebiotics Market Statistics, 2022-2032F
- Market Size & Growth Outlook
- By Revenues in USD Million
- By Quantity Sold in Metric Tons
- Market Segmentation & Growth Outlook
- By Product Type- Market Insights and Forecast 2022-2032, USD Million
- By Livestock- Market Insights and Forecast 2022-2032, USD Million
- By Source- Market Insights and Forecast 2022-2032, USD Million
- By Form- Market Insights and Forecast 2022-2032, USD Million
- By Function- Market Insights and Forecast 2022-2032, USD Million
- Market Size & Growth Outlook
- The UAE Feed Prebiotics Market Statistics, 2022-2032F
- Market Size & Growth Outlook
- By Revenues in USD Million
- By Quantity Sold in Metric Tons
- Market Segmentation & Growth Outlook
- By Product Type- Market Insights and Forecast 2022-2032, USD Million
- By Livestock- Market Insights and Forecast 2022-2032, USD Million
- By Source- Market Insights and Forecast 2022-2032, USD Million
- By Form- Market Insights and Forecast 2022-2032, USD Million
- By Function- Market Insights and Forecast 2022-2032, USD Million
- Market Size & Growth Outlook
- South Africa Feed Prebiotics Market Statistics, 2022-2032F
- Market Size & Growth Outlook
- By Revenues in USD Million
- By Quantity Sold in Metric Tons
- Market Segmentation & Growth Outlook
- By Product Type- Market Insights and Forecast 2022-2032, USD Million
- By Livestock- Market Insights and Forecast 2022-2032, USD Million
- By Source- Market Insights and Forecast 2022-2032, USD Million
- By Form- Market Insights and Forecast 2022-2032, USD Million
- By Function- Market Insights and Forecast 2022-2032, USD Million
- Market Size & Growth Outlook
- Egypt Feed Prebiotics Market Statistics, 2022-2032F
- Market Size & Growth Outlook
- By Revenues in USD Million
- By Quantity Sold in Metric Tons
- Market Segmentation & Growth Outlook
- By Product Type- Market Insights and Forecast 2022-2032, USD Million
- By Livestock- Market Insights and Forecast 2022-2032, USD Million
- By Source- Market Insights and Forecast 2022-2032, USD Million
- By Form- Market Insights and Forecast 2022-2032, USD Million
- By Function- Market Insights and Forecast 2022-2032, USD Million
- Market Size & Growth Outlook
- Market Size & Growth Outlook
- Asia Pacific Feed Prebiotics Market Statistics, 2022-2032F
- Market Size & Growth Outlook
- By Revenues in USD Million
- By Quantity Sold in Metric Tons
- Market Segmentation & Growth Outlook
- By Product Type- Market Insights and Forecast 2022-2032, USD Million
- By Livestock- Market Insights and Forecast 2022-2032, USD Million
- By Source- Market Insights and Forecast 2022-2032, USD Million
- By Form- Market Insights and Forecast 2022-2032, USD Million
- By Function- Market Insights and Forecast 2022-2032, USD Million
- By Country
- China
- India
- Japan
- South Korea
- Thailand
- Indonesia
- Vietnam
- Rest of Asia Pacific
- China Feed Prebiotics Market Statistics, 2022-2032F
- Market Size & Growth Outlook
- By Revenues in USD Million
- By Quantity Sold in Metric Tons
- Market Segmentation & Growth Outlook
- By Product Type- Market Insights and Forecast 2022-2032, USD Million
- By Livestock- Market Insights and Forecast 2022-2032, USD Million
- By Source- Market Insights and Forecast 2022-2032, USD Million
- By Form- Market Insights and Forecast 2022-2032, USD Million
- By Function- Market Insights and Forecast 2022-2032, USD Million
- Market Size & Growth Outlook
- India Feed Prebiotics Market Statistics, 2022-2032F
- Market Size & Growth Outlook
- By Revenues in USD Million
- By Quantity Sold in Metric Tons
- Market Segmentation & Growth Outlook
- By Product Type- Market Insights and Forecast 2022-2032, USD Million
- By Livestock- Market Insights and Forecast 2022-2032, USD Million
- By Source- Market Insights and Forecast 2022-2032, USD Million
- By Form- Market Insights and Forecast 2022-2032, USD Million
- By Function- Market Insights and Forecast 2022-2032, USD Million
- Market Size & Growth Outlook
- Japan Feed Prebiotics Market Statistics, 2022-2032F
- Market Size & Growth Outlook
- By Revenues in USD Million
- By Quantity Sold in Metric Tons
- Market Segmentation & Growth Outlook
- By Product Type- Market Insights and Forecast 2022-2032, USD Million
- By Livestock- Market Insights and Forecast 2022-2032, USD Million
- By Source- Market Insights and Forecast 2022-2032, USD Million
- By Form- Market Insights and Forecast 2022-2032, USD Million
- By Function- Market Insights and Forecast 2022-2032, USD Million
- Market Size & Growth Outlook
- South Korea Feed Prebiotics Market Statistics, 2022-2032F
- Market Size & Growth Outlook
- By Revenues in USD Million
- By Quantity Sold in Metric Tons
- Market Segmentation & Growth Outlook
- By Product Type- Market Insights and Forecast 2022-2032, USD Million
- By Livestock- Market Insights and Forecast 2022-2032, USD Million
- By Source- Market Insights and Forecast 2022-2032, USD Million
- By Form- Market Insights and Forecast 2022-2032, USD Million
- By Function- Market Insights and Forecast 2022-2032, USD Million
- Market Size & Growth Outlook
- Thailand Feed Prebiotics Market Statistics, 2022-2032F
- Market Size & Growth Outlook
- By Revenues in USD Million
- By Quantity Sold in Metric Tons
- Market Segmentation & Growth Outlook
- By Product Type- Market Insights and Forecast 2022-2032, USD Million
- By Livestock- Market Insights and Forecast 2022-2032, USD Million
- By Source- Market Insights and Forecast 2022-2032, USD Million
- By Form- Market Insights and Forecast 2022-2032, USD Million
- By Function- Market Insights and Forecast 2022-2032, USD Million
- Market Size & Growth Outlook
- Indonesia Feed Prebiotics Market Statistics, 2022-2032F
- Market Size & Growth Outlook
- By Revenues in USD Million
- By Quantity Sold in Metric Tons
- Market Segmentation & Growth Outlook
- By Product Type- Market Insights and Forecast 2022-2032, USD Million
- By Livestock- Market Insights and Forecast 2022-2032, USD Million
- By Source- Market Insights and Forecast 2022-2032, USD Million
- By Form- Market Insights and Forecast 2022-2032, USD Million
- By Function- Market Insights and Forecast 2022-2032, USD Million
- Market Size & Growth Outlook
- Vietnam Feed Prebiotics Market Statistics, 2022-2032F
- Market Size & Growth Outlook
- By Revenues in USD Million
- By Quantity Sold in Metric Tons
- Market Segmentation & Growth Outlook
- By Product Type- Market Insights and Forecast 2022-2032, USD Million
- By Livestock- Market Insights and Forecast 2022-2032, USD Million
- By Source- Market Insights and Forecast 2022-2032, USD Million
- By Form- Market Insights and Forecast 2022-2032, USD Million
- By Function- Market Insights and Forecast 2022-2032, USD Million
- Market Size & Growth Outlook
- Market Size & Growth Outlook
- Competitive Outlook
- Company Profiles
- Alltech Inc. (Bio-Mos)
- Business Description
- Product Portfolio
- Collaborations & Alliances
- Recent Developments
- Financial Details
- Others
- Archer Daniels Midland Company
- Business Description
- Product Portfolio
- Collaborations & Alliances
- Recent Developments
- Financial Details
- Others
- DSM-Firmenich AG (Levabon)
- Business Description
- Product Portfolio
- Collaborations & Alliances
- Recent Developments
- Financial Details
- Others
- BENEO GmbH
- Business Description
- Product Portfolio
- Collaborations & Alliances
- Recent Developments
- Financial Details
- Others
- TEREOS GROUP (Tereos Starch & Sweeteners Europe)
- Business Description
- Product Portfolio
- Collaborations & Alliances
- Recent Developments
- Financial Details
- Others
- Phileo by Lesaffre (Safmannan)
- Business Description
- Product Portfolio
- Collaborations & Alliances
- Recent Developments
- Financial Details
- Others
- 2
- Business Description
- Product Portfolio
- Collaborations & Alliances
- Recent Developments
- Financial Details
- Others
- Lallemand Inc. (OPTIWALL)
- Business Description
- Product Portfolio
- Collaborations & Alliances
- Recent Developments
- Financial Details
- Others
- Purina Animal Nutrition LLC (Land O Lakes)
- Business Description
- Product Portfolio
- Collaborations & Alliances
- Recent Developments
- Financial Details
- Others
- AB Agri Limited (AB Vista)
- Business Description
- Product Portfolio
- Collaborations & Alliances
- Recent Developments
- Financial Details
- Others
- COSUCRA Groupe Warcoing S.A. (COSUCRA ANIMAL NUTRITION)
- Business Description
- Product Portfolio
- Collaborations & Alliances
- Recent Developments
- Financial Details
- Others
- Ingredion Incorporated
- Business Description
- Product Portfolio
- Collaborations & Alliances
- Recent Developments
- Financial Details
- Others
- Ohly GmbH
- Business Description
- Product Portfolio
- Collaborations & Alliances
- Recent Developments
- Financial Details
- Others
- AngelYeast Co. Ltd.
- Business Description
- Product Portfolio
- Collaborations & Alliances
- Recent Developments
- Financial Details
- Others
- Kemin Industries Inc. (Aleta)
- Business Description
- Product Portfolio
- Collaborations & Alliances
- Recent Developments
- Financial Details
- Others
- Alltech Inc. (Bio-Mos)
- Company Profiles
- Disclaimer
| Segment | Sub-Segment |
|---|---|
| By Product Type |
|
| By Livestock |
|
| By Source |
|
| By Form |
|
| By Function |
|
| By Region |
|
Research Methodology
This study followed a structured approach comprising four key phases to assess the size and scope of the electro-oxidation market. The process began with thorough secondary research to collect data on the target market, related markets, and broader industry context. These findings, along with preliminary assumptions and estimates, were then validated through extensive primary research involving industry experts from across the value chain. To calculate the overall market size, both top-down and bottom-up methodologies were employed. Finally, market segmentation and data triangulation techniques were applied to refine and validate segment-level estimations.
Secondary Research
The secondary research phase involved gathering data from a wide range of credible and published sources. This step helped in identifying industry trends, defining market segmentation, and understanding the market landscape and value chain.
Sources consulted during this phase included:
- Company annual reports, investor presentations, and press releases
- Industry white papers and certified publications
- Trade directories and market-recognized databases
- Articles from authoritative authors and reputable journals
- Gold and silver standard websites
Secondary research was critical in mapping out the industry's value chain and monetary flow, identifying key market segments, understanding regional variations, and tracking significant industry developments.
Other key sources:
- Financial disclosures
- Industry associations and trade bodies
- News outlets and business magazines
- Academic journals and research studies
- Paid industry databases
Primary Research
To validate secondary data and gain deeper market insights, primary research was conducted with key stakeholders across both the supply and demand sides of the market.
On the demand side, participants included decision-makers and influencers from end-user industries—such as CIOs, CTOs, and CSOs—who provided first-hand perspectives on market needs, product usage, and future expectations.
On the supply side, interviews were conducted with manufacturers, industry associations, and institutional participants to gather insights into current offerings, product pipelines, and market challenges.
Primary interviews provided critical inputs such as:
- Market size and revenue data
- Product and service breakdowns
- Market forecasts
- Regional and application-specific trends
Stakeholders consulted included:
- Leading OEM and solution providers
- Channel and distribution partners
- End users across various applications
- Independent consultants and industry specialists
Market Size Estimation and Data Triangulation
- Identifying Key Market Participants (Secondary Research)
- Goal: To identify the major players or companies in the target market. This typically involves using publicly available data sources such as industry reports, market research publications, and financial statements of companies.
- Tools: Reports from firms like Gartner, Forrester, Euromonitor, Statista, IBISWorld, and others. Public financial statements, news articles, and press releases from top market players.
- Extracting Earnings of Key Market Participants
- Goal: To estimate the earnings generated from the product or service being analyzed. This step helps in understanding the revenue potential of each market player in a specific geography.
- Methods: Earnings data can be gathered from:
- Publicly available financial reports (for listed companies).
- Interviews and primary data sources from professionals, such as Directors, VPs, SVPs, etc. This is especially useful for understanding more nuanced, internal data that isn't publicly disclosed.
- Annual reports and investor presentations of key players.
- Data Collation and Development of a Relevant Data Model
- Goal: To collate inputs from both primary and secondary sources into a structured, data-driven model for market estimation. This model will incorporate key market KPIs and any independent variables relevant to the market.
- Key KPIs: These could include:
- Market size, growth rate, and demand drivers.
- Industry-specific metrics like market share, average revenue per customer (ARPC), or average deal size.
- External variables, such as economic growth rates, inflation rates, or commodity prices, that could affect the market.
- Data Modeling: Based on this data, the market forecasts are developed for the next 5 years. A combination of trend analysis, scenario modeling, and statistical regression might be used to generate projections.
- Scenario Analysis
- Goal: To test different assumptions and validate how sensitive the market is to changes in key variables (e.g., market demand, regulatory changes, technological disruptions).
- Types of Scenarios:
- Base Case: Based on current assumptions and historical data.
- Best-Case Scenario: Assuming favorable market conditions, regulatory environments, and technological advancements.
- Worst-Case Scenario: Accounting for adverse factors, such as economic downturns, stricter regulations, or unexpected disruptions.


