US Data Center Maintenance & Support Services Market Report: Trends, Growth and Forecast (2026-2032)
By Service Type (Preventive & Predictive Maintenance Services, Corrective & Emergency Support Services, Remote & On-site Support Services, Lifecycle, Parts & Compliance Support Services, Managed Operations Services), By Supported Infrastructure (Power Infrastructure, Cooling Infrastructure, IT Infrastructure, Monitoring & Control Systems, Physical Security & Safety Systems), By Data Center Type (Enterprise Data Centers, Colocation Data Centers, Cloud/Hyperscale Data Centers, Edge/Modular Data Centers), By Tier Type (Tier I & Tier II, Tier III, Tier IV), By End User (IT & Telecommunications, BFSI, Government & Defense, Healthcare, Retail & E-commerce, Manufacturing, Energy & Utilities, Others), By Contract Type (Warranty & Post-Warranty Support, Comprehensive/Full-Service Contracts, Limited-Service Contracts, Time-and-Material/Ad Hoc Support, SLA-based Managed Support Contracts, Multi-Year Outsourced O&M Contracts), By Service Provider Type (OEM/Manufacturer Support Providers, Third-Party Maintenance Providers, Multi-Vendor Support Providers, System Integrators/IT Infrastructure Service Providers, Colocation Operator-led Support Providers, Specialized Critical Facility O&M Providers), By Data Center Size (Small Data Centers, Medium Data Centers, Large Data Centers, Hyperscale Facilities), By Region (West, Midwest, South, North, Northeast) ... Read more
|
Major Players
|
US Data Center Maintenance & Support Services Market Statistics and Insights, 2026
- Market Size Statistics
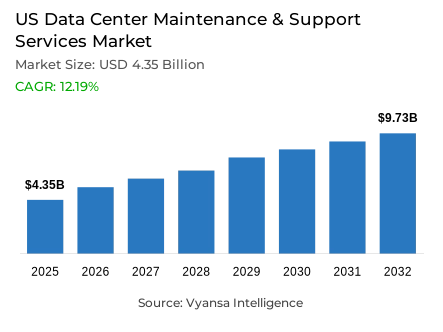
- Data center maintenance & support services market size in US was valued at USD 4.35 billion in 2025 and is estimated at USD 4.88 billion in 2026.
- The market size is expected to grow to USD 9.73 billion by 2032.
- Market to register a CAGR of around 12.19% during 2026-32.
- Service Type Shares
- Managed operations services grabbed market share of 30%.
- Competition
- More than 10 companies are actively engaged in producing data center maintenance & support services in US.
- Top 5 companies acquired around 45% of the market share.
- IBM, Kyndryl, Vertiv Holdings, Cisco Systems, Amazon Web Services (AWS) etc., are few of the top companies.
- Supported Infrastructure
- Power infrastructure grabbed 30% of the market.
US Data Center Maintenance & Support Services Market Outlook
The US data center maintenance & support services market was valued at USD 4.35 billion in 2025, establishing a commercially resilient and operationally grounded foundation within the world's most advanced digital infrastructure ecosystem. Projected to advance from USD 4.88 billion in 2026 to USD 9.73 billion by 2032, the sector registers a compound annual growth rate of 12.19% across the forecast horizon. This near doubling of market value reflects a genuine structural shift in how data center operators approach facility managementone where rising infrastructure complexity, heavier power loads, and tighter uptime obligations are collectively elevating maintenance and support from a controllable operational line item into a strategically non negotiable service investment. The market's growth is anchored in operational necessity, which gives it a degree of commercial resilience that purely technology driven categories rarely sustain over a comparable forecast window.
The commercial structure of this market is defined by a pronounced and durable concentration around power infrastructure systems. Power infrastructure commands approximately 30% of total supported infrastructure market sharea position that reflects the foundational role of electrical continuity in sustaining facility wide performance across compute, cooling, and connectivity layers simultaneously. US data centers consumed approximately 176 TWh of electricity in 2023, rising sharply from 58 TWh in 2014 and representing roughly 4.4% of total national electricity use as documented by the Department of Energy. This trajectory of escalating energy intensity creates a direct and measurable expansion in power infrastructure maintenance requirementssustaining disproportionate service investment concentration within this category across enterprise and hyperscale facility segments alike.
The workforce architecture underpinning service delivery in this market reflects the multi disciplinary technical complexity that separates data center maintenance from conventional facilities management. Effective support operations require simultaneous competency across electrical systems, thermal management, and digital network troubleshootinga combination whose specialist labor cost structure shapes service economics at every contract tier. HVAC technicians hold approximately 425,200 jobs nationally at a median annual wage of USD 59,810, while electrical and electronics installers and repairers earn USD 71,270 and computer network support specialists record USD 73,340 as of May 2024. These wage levels confirm that skilled workforce retention functions as both a structural cost driver and a genuine competitive differentiator for providers competing on technical depth and response consistency.
The forward outlook through 2032 is shaped by four structural forces operating in sustained convergence. US electricity demand is growing at approximately 1.7% annually between 2020 and 2025a meaningful acceleration from the 0.1% annual rate recorded between 2005 and 2019with data centers identified by the EIA as a primary acceleration driver. The DOE's updated 2024 best practices guidance now covers high density and liquid cooled facility configurations alongside traditional air systems, reflecting a technical evolution that is progressively raising the specialization threshold for credible maintenance service delivery. The White House's July 2025 framework extending loans, grants, tax incentives, and expedited permitting to qualifying projects requiring more than 100 megawatts of new load confirms that large scale facility expansion will sustain substantial long duration maintenance contract opportunities. These converging forces define a commercial environment that consistently rewards providers with deep power infrastructure expertise, multi disciplinary workforce capability, and the operational scale to serve the market's most demanding hyperscale environments through 2032.

US Data Center Maintenance & Support Services Market Growth Driver
Surging Data Center Power Consumption Elevates Infrastructure Maintenance Requirements
The sustained and institutionally documented escalation of electricity consumption across US data center facilities represents the primary structural driver of maintenance and support services demandfunctioning as a direct and measurable demand generation mechanism that expands the scale, complexity, and frequency of power infrastructure servicing requirements across every facility category simultaneously. As computational workloads intensify and facility power densities advance toward hyperscale configurations, the operational burden on power distribution, backup, and conditioning systems compounds continuously making preventive maintenance, real time performance monitoring, and rapid fault response progressively more essential to operators whose uptime commitments leave minimal tolerance for electrical system performance degradation.
The quantitative momentum of this power driven demand dynamic is documented with precision by the Department of Energy and the Energy Information Administration. US data centers consumed approximately 176 TWh of electricity in 2023 rising sharply from 58 TWh in 2014 and representing roughly 4.4% of total national electricity consumption confirming a load growth trajectory whose maintenance service implications are direct and structurally compounding across the forecast period. The EIA further documents that US electricity demand is growing at approximately 1.7% annually between 2020 and 2025, compared with just 0.1% annually between 2005 and 2019, with data centers identified as a primary acceleration driver. This demand growth rate confirms that the power infrastructure maintenance opportunity is expanding faster than the broader energy marketsustaining consistent service volume growth and elevating the commercial importance of power systems expertise across the US maintenance and support services ecosystem through 2032.
US Data Center Maintenance & Support Services Market Challenge
Multi-Skilled Workforce Requirements Constrain Service Scalability
The specialized and multi disciplinary workforce requirements of data center maintenance and support operations represent the most consequential structural challenge confronting service providers seeking to scale delivery capability in line with growing facility infrastructure complexity. Unlike conventional facilities management, data center maintenance demands simultaneous technical competency across electrical power systems, thermal and cooling infrastructure, and digital network troubleshootinga combination of specialist skills whose labor market scarcity, wage premium requirements, and continuous training obligations create persistent workforce supply constraints that moderate service capacity expansion and elevate cost structures across the industry's most technically demanding contract categories.
The structural depth and wage level specificity of this workforce challenge are quantified with precision by the US Bureau of Labor Statistics. HVAC technicians hold approximately 425,200 jobs nationally at a median annual wage of USD 59,810, while electrical and electronics installers and repairers earn a median annual wage of USD 71,270confirming the significant labor cost investment that power and cooling infrastructure maintenance capability requires at scale. Computer network support specialists record a median annual wage of USD 73,340 as of May 2024, reflecting the additional cost tier associated with digital infrastructure troubleshooting competency. The multi skill premium created by the intersection of these three specialist labor categories means that comprehensive workforce development demands sustained investment in recruitment, retention, and continuous technical trainingobligations that create meaningful operational cost pressure and scalability constraints for service providers competing on both quality and price through 2032.
Unlock Market Intelligence
Explore the market potential with our data-driven report
US Data Center Maintenance & Support Services Market Trend
Efficiency-Led Cooling Evolution Reshapes Maintenance Service Specialization
The progressive transition of US data center cooling infrastructure from conventional air based systems toward higher efficiency and liquid cooled configurations represents a defining structural trendreshaping the technical specialization requirements, service delivery methodologies, and workforce capability investments that determine competitive positioning within the maintenance and support services market. This cooling evolution is being driven by the escalating rack power densities associated with AI and high performance compute workloadswhose thermal output intensity exceeds the practical management capacity of traditional air cooling approaches and demands purpose built liquid cooling infrastructure whose maintenance requirements are fundamentally distinct from those of legacy mechanical systems.
The technical specificity and current deployment scale of this cooling transition are documented with authority by the Department of Energy. The DOE's updated 2024 best practices guidance now spans IT systems, air management, cooling, electrical systems, and heat recoveryexplicitly incorporating cutting edge facilities with higher rack power densities and liquid cooling, confirming that efficiency led cooling design has moved from emerging practice into mainstream facility architecture. DOE Better Buildings materials from 2025 further confirm that air cooling still dominates approximately 90% of existing non AI hyperscale and colocation facilitieseven as higher density compute increasingly requires liquid cooling at the chip levelestablishing a transitional mixed cooling environment whose simultaneous support requirements are expanding the technical scope of maintenance service delivery. Providers that build demonstrated liquid cooling maintenance capability alongside established air system expertise will be positioned to capture the full spectrum of this evolving service opportunity through 2032.
US Data Center Maintenance & Support Services Market Opportunity
Policy-Backed Infrastructure Expansion Creates Durable Long-Duration Contract Headroom
The comprehensive federal policy and program support framework deployed to enable large scale data center infrastructure development across the United States creates a structurally significant and commercially durable opportunity for maintenance and support service providers delivering a policy amplified demand expansion dynamic whose investment scale and project timeline visibility substantially exceed those generated by organic market growth alone. This policy opportunity is distinguished by its operational specificity: support frameworks targeting facilities with new power loads exceeding 100 megawatts directly identify the facility scale at which long duration, high value maintenance and support contracts become commercially most attractivecreating a natural alignment between federal infrastructure investment incentives and the service contract pipeline of the maintenance industry's most commercially significant customer segment.
The quantitative scale and programmatic breadth of this policy opportunity are documented with authority by the Department of Energy and the White House. The DOE maintains over 30 programs available to support data center energy needscovering clean energy deployment, grid enhancement, efficiency optimization, demand flexibility, and technical assistancecreating a multi pathway policy support architecture that sustains facility investment momentum across diverse operator types and geographic markets. The White House's July 2025 fact sheet defines qualifying projects to include data centers and related infrastructure requiring more than 100 megawatts of new electrical loadgranting access to loans, grants, tax incentives, and expedited permitting pathways that accelerate facility development timelines and compress the interval between investment commitment and active maintenance contract generation. Service providers that align their capabilities, compliance infrastructure, and long term capacity investment with this policy supported expansion pipeline will capture disproportionate value from the US market's most structurally guaranteed infrastructure growth opportunity through 2032.
Unlock Market Intelligence
Explore the market potential with our data-driven report
US Data Center Maintenance & Support Services Market Segmentation Analysis
By Service Type
- Preventive & Predictive Maintenance Services
- Corrective & Emergency Support Services
- Remote & On-site Support Services
- Lifecycle, Parts & Compliance Support Services
- Managed Operations Services
The segment has the highest share around managed operations services under the service type category, accounting for 30% of the overall share. This leading position reflects the growing preference for services that help operators manage day to day data center functions more efficiently. As facilities become more complex and uptime expectations remain high, many end users rely on managed service support to handle routine operations, monitoring, and performance management in a more structured way.
The strong position of this segment also shows that businesses increasingly value service models that reduce operational burden and improve continuity. Managed Operations Services remain important because they support smoother workflows, faster issue handling, and better resource utilization across data center environments. This keeps the segment at the forefront of the service mix and strengthens its role in long term operational support.

By Supported Infrastructure
- Power Infrastructure
- Cooling Infrastructure
- IT Infrastructure
- Monitoring & Control Systems
- Physical Security & Safety Systems
The segment with highest market share under the supported infrastructure is power infrastructure, accounting for approximately 30% of the total market. This leading position reflects a straightforward operational realityelectrical continuity is the single most consequential performance variable across every data center facility type, where power system failures cascade immediately into compute interruption, cooling failure, and service level breach across every dependent infrastructure layer simultaneously. With nearly one third of total market value concentrated within a single infrastructure category, power infrastructure defines the service investment priorities, risk management frameworks, and technical capability benchmarks of the US data center maintenance and support services market. Its commercial dominance confirms that operators consistently direct disproportionate maintenance budget toward the infrastructure layer whose failure consequences are the most immediate, the most operationally broad, and the most commercially damaging.
The structural leadership of power infrastructure is being actively intensified by the sustained escalation of electrical load density across US data center facilities. The DOE's documentation of data center electricity consumption rising from 58 TWh in 2014 to approximately 176 TWh in 2023 confirms a load growth trajectory that is simultaneously expanding the scale of power systems requiring active maintenance oversight and elevating the technical complexity of backup readiness, load balancing, and electrical continuity management across mission critical environments. As hyperscale and AI linked compute facilities push individual site power requirements beyond the 100 megawatt thresholdqualifying them for accelerated federal support under the White House's July 2025 frameworkthe power infrastructure maintenance obligations per facility are expanding at a pace that structurally reinforces the segment's market share leadership. Power Infrastructure's position as the dominant commercial priority within US data center maintenance planning is expected to deepen through 2032.
List of Companies Covered in US Data Center Maintenance & Support Services Market
The companies listed below are highly influential in the US data center maintenance & support services market, with a significant market share and a strong impact on industry developments.
- IBM
- Kyndryl
- Vertiv Holdings
- Cisco Systems
- Amazon Web Services (AWS)
- Google Cloud
- Dell Technologies
- Hewlett Packard Enterprise
- Schneider Electric
- Service Express
Market News & Updates
- Vertiv Holdings, 2026:
In January 2026, Vertiv launched Vertiv Next Predict, an AI-powered managed service designed to shift data center maintenance from time-based and reactive service toward predictive maintenance by analyzing asset behavior before failures occur; the company says the offer is aimed at modern data centers and AI factories and builds on Vertiv’s installed base of critical power and thermal infrastructure, while Vertiv’s February 2026 results also pointed to continued strong momentum in the data center market. For the US data center maintenance and support services market, this is a major product-and-service development because it raises the bar for uptime-focused support, encourages operators to adopt condition-based service models, and increases competitive pressure on maintenance providers that still rely mainly on scheduled or break-fix support.
- Kyndryl, 2026:
In April 2026, New York-based Kyndryl launched Agentic Service Management, describing it as a new offering that combines a maturity model, structured assessments, and implementation blueprints to help enterprises move from traditional service operations to autonomous, intelligent workflows at scale; Kyndryl positioned the launch as part of its push to power AI-native infrastructure services, and its official materials continue to emphasize managed services for infrastructure, cloud, and data-center environments. For the US data center maintenance and support services market, this matters because it shows a leading infrastructure services provider is embedding AI-led automation into service operations, which can improve incident response, reduce manual support workloads, and accelerate the shift from labor-intensive support contracts toward more intelligent, outcome-based maintenance models.
Frequently Asked Questions
Related Report
- Market Segmentation
- Research Scope
- Research Methodology
- Definitions and Assumptions
- Executive Summary
- US Data Center Maintenance & Support Services Market Policies, Regulations, and Standards
- US Data Center Maintenance & Support Services Market Dynamics
- Growth Factors
- Challenges
- Trends
- Opportunities
- US Data Center Maintenance & Support Services Market Statistics, 2022-2032F
- Market Size & Growth Outlook
- By Revenues in USD Million
- Market Segmentation & Growth Outlook
- By Service Type
- Preventive & Predictive Maintenance Services- Market Insights and Forecast 2022-2032, USD Million
- Corrective & Emergency Support Services- Market Insights and Forecast 2022-2032, USD Million
- Remote & On-site Support Services- Market Insights and Forecast 2022-2032, USD Million
- Lifecycle, Parts & Compliance Support Services- Market Insights and Forecast 2022-2032, USD Million
- Managed Operations Services- Market Insights and Forecast 2022-2032, USD Million
- By Supported Infrastructure
- Power Infrastructure- Market Insights and Forecast 2022-2032, USD Million
- Cooling Infrastructure- Market Insights and Forecast 2022-2032, USD Million
- IT Infrastructure- Market Insights and Forecast 2022-2032, USD Million
- Monitoring & Control Systems- Market Insights and Forecast 2022-2032, USD Million
- Physical Security & Safety Systems- Market Insights and Forecast 2022-2032, USD Million
- By Data Center Type
- Enterprise Data Centers- Market Insights and Forecast 2022-2032, USD Million
- Colocation Data Centers- Market Insights and Forecast 2022-2032, USD Million
- Cloud/Hyperscale Data Centers- Market Insights and Forecast 2022-2032, USD Million
- Edge/Modular Data Centers- Market Insights and Forecast 2022-2032, USD Million
- By Tier Type
- Tier I & Tier II- Market Insights and Forecast 2022-2032, USD Million
- Tier III- Market Insights and Forecast 2022-2032, USD Million
- Tier IV- Market Insights and Forecast 2022-2032, USD Million
- By End User
- IT & Telecommunications- Market Insights and Forecast 2022-2032, USD Million
- BFSI- Market Insights and Forecast 2022-2032, USD Million
- Government & Defense- Market Insights and Forecast 2022-2032, USD Million
- Healthcare- Market Insights and Forecast 2022-2032, USD Million
- Retail & E-commerce- Market Insights and Forecast 2022-2032, USD Million
- Manufacturing- Market Insights and Forecast 2022-2032, USD Million
- Energy & Utilities- Market Insights and Forecast 2022-2032, USD Million
- Others- Market Insights and Forecast 2022-2032, USD Million
- By Contract Type
- Warranty & Post-Warranty Support- Market Insights and Forecast 2022-2032, USD Million
- Comprehensive/Full-Service Contracts- Market Insights and Forecast 2022-2032, USD Million
- Limited-Service Contracts- Market Insights and Forecast 2022-2032, USD Million
- Time-and-Material/Ad Hoc Support- Market Insights and Forecast 2022-2032, USD Million
- SLA-based Managed Support Contracts- Market Insights and Forecast 2022-2032, USD Million
- Multi-Year Outsourced O&M Contracts- Market Insights and Forecast 2022-2032, USD Million
- By Service Provider Type
- OEM/Manufacturer Support Providers- Market Insights and Forecast 2022-2032, USD Million
- Third-Party Maintenance Providers- Market Insights and Forecast 2022-2032, USD Million
- Multi-Vendor Support Providers- Market Insights and Forecast 2022-2032, USD Million
- System Integrators/IT Infrastructure Service Providers- Market Insights and Forecast 2022-2032, USD Million
- Colocation Operator-led Support Providers- Market Insights and Forecast 2022-2032, USD Million
- Specialized Critical Facility O&M Providers- Market Insights and Forecast 2022-2032, USD Million
- By Data Center Size
- Small Data Centers- Market Insights and Forecast 2022-2032, USD Million
- Medium Data Centers- Market Insights and Forecast 2022-2032, USD Million
- Large Data Centers- Market Insights and Forecast 2022-2032, USD Million
- Hyperscale Facilities- Market Insights and Forecast 2022-2032, USD Million
- By Region
- West
- Midwest
- South
- North
- Northeast
- By Competitors
- Competition Characteristics
- Market Share & Analysis
- By Service Type
- Market Size & Growth Outlook
- US Preventive & Predictive Maintenance Services Market Statistics, 2022-2032
- Market Size & Growth Outlook
- By Revenues in USD Million
- Market Segmentation & Growth Outlook
- By Supported Infrastructure- Market Insights and Forecast 2022-2032, USD Million
- By Data Center Type- Market Insights and Forecast 2022-2032, USD Million
- By Tier Type- Market Insights and Forecast 2022-2032, USD Million
- By End User- Market Insights and Forecast 2022-2032, USD Million
- By Contract Type- Market Insights and Forecast 2022-2032, USD Million
- By Service Provider Type- Market Insights and Forecast 2022-2032, USD Million
- By Data Center Size- Market Insights and Forecast 2022-2032, USD Million
- By Region- Market Insights and Forecast 2022-2032, USD Million
- Market Size & Growth Outlook
- US Corrective & Emergency Support Services Market Statistics, 2022-2032
- Market Size & Growth Outlook
- By Revenues in USD Million
- Market Segmentation & Growth Outlook
- By Supported Infrastructure- Market Insights and Forecast 2022-2032, USD Million
- By Data Center Type- Market Insights and Forecast 2022-2032, USD Million
- By Tier Type- Market Insights and Forecast 2022-2032, USD Million
- By End User- Market Insights and Forecast 2022-2032, USD Million
- By Contract Type- Market Insights and Forecast 2022-2032, USD Million
- By Service Provider Type- Market Insights and Forecast 2022-2032, USD Million
- By Data Center Size- Market Insights and Forecast 2022-2032, USD Million
- By Region- Market Insights and Forecast 2022-2032, USD Million
- Market Size & Growth Outlook
- US Remote & On-site Support Services Market Statistics, 2022-2032
- Market Size & Growth Outlook
- By Revenues in USD Million
- Market Segmentation & Growth Outlook
- By Supported Infrastructure- Market Insights and Forecast 2022-2032, USD Million
- By Data Center Type- Market Insights and Forecast 2022-2032, USD Million
- By Tier Type- Market Insights and Forecast 2022-2032, USD Million
- By End User- Market Insights and Forecast 2022-2032, USD Million
- By Contract Type- Market Insights and Forecast 2022-2032, USD Million
- By Service Provider Type- Market Insights and Forecast 2022-2032, USD Million
- By Data Center Size- Market Insights and Forecast 2022-2032, USD Million
- By Region- Market Insights and Forecast 2022-2032, USD Million
- Market Size & Growth Outlook
- US Lifecycle, Parts & Compliance Support Services Market Statistics, 2022-2032
- Market Size & Growth Outlook
- By Revenues in USD Million
- Market Segmentation & Growth Outlook
- By Supported Infrastructure- Market Insights and Forecast 2022-2032, USD Million
- By Data Center Type- Market Insights and Forecast 2022-2032, USD Million
- By Tier Type- Market Insights and Forecast 2022-2032, USD Million
- By End User- Market Insights and Forecast 2022-2032, USD Million
- By Contract Type- Market Insights and Forecast 2022-2032, USD Million
- By Service Provider Type- Market Insights and Forecast 2022-2032, USD Million
- By Data Center Size- Market Insights and Forecast 2022-2032, USD Million
- By Region- Market Insights and Forecast 2022-2032, USD Million
- Market Size & Growth Outlook
- US Managed Operations Services Market Statistics, 2022-2032
- Market Size & Growth Outlook
- By Revenues in USD Million
- Market Segmentation & Growth Outlook
- By Supported Infrastructure- Market Insights and Forecast 2022-2032, USD Million
- By Data Center Type- Market Insights and Forecast 2022-2032, USD Million
- By Tier Type- Market Insights and Forecast 2022-2032, USD Million
- By End User- Market Insights and Forecast 2022-2032, USD Million
- By Contract Type- Market Insights and Forecast 2022-2032, USD Million
- By Service Provider Type- Market Insights and Forecast 2022-2032, USD Million
- By Data Center Size- Market Insights and Forecast 2022-2032, USD Million
- By Region- Market Insights and Forecast 2022-2032, USD Million
- Market Size & Growth Outlook
- Competitive Outlook
- Company Profiles
- Cisco Systems
- Business Description
- Product Portfolio
- Collaborations & Alliances
- Recent Developments
- Financial Details
- Others
- Amazon Web Services (AWS)
- Business Description
- Product Portfolio
- Collaborations & Alliances
- Recent Developments
- Financial Details
- Others
- Google Cloud
- Business Description
- Product Portfolio
- Collaborations & Alliances
- Recent Developments
- Financial Details
- Others
- Dell Technologies
- Business Description
- Product Portfolio
- Collaborations & Alliances
- Recent Developments
- Financial Details
- Others
- Hewlett Packard Enterprise
- Business Description
- Product Portfolio
- Collaborations & Alliances
- Recent Developments
- Financial Details
- Others
- IBM
- Business Description
- Product Portfolio
- Collaborations & Alliances
- Recent Developments
- Financial Details
- Others
- Kyndryl
- Business Description
- Product Portfolio
- Collaborations & Alliances
- Recent Developments
- Financial Details
- Others
- Vertiv Holdings
- Business Description
- Product Portfolio
- Collaborations & Alliances
- Recent Developments
- Financial Details
- Others
- Schneider Electric
- Business Description
- Product Portfolio
- Collaborations & Alliances
- Recent Developments
- Financial Details
- Others
- Service Express
- Business Description
- Product Portfolio
- Collaborations & Alliances
- Recent Developments
- Financial Details
- Others
- Cisco Systems
- Company Profiles
- Disclaimer
| Segment | Sub-Segment |
|---|---|
| By Service Type |
|
| By Supported Infrastructure |
|
| By Data Center Type |
|
| By Tier Type |
|
| By End User |
|
| By Contract Type |
|
| By Service Provider Type |
|
| By Data Center Size |
|
| By Region |
|
Research Methodology
This study followed a structured approach comprising four key phases to assess the size and scope of the electro-oxidation market. The process began with thorough secondary research to collect data on the target market, related markets, and broader industry context. These findings, along with preliminary assumptions and estimates, were then validated through extensive primary research involving industry experts from across the value chain. To calculate the overall market size, both top-down and bottom-up methodologies were employed. Finally, market segmentation and data triangulation techniques were applied to refine and validate segment-level estimations.
Secondary Research
The secondary research phase involved gathering data from a wide range of credible and published sources. This step helped in identifying industry trends, defining market segmentation, and understanding the market landscape and value chain.
Sources consulted during this phase included:
- Company annual reports, investor presentations, and press releases
- Industry white papers and certified publications
- Trade directories and market-recognized databases
- Articles from authoritative authors and reputable journals
- Gold and silver standard websites
Secondary research was critical in mapping out the industry's value chain and monetary flow, identifying key market segments, understanding regional variations, and tracking significant industry developments.
Other key sources:
- Financial disclosures
- Industry associations and trade bodies
- News outlets and business magazines
- Academic journals and research studies
- Paid industry databases
Primary Research
To validate secondary data and gain deeper market insights, primary research was conducted with key stakeholders across both the supply and demand sides of the market.
On the demand side, participants included decision-makers and influencers from end-user industries—such as CIOs, CTOs, and CSOs—who provided first-hand perspectives on market needs, product usage, and future expectations.
On the supply side, interviews were conducted with manufacturers, industry associations, and institutional participants to gather insights into current offerings, product pipelines, and market challenges.
Primary interviews provided critical inputs such as:
- Market size and revenue data
- Product and service breakdowns
- Market forecasts
- Regional and application-specific trends
Stakeholders consulted included:
- Leading OEM and solution providers
- Channel and distribution partners
- End users across various applications
- Independent consultants and industry specialists
Market Size Estimation and Data Triangulation
- Identifying Key Market Participants (Secondary Research)
- Goal: To identify the major players or companies in the target market. This typically involves using publicly available data sources such as industry reports, market research publications, and financial statements of companies.
- Tools: Reports from firms like Gartner, Forrester, Euromonitor, Statista, IBISWorld, and others. Public financial statements, news articles, and press releases from top market players.
- Extracting Earnings of Key Market Participants
- Goal: To estimate the earnings generated from the product or service being analyzed. This step helps in understanding the revenue potential of each market player in a specific geography.
- Methods: Earnings data can be gathered from:
- Publicly available financial reports (for listed companies).
- Interviews and primary data sources from professionals, such as Directors, VPs, SVPs, etc. This is especially useful for understanding more nuanced, internal data that isn't publicly disclosed.
- Annual reports and investor presentations of key players.
- Data Collation and Development of a Relevant Data Model
- Goal: To collate inputs from both primary and secondary sources into a structured, data-driven model for market estimation. This model will incorporate key market KPIs and any independent variables relevant to the market.
- Key KPIs: These could include:
- Market size, growth rate, and demand drivers.
- Industry-specific metrics like market share, average revenue per customer (ARPC), or average deal size.
- External variables, such as economic growth rates, inflation rates, or commodity prices, that could affect the market.
- Data Modeling: Based on this data, the market forecasts are developed for the next 5 years. A combination of trend analysis, scenario modeling, and statistical regression might be used to generate projections.
- Scenario Analysis
- Goal: To test different assumptions and validate how sensitive the market is to changes in key variables (e.g., market demand, regulatory changes, technological disruptions).
- Types of Scenarios:
- Base Case: Based on current assumptions and historical data.
- Best-Case Scenario: Assuming favorable market conditions, regulatory environments, and technological advancements.
- Worst-Case Scenario: Accounting for adverse factors, such as economic downturns, stricter regulations, or unexpected disruptions.


