US Anti-Aging Products Market Report: Trends, Growth and Forecast (2026-2032)
By Product Type (Creams & Moisturizers, Serums, Sunscreens/SPF Day Creams, Exfoliators/Peels, Masks, Targeted Treatments/Spot Correctors), By Claim/Benefit Type (Wrinkle & Fine-Line Reduction, Firming/Lifting Appearance, Hydration/Plumping, Brightening/Age-Spot Correction, Barrier Repair/Sensitive Mature Skin, Sun Protection/Photoaging Prevention), By Sales Channel (Retail Offline (Supermarkets/Hypermarkets, Pharmacy/Drugstores, Specialty Beauty Stores, Department Stores, Brand Exclusive Stores, Clinics/Salons/Spas, Other Offline Retail), Retail Online (Brand-Owned Websites, E-commerce Marketplaces, Online Beauty Retailers, Online Pharmacy Platforms, Social Commerce Platforms, Quick Commerce/On-Demand Delivery Platforms, Other Online Retail)), By Ingredient Platform (Retinoids, Hyaluronic Acid, Niacinamide, Vitamin C, Peptides, AHAs/BHAs, Ceramides, Botanical/Natural Actives, Others), By Age Group (18–34 Years, 35–54 Years, 55 Years & Above), By End User (Women, Men, Unisex), By Price Tier (Mass, Premium), By Region (West, Midwest, South, North, Northeast) ... Read more
|
Major Players
|
US Anti-Aging Products Market Statistics and Insights, 2026
- Market Size Statistics
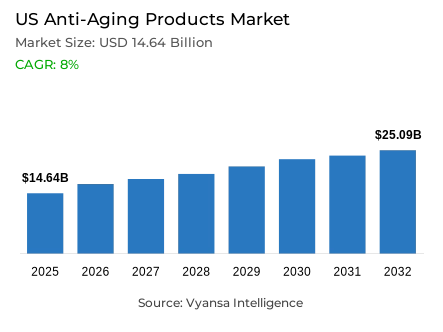
- Anti-aging products market size in US was valued at USD 14.64 billion in 2025 and is estimated at USD 15.81 billion in 2026.
- The market size is expected to grow to USD 25.09 billion by 2032.
- Market to register a CAGR of around 8% during 2026-32.
- Product Type Shares
- Creams & moisturizers grabbed market share of 30%.
- Competition
- More than 10 companies are actively engaged in producing anti-aging products in US.
- Top 5 companies acquired around 15% of the market share.
- Shiseido Company Limited, Beiersdorf AG, PMD Beauty, The Estee Lauder Companies Inc., L’Oreal USA Inc. etc., are few of the top companies.
- Claim/Benefit Type
- Wrinkle & fine-line reduction grabbed 25% of the market.
US Anti-Aging Products Market Outlook
Valued at USD 14.64 billion in 2025, the US anti-aging products market is positioned to expand from USD 15.81 billion in 2026 to USD 25.09 billion by 2032, representing 8% compound annual growth rate throughout the forecast window. This market expansion reflects steady rise in demand for products supporting visible skin care needs and regular beauty routines across the United States. Market momentum remains underpinned by expanding older consumer populations driving sustained demand, clinically validated active ingredients reshaping product development priorities, and integrated prevention and treatment positioning creating dual-benefit market opportunities.
Steady expansion of older consumer base establishes foundational market driver sustaining consumer investment in appearance-focused anti-aging products and daily skin-maintenance routines. Evidence from US Census Bureau reveals population age 65 and older rises 3.1% to 61.2 million from 2023 to 2024, while population under age 18 declines 0.2% to 73.1 million. This demographic shift directly supports market growth through heightened demand for creams, moisturizers, serums, and repair-focused anti-aging formats addressing persistent aging concerns. Published data from US Census Bureau indicates adults age 65 and older account for 18% of US population in 2024, up from 12.4% in 2004, with national median age reaching record 39.1 years establishing sustained demographic tailwind for anti-aging product category.
Clinical validation and evidence-backed formulation trends reshape US anti-aging products market toward measurable efficacy claims and dermatologist-recommended solutions. Research from PubMed Central indicates 2025 systematic review and network meta-analysis evaluating 23 randomized controlled trials covering 3,905 participants finds isotretinoin, retinol, and tretinoin significantly improve fine wrinkles. Published data from PubMed describes topical tretinoin as gold standard anti-aging agent stimulating epidermal growth and reducing collagen breakdown through scientifically documented mechanisms. This evidence-driven shift supports market movement toward retinol skincare positioning and dermatologist-recommended actives enabling brands to center launches around measurable wrinkle-reduction claims supported by clinical substantiation.
Market segmentation demonstrates pronounced consumer preference for practical formats and clinically validated benefit positioning. Creams and moisturizers command 30% market share through alignment with daily-use routines delivering consistent hydration and visible skin-support benefits, while wrinkle and fine-line reduction claims account for 25% of demand reflecting consumer prioritization of measurable outcomes. This US anti-aging products market structure indicates consumers increasingly select familiar formats supporting routine application while demanding clinical evidence substantiating efficacy claims, enabling brands to deliver targeted benefits through accessible daily-use products maintaining strong retail visibility and competitive positioning.

US Anti-Aging Products Market Growth Driver
Aging Demographics Keep Demand Firm
Expanding older population creates sustained demand for US anti-aging products addressing visible aging concerns and long-term skin maintenance needs throughout extended lifespans. Statistics from US Census Bureau confirm population age 65 and older rises 3.1% to 61.2 million from 2023 to 2024, establishing clear demographic trend toward aging consumer concentration. This population shift directly translates into heightened market relevance for anti-aging skincare emphasizing daily support in wrinkle reduction, firmness maintenance, and visible age-sign reversal. Category relevance stems from appearance-conscious older consumers remaining engaged in routine personal care spending, establishing durable commercial foundation supporting sustained market growth.
Demographic composition shift establishes structural demand driver sustaining anti-aging products market expansion throughout forecast period. Published data from US Census Bureau indicates adults age 65 and older account for 18% of US population in 2024, up from 12.4% in 2004, while national median age reaches record 39.1 years in 2024. This aging profile keeps demand firm for premium anti-aging creams, moisturizers, and serums as skin aging concerns become more common across broader age base, strengthening product adoption within everyday personal care routines. Demographic shift supports sustained category relevance independent of cyclical economic factors, establishing reliable demand foundation for anti-aging products market expansion.
US Anti-Aging Products Market Challenge
Compliance Pressure Keeps Entry Bar High
Anti-aging market manufacturers face substantial compliance burdens navigating enhanced Food and Drug Administration (FDA) regulatory frameworks and documentation requirements before product entry and throughout market operations. Official records from FDA indicate serious adverse events linked to cosmetic products must be reported within 15 business days under Modernization of Cosmetics Regulation Act of 2022 (MoCRA), with any new medical information received within 1 year also requiring submission within 15 business days. This compliance infrastructure raises testing burdens, documentation requirements, and ingredient review obligations, particularly for products positioned around visible skin improvement claims requiring substantiation. Regulatory intensity directly impacts launch timelines and execution risk for US anti-aging products market participants developing new formulations addressing wrinkle reduction and anti-aging benefits.
Facility registration requirements and annual product listing updates create ongoing operational compliance burdens affecting market agility and competitive responsiveness. Evidence from FDA reveals manufacturers and processors must register facilities every 2 years, while responsible persons must update cosmetic product listings annually. Official agency warning letter issued July 18, 2025 to Kabana Skin Care LLC following February 2025 facility inspection identifying significant Current Good Manufacturing Practice (CGMP) violations demonstrates enforcement intensity and compliance expectations. This regulatory environment slows product launches and increases execution risk for brands attempting rapid innovation cycles and market expansion, creating operational friction affecting competitive dynamics within US anti-aging products market.
Unlock Market Intelligence
Explore the market potential with our data-driven report
US Anti-Aging Products Market Trend
Clinical Proof Reshapes Product Choice
Consumer purchasing behavior demonstrates pronounced shift toward clinically validated active ingredients and retinol skincare products where visible outcomes receive research backing rather than relying exclusively on broad beauty claims. Market data from PubMed Central indicates 2025 systematic review and network meta-analysis evaluating 23 randomized controlled trials covering 3,905 participants finds isotretinoin, retinol, and tretinoin significantly improve fine wrinkles through documented mechanisms. This clinical evidence creates market opportunity for brands positioning US anti-aging products around dermatologist-recommended actives and measurable wrinkle-reduction claims supported by scientific substantiation. Buyers increasingly prioritize visible outcomes backed by research over aspirational beauty messaging, reshaping competitive landscape toward evidence-driven formulation strategies.
Scientific validation influences ingredient selection and formulation discipline across US anti-aging products market categories. Published research from PubMed describes topical tretinoin as gold standard anti-aging agent used to reduce aging signs through epidermal growth stimulation and collagenase inhibition. This evidence becomes increasingly visible to consumers, supporting brand preference for dermatologist-linked actives, simplified formulations, and measurable benefit claims demonstrating clinical credibility. Market evolution toward clinically validated positioning enables hyaluronic acid serums and retinol-based formulations to capture consumer attention through transparent mechanism-of-action communication and published efficacy data supporting premium market positioning.
US Anti-Aging Products Market Opportunity
Preventive Care Opens Wider White Space
Strong opportunities emerge in US anti-aging products combining treatment with daily prevention, particularly sun-defense and photoaging repair positioning addressing consumer understanding of long-term damage accumulation. Market data from Centers for Disease Control and Prevention (CDC) reveals nearly 6 million people treated for skin cancer annually in the United States with annual medical cost reaching USD 8.9 billion, establishing consumer awareness around sun damage consequences. This disease burden supports growing demand for day creams, moisturizers, and serums integrating prevention into daily skincare routines, creating commercial opportunity for brands positioning dual-benefit formulations combining immediate visible improvement with long-term photoaging prevention. Prevention-focused positioning aligns with consumer health consciousness and supports premium market opportunities for integrated treatment-prevention solutions.
Widespread sunburn occurrence and associated emergency treatment costs strengthen market opportunities for photoaging prevention and barrier-support anti-aging products. Evidence from CDC indicates about two-thirds of high school students and nearly one-third of adults get sunburned at least once annually, with estimated 33,826 emergency department visits for sunburn annually costing USD 11.2 million. This prevalence creates meaningful opportunity for anti-aging brands developing SPF-linked care formulations, barrier-support products, and prevention-led visible-aging claims addressing consumer education around cumulative sun damage. Market expansion occurs through integrated prevention-treatment positioning where anti-aging skincare becomes recognized health investment supporting long-term skin health protection and appearance maintenance throughout extended consumer lifespans.
Unlock Market Intelligence
Explore the market potential with our data-driven report
US Anti-Aging Products Market Segmentation Analysis
By Product Type
- Creams & Moisturizers
- Serums
- Sunscreens/SPF Day Creams
- Exfoliators/Peels
- Masks
- Targeted Treatments/Spot Correctors
Creams and moisturizers command market leadership at 30% share within US anti-aging products market, establishing dominant product type positioning through superior alignment with consumer preferences for practical daily-use formats. This market segment maintains leading position due to strong consumer preference for easy-to-apply, familiar formats integrating seamlessly into established skincare routines emphasizing hydration and visible skin-support benefits. Cream and moisturizer formulations deliver accessible positioning supporting routine daily application while maintaining adequate performance for sustained wrinkle care and firmness maintenance addressing broad consumer demographics seeking practical anti-aging solutions.
This market leadership position reflects consumers' continued selection of practical product types supporting daily use integration without specialized techniques or complexity. Creams and moisturizers support repeated morning and night application, delivering hydration and anti-aging benefits within single accessible format supporting repeat purchase behavior. The 30% market share indicates this segment continues shaping US anti-aging products demand, retail shelf presence, and launch priorities across the broader industry. Consumers continue preferring product types combining convenience with visible skin-support benefits, enabling manufacturers maintaining cream and moisturizer leadership to develop formulation innovation supporting category expansion through advanced delivery systems and clinically validated actives maintaining competitive positioning.

By Claim/Benefit Type
- Wrinkle & Fine-Line Reduction
- Firming/Lifting Appearance
- Hydration/Plumping
- Brightening/Age-Spot Correction
- Barrier Repair/Sensitive Mature Skin
- Sun Protection/Photoaging Prevention
Wrinkle and fine-line reduction claims command market leadership at 25% share within US anti-aging products market benefit segment, establishing categorical dominance reflecting consumer prioritization of measurable outcomes over generic age-care positioning. This market segment demonstrates wrinkle correction remains most recognized and commercially direct anti-aging promise with consumers evaluating performance through visible line reduction and measurable skin improvement. Consumers across age groups expect anti-aging products demonstrating efficacy around wrinkle softening, fine-line reduction, and visible texture improvement supporting sustained engagement with products delivering measurable results.
Product development continues being shaped by outcome-driven requirements as manufacturers emphasize clinically validated actives and measurable benefit communication throughout competitive US anti-aging products market environments. Brands formulating wrinkle and fine-line reduction claims emphasize hyaluronic acid serums, retinol skincare, and peptide technology addressing consumer expectations around visible wrinkle improvement and texture refinement. The 25% market share indicates this benefit segment continues influencing product claims development, brand positioning, and innovation priorities throughout US anti-aging industry. Benefit-led demand remains strongly tied to visible results and specific appearance concerns, enabling manufacturers maintaining wrinkle and fine-line reduction claim leadership to develop product innovation capturing sustained demand through dermatologist-recommended actives and published efficacy data supporting category expansion throughout forecast period.
List of Companies Covered in US Anti-Aging Products Market
The companies listed below are highly influential in the US anti-aging products market, with a significant market share and a strong impact on industry developments.
- Shiseido Company Limited
- Beiersdorf AG
- PMD Beauty
- The Estee Lauder Companies Inc.
- L’Oreal USA Inc.
- The Procter & Gamble Company
- Kenvue Inc.
- Unilever PLC
- ZO Skin Health Inc.
- Avon Products Inc. / Avon
Market News & Updates
- The Estee Lauder Companies Inc., 2026:
In April 2026, The Estée Lauder Companies announced two peer-reviewed publications on skin longevity science from New York. The company said the papers validated Re-Nutriv’s sirtuin-targeting formulations and introduced a new facial age-assessment model. It also reported statistically significant visible age reduction in a 12-week clinical study. This is highly relevant to the US anti-aging products market. It strengthens science-backed premium positioning and raises clinical proof standards. It may also increase competition around longevity-focused skincare claims and innovation.
- Kenvue Inc., 2026:
In March 2026, Kenvue said Neutrogena, Aveeno, and Rogaine would debut innovative products at AAD 2026, alongside new science and 20 research abstracts, with the announcement explicitly linking these launches to healthy aging, moisturization, sun protection, and acne-related skin concerns. For the US anti-aging products market, this is more relevant from a product perspective because it signals active pipeline expansion in clinically positioned skincare, especially around healthy aging and barrier-support needs that overlap with anti-aging demand. It also shows Kenvue is using dermatologist-facing launches to strengthen credibility, improve product differentiation, and compete more directly in science-backed mass-premium skincare.
Frequently Asked Questions
Related Report
- Market Segmentation
- Research Scope
- Research Methodology
- Definitions and Assumptions
- Executive Summary
- US Anti-Aging Products Market Policies, Regulations, and Standards
- US Anti-Aging Products Market Dynamics
- Growth Factors
- Challenges
- Trends
- Opportunities
- US Anti-Aging Products Market Statistics, 2022-2032F
- Market Size & Growth Outlook
- By Revenues in USD Million
- Market Segmentation & Growth Outlook
- By Product Type
- Creams & Moisturizers- Market Insights and Forecast 2022-2032, USD Million
- Serums- Market Insights and Forecast 2022-2032, USD Million
- Sunscreens/SPF Day Creams- Market Insights and Forecast 2022-2032, USD Million
- Exfoliators/Peels- Market Insights and Forecast 2022-2032, USD Million
- Masks- Market Insights and Forecast 2022-2032, USD Million
- Targeted Treatments/Spot Correctors- Market Insights and Forecast 2022-2032, USD Million
- By Claim/Benefit Type
- Wrinkle & Fine-Line Reduction- Market Insights and Forecast 2022-2032, USD Million
- Firming/Lifting Appearance- Market Insights and Forecast 2022-2032, USD Million
- Hydration/Plumping- Market Insights and Forecast 2022-2032, USD Million
- Brightening/Age-Spot Correction- Market Insights and Forecast 2022-2032, USD Million
- Barrier Repair/Sensitive Mature Skin- Market Insights and Forecast 2022-2032, USD Million
- Sun Protection/Photoaging Prevention- Market Insights and Forecast 2022-2032, USD Million
- By Sales Channel
- Retail Offline- Market Insights and Forecast 2022-2032, USD Million
- Supermarkets/Hypermarkets- Market Insights and Forecast 2022-2032, USD Million
- Pharmacy/Drugstores- Market Insights and Forecast 2022-2032, USD Million
- Specialty Beauty Stores- Market Insights and Forecast 2022-2032, USD Million
- Department Stores- Market Insights and Forecast 2022-2032, USD Million
- Brand Exclusive Stores- Market Insights and Forecast 2022-2032, USD Million
- Clinics/Salons/Spas- Market Insights and Forecast 2022-2032, USD Million
- Other Offline Retail- Market Insights and Forecast 2022-2032, USD Million
- Retail Online- Market Insights and Forecast 2022-2032, USD Million
- Brand-Owned Websites- Market Insights and Forecast 2022-2032, USD Million
- E-commerce Marketplaces- Market Insights and Forecast 2022-2032, USD Million
- Online Beauty Retailers- Market Insights and Forecast 2022-2032, USD Million
- Online Pharmacy Platforms- Market Insights and Forecast 2022-2032, USD Million
- Social Commerce Platforms- Market Insights and Forecast 2022-2032, USD Million
- Quick Commerce/On-Demand Delivery Platforms- Market Insights and Forecast 2022-2032, USD Million
- Other Online Retail- Market Insights and Forecast 2022-2032, USD Million
- Retail Offline- Market Insights and Forecast 2022-2032, USD Million
- By Ingredient Platform
- Retinoids- Market Insights and Forecast 2022-2032, USD Million
- Hyaluronic Acid- Market Insights and Forecast 2022-2032, USD Million
- Niacinamide- Market Insights and Forecast 2022-2032, USD Million
- Vitamin C- Market Insights and Forecast 2022-2032, USD Million
- Peptides- Market Insights and Forecast 2022-2032, USD Million
- AHAs/BHAs- Market Insights and Forecast 2022-2032, USD Million
- Ceramides- Market Insights and Forecast 2022-2032, USD Million
- Botanical/Natural Actives- Market Insights and Forecast 2022-2032, USD Million
- Others- Market Insights and Forecast 2022-2032, USD Million
- By Age Group
- 18–34 Years- Market Insights and Forecast 2022-2032, USD Million
- 35–54 Years- Market Insights and Forecast 2022-2032, USD Million
- 55 Years & Above- Market Insights and Forecast 2022-2032, USD Million
- By End User
- Women- Market Insights and Forecast 2022-2032, USD Million
- Men- Market Insights and Forecast 2022-2032, USD Million
- Unisex- Market Insights and Forecast 2022-2032, USD Million
- By Price Tier
- Mass- Market Insights and Forecast 2022-2032, USD Million
- Premium- Market Insights and Forecast 2022-2032, USD Million
- By Region
- West- Market Insights and Forecast 2022-2032, USD Million
- Midwest- Market Insights and Forecast 2022-2032, USD Million
- South- Market Insights and Forecast 2022-2032, USD Million
- North- Market Insights and Forecast 2022-2032, USD Million
- Northeast- Market Insights and Forecast 2022-2032, USD Million
- By Competitors
- Competition Characteristics
- Market Share & Analysis
- By Product Type
- Market Size & Growth Outlook
- US Creams & Moisturizers Market Statistics, 2022-2032
- Market Size & Growth Outlook
- By Revenues in USD Million
- Market Segmentation & Growth Outlook
- By Claim/Benefit Type- Market Insights and Forecast 2022-2032, USD Million
- By Sales Channel- Market Insights and Forecast 2022-2032, USD Million
- By Ingredient Platform- Market Insights and Forecast 2022-2032, USD Million
- By Age Group- Market Insights and Forecast 2022-2032, USD Million
- By End User- Market Insights and Forecast 2022-2032, USD Million
- By Price Tier- Market Insights and Forecast 2022-2032, USD Million
- By Region- Market Insights and Forecast 2022-2032, USD Million
- Market Size & Growth Outlook
- US Serums Market Statistics, 2022-2032
- Market Size & Growth Outlook
- By Revenues in USD Million
- Market Segmentation & Growth Outlook
- By Claim/Benefit Type- Market Insights and Forecast 2022-2032, USD Million
- By Sales Channel- Market Insights and Forecast 2022-2032, USD Million
- By Ingredient Platform- Market Insights and Forecast 2022-2032, USD Million
- By Age Group- Market Insights and Forecast 2022-2032, USD Million
- By End User- Market Insights and Forecast 2022-2032, USD Million
- By Price Tier- Market Insights and Forecast 2022-2032, USD Million
- By Region- Market Insights and Forecast 2022-2032, USD Million
- Market Size & Growth Outlook
- US Sunscreens/SPF Day Creams Market Statistics, 2022-2032
- Market Size & Growth Outlook
- By Revenues in USD Million
- Market Segmentation & Growth Outlook
- By Claim/Benefit Type- Market Insights and Forecast 2022-2032, USD Million
- By Sales Channel- Market Insights and Forecast 2022-2032, USD Million
- By Ingredient Platform- Market Insights and Forecast 2022-2032, USD Million
- By Age Group- Market Insights and Forecast 2022-2032, USD Million
- By End User- Market Insights and Forecast 2022-2032, USD Million
- By Price Tier- Market Insights and Forecast 2022-2032, USD Million
- By Region- Market Insights and Forecast 2022-2032, USD Million
- Market Size & Growth Outlook
- US Exfoliators/Peels Market Statistics, 2022-2032
- Market Size & Growth Outlook
- By Revenues in USD Million
- Market Segmentation & Growth Outlook
- By Claim/Benefit Type- Market Insights and Forecast 2022-2032, USD Million
- By Sales Channel- Market Insights and Forecast 2022-2032, USD Million
- By Ingredient Platform- Market Insights and Forecast 2022-2032, USD Million
- By Age Group- Market Insights and Forecast 2022-2032, USD Million
- By End User- Market Insights and Forecast 2022-2032, USD Million
- By Price Tier- Market Insights and Forecast 2022-2032, USD Million
- By Region- Market Insights and Forecast 2022-2032, USD Million
- Market Size & Growth Outlook
- US Masks Market Statistics, 2022-2032
- Market Size & Growth Outlook
- By Revenues in USD Million
- Market Segmentation & Growth Outlook
- By Claim/Benefit Type- Market Insights and Forecast 2022-2032, USD Million
- By Sales Channel- Market Insights and Forecast 2022-2032, USD Million
- By Ingredient Platform- Market Insights and Forecast 2022-2032, USD Million
- By Age Group- Market Insights and Forecast 2022-2032, USD Million
- By End User- Market Insights and Forecast 2022-2032, USD Million
- By Price Tier- Market Insights and Forecast 2022-2032, USD Million
- By Region- Market Insights and Forecast 2022-2032, USD Million
- Market Size & Growth Outlook
- US Targeted Treatments/Spot Correctors Market Statistics, 2022-2032
- Market Size & Growth Outlook
- By Revenues in USD Million
- Market Segmentation & Growth Outlook
- By Claim/Benefit Type- Market Insights and Forecast 2022-2032, USD Million
- By Sales Channel- Market Insights and Forecast 2022-2032, USD Million
- By Ingredient Platform- Market Insights and Forecast 2022-2032, USD Million
- By Age Group- Market Insights and Forecast 2022-2032, USD Million
- By End User- Market Insights and Forecast 2022-2032, USD Million
- By Price Tier- Market Insights and Forecast 2022-2032, USD Million
- By Region- Market Insights and Forecast 2022-2032, USD Million
- Market Size & Growth Outlook
- Competitive Outlook
- Company Profiles
- The Estee Lauder Companies Inc.
- Business Description
- Product Portfolio
- Collaborations & Alliances
- Recent Developments
- Financial Details
- Others
- L’Oreal USA Inc.
- Business Description
- Product Portfolio
- Collaborations & Alliances
- Recent Developments
- Financial Details
- Others
- The Procter & Gamble Company
- Business Description
- Product Portfolio
- Collaborations & Alliances
- Recent Developments
- Financial Details
- Others
- Kenvue Inc.
- Business Description
- Product Portfolio
- Collaborations & Alliances
- Recent Developments
- Financial Details
- Others
- Unilever PLC
- Business Description
- Product Portfolio
- Collaborations & Alliances
- Recent Developments
- Financial Details
- Others
- Shiseido Company Limited
- Business Description
- Product Portfolio
- Collaborations & Alliances
- Recent Developments
- Financial Details
- Others
- Beiersdorf AG
- Business Description
- Product Portfolio
- Collaborations & Alliances
- Recent Developments
- Financial Details
- Others
- PMD Beauty
- Business Description
- Product Portfolio
- Collaborations & Alliances
- Recent Developments
- Financial Details
- Others
- ZO Skin Health Inc.
- Business Description
- Product Portfolio
- Collaborations & Alliances
- Recent Developments
- Financial Details
- Others
- Avon Products Inc. / Avon
- Business Description
- Product Portfolio
- Collaborations & Alliances
- Recent Developments
- Financial Details
- Others
- The Estee Lauder Companies Inc.
- Company Profiles
- Disclaimer
| Segment | Sub-Segment |
|---|---|
| By Product Type |
|
| By Claim/Benefit Type |
|
| By Sales Channel |
|
| By Ingredient Platform |
|
| By Age Group |
|
| By End User |
|
| By Price Tier |
|
| By Region |
|
Research Methodology
This study followed a structured approach comprising four key phases to assess the size and scope of the electro-oxidation market. The process began with thorough secondary research to collect data on the target market, related markets, and broader industry context. These findings, along with preliminary assumptions and estimates, were then validated through extensive primary research involving industry experts from across the value chain. To calculate the overall market size, both top-down and bottom-up methodologies were employed. Finally, market segmentation and data triangulation techniques were applied to refine and validate segment-level estimations.
Secondary Research
The secondary research phase involved gathering data from a wide range of credible and published sources. This step helped in identifying industry trends, defining market segmentation, and understanding the market landscape and value chain.
Sources consulted during this phase included:
- Company annual reports, investor presentations, and press releases
- Industry white papers and certified publications
- Trade directories and market-recognized databases
- Articles from authoritative authors and reputable journals
- Gold and silver standard websites
Secondary research was critical in mapping out the industry's value chain and monetary flow, identifying key market segments, understanding regional variations, and tracking significant industry developments.
Other key sources:
- Financial disclosures
- Industry associations and trade bodies
- News outlets and business magazines
- Academic journals and research studies
- Paid industry databases
Primary Research
To validate secondary data and gain deeper market insights, primary research was conducted with key stakeholders across both the supply and demand sides of the market.
On the demand side, participants included decision-makers and influencers from end-user industries—such as CIOs, CTOs, and CSOs—who provided first-hand perspectives on market needs, product usage, and future expectations.
On the supply side, interviews were conducted with manufacturers, industry associations, and institutional participants to gather insights into current offerings, product pipelines, and market challenges.
Primary interviews provided critical inputs such as:
- Market size and revenue data
- Product and service breakdowns
- Market forecasts
- Regional and application-specific trends
Stakeholders consulted included:
- Leading OEM and solution providers
- Channel and distribution partners
- End users across various applications
- Independent consultants and industry specialists
Market Size Estimation and Data Triangulation
- Identifying Key Market Participants (Secondary Research)
- Goal: To identify the major players or companies in the target market. This typically involves using publicly available data sources such as industry reports, market research publications, and financial statements of companies.
- Tools: Reports from firms like Gartner, Forrester, Euromonitor, Statista, IBISWorld, and others. Public financial statements, news articles, and press releases from top market players.
- Extracting Earnings of Key Market Participants
- Goal: To estimate the earnings generated from the product or service being analyzed. This step helps in understanding the revenue potential of each market player in a specific geography.
- Methods: Earnings data can be gathered from:
- Publicly available financial reports (for listed companies).
- Interviews and primary data sources from professionals, such as Directors, VPs, SVPs, etc. This is especially useful for understanding more nuanced, internal data that isn't publicly disclosed.
- Annual reports and investor presentations of key players.
- Data Collation and Development of a Relevant Data Model
- Goal: To collate inputs from both primary and secondary sources into a structured, data-driven model for market estimation. This model will incorporate key market KPIs and any independent variables relevant to the market.
- Key KPIs: These could include:
- Market size, growth rate, and demand drivers.
- Industry-specific metrics like market share, average revenue per customer (ARPC), or average deal size.
- External variables, such as economic growth rates, inflation rates, or commodity prices, that could affect the market.
- Data Modeling: Based on this data, the market forecasts are developed for the next 5 years. A combination of trend analysis, scenario modeling, and statistical regression might be used to generate projections.
- Scenario Analysis
- Goal: To test different assumptions and validate how sensitive the market is to changes in key variables (e.g., market demand, regulatory changes, technological disruptions).
- Types of Scenarios:
- Base Case: Based on current assumptions and historical data.
- Best-Case Scenario: Assuming favorable market conditions, regulatory environments, and technological advancements.
- Worst-Case Scenario: Accounting for adverse factors, such as economic downturns, stricter regulations, or unexpected disruptions.


