Global Smart Agriculture Market Report: Trends, Growth and Forecast (2026-2032)
By Offering (Hardware (Automation & Control Systems, Drones, Guidance Systems (GPS, GIS), Remote Sensing Devices (Satellite, Handheld), Variable Rate Technology (Map-based, Sensor-based), Wireless Modules (Bluetooth, Wi-Fi, Zigbee, RF), Milking Robots), Software (On-Premise Solutions (Web-Based), Cloud-Based Platforms), Services (System Integration & Consulting, Maintenance & Support, Managed Services (Data Analytics, Farm Operation, Supply Chain Management, Climate Information))), By Application (Precision Farming (Yield Monitoring (On-Farm, Off-Farm), Field Mapping, Crop Scouting), Weather Tracking & Forecasting (Irrigation Management, Inventory Management, Farm Labor Management), Smart Greenhouse (Water & Fertilizer Management, HVAC Management, Yield Monitoring), Livestock Monitoring (Milk Harvesting, Breeding Management, Feeding Management, Animal Comfort Management), Others), By Agriculture Type (Indoor Farming, Outdoor Farming), By Farm Size (Small Farms, Medium Farms, Large Farms), By Region (North America, Latin America, Europe, Middle East & Africa, Asia-Pacific) ... Read more
|
Major Players
|
Global Smart Agriculture Market Statistics and Insights, 2026
- Market Size Statistics
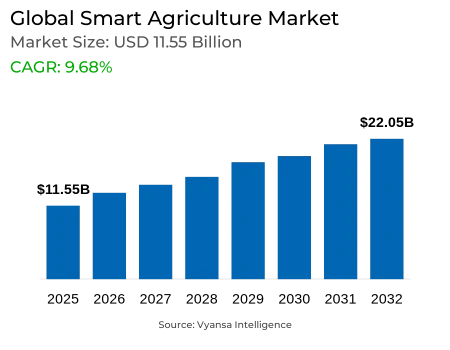
- Global Smart Agriculture Market is estimated at $ 11.55 Billion.
- The market size is expected to grow to $ 22.05 Billion by 2032.
- Market to register a CAGR of around 9.68% during 2026-32.
- Application Shares
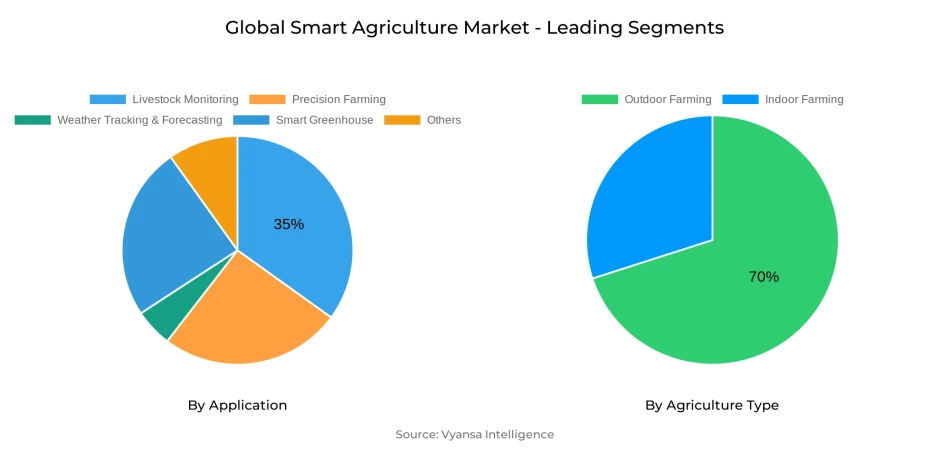
- Livestock Monitoring grabbed market share of 35%.
- Competition
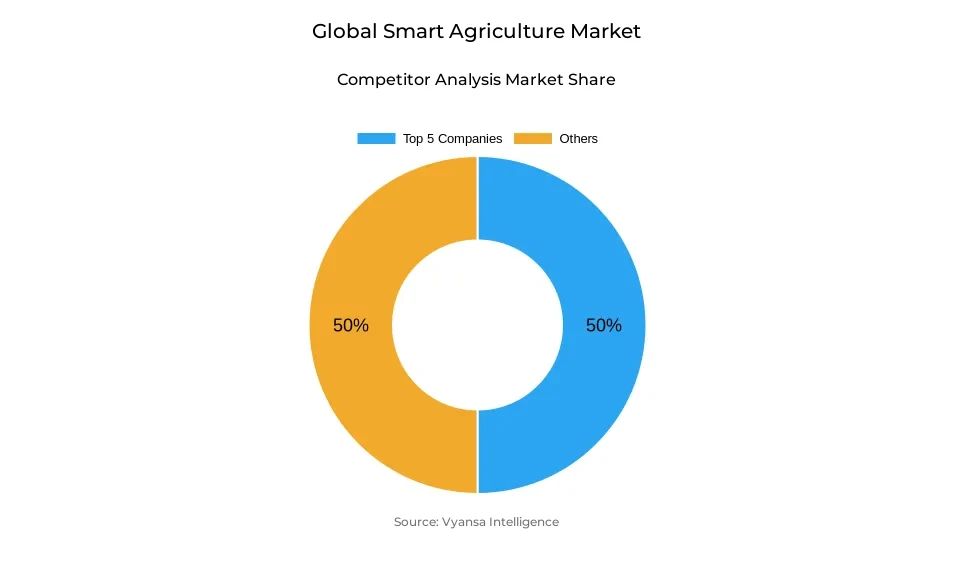
- More than 20 companies are actively engaged in producing Smart Agriculture.
- Top 5 companies acquired 50% of the market share.
- CLAAS KGaA mbH, Topcon Positioning Systems, BASF (xarvio®), Deere & Company, Trimble Inc. etc., are few of the top companies.
- Agriculture Type
- Outdoor Farming grabbed 70% of the market.
- Region
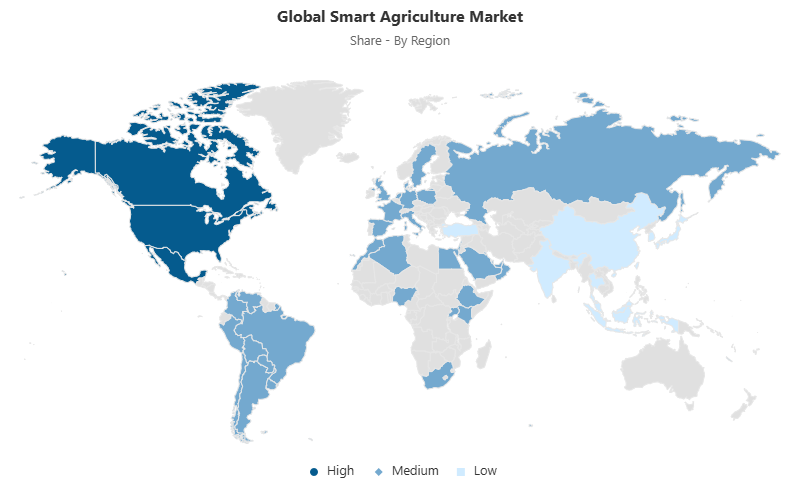
- North America leads with a 45% share of the Global Market.
Global Smart Agriculture Market Outlook
Global Smart Agriculture Market 2026-32 is undergoing a revolutionary change as new technologies are redefining how farms utilize resources, especially water and fertilizers. Sensor networks now offer real-time information on soil moisture and nutrient status, enabling farmers to reduce wastage and increase yields. Synchronization of automated irrigation systems with weather forecasts enables targeted water delivery, enhancing efficiency as well as sustainable farming. Beyond irrigation, precision input management ensures crops receive exactly what they need, reducing unnecessary chemical use, lowering costs, and minimizing environmental impact.
Connectivity and digital literacy are also the greatest challenges to the adoption of smart agriculture. Most rural communities lack stable broadband and variable electricity, which may impede the use of IoT technology and automated monitoring systems. Smallholder farmers may have difficulty deciphering and controlling technology without proper training, inhibiting the adoption of such innovations. Scaling up capacity-building programs and training is important to allow more end users to use digital platforms efficiently, increasing productivity and transforming technology-driven farming into an inclusive paradigm.
Drones and satellite monitoring are transforming crop management by offering high-resolution details at both field and regional levels. Satellite data permits precise fertilization, disease identification, and yield forecasting, while predictive analytics from machine learning platforms consolidate disparate data sources. Shared-use machinery platforms and custom hiring facilities are boosting access to GPS-guided tractors, drones, and other machinery, reducing capital requirements and enhancing mechanization uptake, especially in growing economies where outright purchase is a financial constraint.
Livestock tracking drives smart agriculture applications, and it controls 35% of the market, whereas outdoor farming is the most successful agricultural type segmentation with a 70% share worldwide. Wearable sensors monitor animal health and enhance feed management, whereas outdoor farms leverage sensor networks, drones, and satellite imagery for effective use of water and inputs. North America dominates 45% of the market with robust infrastructure, supportive policies, and collaboration ecosystems. The Global Smart Agriculture Market is projected at USD 11.55 Billion in 2025 and is estimated to reach USD 22.05 Billion by the year 2032, evidencing high take-up and technological advancement.
Global Smart Agriculture Market Growth Driver
Growing Role of Resource Optimization in Agriculture
Smart agriculture technology is redefining the way farms use resources, especially water and fertilizers. Sophisticated sensor networks offer real-time measurements of soil moisture content and nutrient levels, enabling farmers to reduce waste and optimize crop yields. Despite this, inefficiency remains, as almost 50% of irrigation water still gets lost in evaporation and runoff. With the inclusion of automated irrigation systems and weather forecasts, end users are well positioned to provide accurate volumes of water, promoting viable resource management and minimizing environmental footprint.
Outside of irrigation, precision input management increases farm profitability while promoting environmentally friendly practices. By linking crop requirements with precise resource distribution, farms can minimize unnecessary chemical use, reducing costs and environmental impact. These developments are a necessary step toward more efficient agriculture in which end users maximize productivity without increasing land use or denuding natural reserves.
Global Smart Agriculture Market Challenge
Connectivity Limitations Restraining Wider Adoption
Connectivity issues are still the central impediment to smart agriculture take-up, most notably in rural areas with poor broadband coverage and intermittent power supply. Automated monitoring devices and IoT-enabled machines need robust digital infrastructure, but most agricultural areas do not have adequate cover. This restriction hinders farmers' capacity to adopt precision mapping and variable-rate application, limiting the scalability of advanced solutions to varied agricultural terrain.
Apart from infrastructure shortcomings, constraints in digital literacy also inhibit uptake. Small-holder farmers, who are a majority of agricultural producers worldwide, are commonly not literate in data and managing technology. Absence of proper training means that the digital platform benefits are not within reach for many. Upscaling capacity-building programs and training for farmers is crucial to fill this knowledge gap, allowing end users to realize the potential of smart agriculture tools and enhance the inclusivity of technology-led growth.
Unlock Market Intelligence
Explore the market potential with our data-driven report
Global Smart Agriculture Market Trend
Advancements in Precision Imaging Technologies
Unmanned aerial vehicles and satellite monitoring are transforming field measurement in contemporary agriculture. High-resolution aerial imagery from drones offers detailed insights into crop heterogeneity, facilitating targeted measures like site-specific fertilization and early disease diagnosis. Meanwhile, satellites give wider-scale insight into regional soil moisture conditions and vegetation health, a strong complement to the localized drone measurements.
Machine learning platforms augment such imaging systems by combining various data sources into predictive analytics. These technologies predict yield results, evaluate pest threats, and detect resource needs at both field and plant levels. By lowering reliance on blanket treatment practices, precision imaging encourages individualized crop management that optimizes yields while reducing operational expenses. With wider availability of such technologies, end-users receive dependable, data-driven conclusions for decision-making that enhance efficiency and sustainability in agriculture.
Global Smart Agriculture Market Opportunity
Expanding Opportunities Through Shared Mechanization
The access to high-end machinery is only available to smallholder farmers to a limited extent, but shared-access platforms are opening up new avenues. Digital booking interfaces enable end users to hire GPS-equipped tractors, drones, and other equipment on an on-demand basis, enabling a pay-as-you-go regime that reduces capital expenditures. The strategy optimizes use of high-value assets, making access to state-of-the-art technology available to the masses and enabling efficiency improvements across farm sizes.
Custom hiring centers are also revolutionizing mechanization availability. With IoT-connected equipment, not only do they lease machinery but offer predictive maintenance and diagnostic services to guarantee reliability. Through downtime reduction and equipment life extension, they provide end users with improved service quality. This shared model stimulates wider mechanization uptake, especially among developing markets, where outright purchase of sophisticated machines is still economically prohibitive.
Global Smart Agriculture Market Regional Analysis
By Region
- North America
- Latin America
- Europe
- Middle East & Africa
- Asia-Pacific
North America is the current market leader in the Global Smart Agriculture Market, holding 45% of the total share. The region enjoys high broadband infrastructure, high electricity supply, and supportive government policies favorable to the use of precision farming technology. Federally sponsored programs, grant funding for research, and innovation centers have spurred fast growth in sensor networks, robotics, and digital platforms.
Collaboration between universities, private agritech companies, and government institutions further promotes technology adoption. Pilot testing, field experiments, and public–private partnerships establish an enabling environment that makes large-scale adoption easy. This regional leadership showcases the role of infrastructure preparation and policy environments in driving agricultural modernization. Leadership by North America is likely to continue as continued investments in connectivity and digital training enhance the capacity of end users throughout the region.
Unlock Market Intelligence
Explore the market potential with our data-driven report
Global Smart Agriculture Market Segmentation Analysis
By Application
- Precision Farming
- Weather Tracking & Forecasting
- Smart Greenhouse
- Livestock Monitoring
- Others
In application types, livestock monitoring is the biggest segment, occupying 35% of today's deployments in the Global Smart Agriculture Market. Wearable sensors and tracking devices track animal movement patterns, feed intake, and animal health, allowing for the early identification of diseases and optimizing nutrition management. These assist in low mortality rates and enhanced herd productivity, thus being an imperative for operations based on livestock.
Geofencing technologies are used more and more in animal monitoring solutions, offering supplementary layers of protection. Automated notifications inform farmers when animals leave pre-defined areas, safeguarding them from predators or intruders. Sophisticated analytics platforms condense health and environmental information and provide insights to inform breeding programs and optimize resource utilization. Given livestock farming's central role in food supply chains, take-up of these monitoring systems continues to grow rapidly, solidifying their role as the dominant application sector.
By Agriculture Type
- Indoor Farming
- Outdoor Farming
Open-field farming leads agricultural type segmentation, with 70% of smart agriculture use worldwide. Sensor networks tracking real-time soil moisture, weather, and crop health are a major boon to open-field farming. Coupled with drone scouting, these technologies enable economical water use and precise application of agrochemicals, ultimately driving yields and resource use up.
Satellite imagery combined with machine learning models presents additional value to outdoor farm operations. This information enables farmers to chart variation in large fields, maximize planting calendars, and respond to fertilization methods based on exact field information. The dependence on outdoor farming throughout most global regions guarantees this segment will continue to drive smart agriculture adoption. With improving connectivity, the size and complexity of outdoor farming solutions are predicted to grow even larger.
Top Companies in Global Smart Agriculture Market
The top companies operating in the market include CLAAS KGaA mbH, Topcon Positioning Systems, BASF (xarvio®), Deere & Company, Trimble Inc., AGCO Corporation, CNH Industrial, Raven Industries, DeLaval Inc., AG Leader Technology, AgJunction, Inc., Precision Planting, Inc., DroneDeploy, BouMatic Robotic B.V., Autonomous Solutions, Inc., etc., are the top players operating in the Global Smart Agriculture Market.
Frequently Asked Questions
Related Report
1. Market Segmentation
1.1. Research Scope
1.2. Research Methodology
1.3. Definitions and Assumptions
2. Executive Summary
3. Global Smart Agriculture Market Policies, Regulations, and Standards
4. Global Smart Agriculture Market Dynamics
4.1. Growth Factors
4.2. Challenges
4.3. Trends
4.4. Opportunities
5. Global Smart Agriculture Market Statistics, 2022-2032F
5.1. Market Size & Growth Outlook
5.1.1.By Revenues in US$ Million
5.2. Market Segmentation & Growth Outlook
5.2.1.By Offering
5.2.1.1. Hardware- Market Insights and Forecast 2022-2032, USD Million
5.2.1.1.1. Automation & Control Systems- Market Insights and Forecast 2022-2032, USD Million
5.2.1.1.2. Drones- Market Insights and Forecast 2022-2032, USD Million
5.2.1.1.3. Guidance Systems (GPS, GIS)- Market Insights and Forecast 2022-2032, USD Million
5.2.1.1.4. Remote Sensing Devices (Satellite, Handheld)- Market Insights and Forecast 2022-2032, USD Million
5.2.1.1.5. Variable Rate Technology (Map-based, Sensor-based)- Market Insights and Forecast 2022-2032, USD Million
5.2.1.1.6. Wireless Modules (Bluetooth, Wi-Fi, Zigbee, RF)- Market Insights and Forecast 2022-2032, USD Million
5.2.1.1.7. Milking Robots- Market Insights and Forecast 2022-2032, USD Million
5.2.1.2. Software- Market Insights and Forecast 2022-2032, USD Million
5.2.1.2.1. On-Premise Solutions (Web-Based)- Market Insights and Forecast 2022-2032, USD Million
5.2.1.2.2. Cloud-Based Platforms- Market Insights and Forecast 2022-2032, USD Million
5.2.1.3. Services- Market Insights and Forecast 2022-2032, USD Million
5.2.1.3.1. System Integration & Consulting- Market Insights and Forecast 2022-2032, USD Million
5.2.1.3.2. Maintenance & Support- Market Insights and Forecast 2022-2032, USD Million
5.2.1.3.3. Managed Services (Data Analytics, Farm Operation, Supply Chain Management, Climate Information)- Market Insights and Forecast 2022-2032, USD Million
5.2.2.By Application
5.2.2.1. Precision Farming- Market Insights and Forecast 2022-2032, USD Million
5.2.2.1.1. Yield Monitoring (On-Farm, Off-Farm)- Market Insights and Forecast 2022-2032, USD Million
5.2.2.1.2. Field Mapping- Market Insights and Forecast 2022-2032, USD Million
5.2.2.1.3. Crop Scouting- Market Insights and Forecast 2022-2032, USD Million
5.2.2.2. Weather Tracking & Forecasting- Market Insights and Forecast 2022-2032, USD Million
5.2.2.2.1. Irrigation Management- Market Insights and Forecast 2022-2032, USD Million
5.2.2.2.2. Inventory Management- Market Insights and Forecast 2022-2032, USD Million
5.2.2.2.3. Farm Labor Management- Market Insights and Forecast 2022-2032, USD Million
5.2.2.3. Smart Greenhouse- Market Insights and Forecast 2022-2032, USD Million
5.2.2.3.1. Water & Fertilizer Management- Market Insights and Forecast 2022-2032, USD Million
5.2.2.3.2. HVAC Management- Market Insights and Forecast 2022-2032, USD Million
5.2.2.3.3. Yield Monitoring- Market Insights and Forecast 2022-2032, USD Million
5.2.2.4. Livestock Monitoring- Market Insights and Forecast 2022-2032, USD Million
5.2.2.4.1. Milk Harvesting- Market Insights and Forecast 2022-2032, USD Million
5.2.2.4.2. Breeding Management- Market Insights and Forecast 2022-2032, USD Million
5.2.2.4.3. Feeding Management- Market Insights and Forecast 2022-2032, USD Million
5.2.2.4.4. Animal Comfort Management- Market Insights and Forecast 2022-2032, USD Million
5.2.2.5. Others- Market Insights and Forecast 2022-2032, USD Million
5.2.3.By Agriculture Type
5.2.3.1. Indoor Farming- Market Insights and Forecast 2022-2032, USD Million
5.2.3.2. Outdoor Farming- Market Insights and Forecast 2022-2032, USD Million
5.2.4.By Farm Size
5.2.4.1. Small Farms- Market Insights and Forecast 2022-2032, USD Million
5.2.4.2. Medium Farms- Market Insights and Forecast 2022-2032, USD Million
5.2.4.3. Large Farms- Market Insights and Forecast 2022-2032, USD Million
5.2.5.By Region
5.2.5.1. North America
5.2.5.2. Latin America
5.2.5.3. Europe
5.2.5.4. Middle East & Africa
5.2.5.5. Asia-Pacific
5.2.6.By Competitors
5.2.6.1. Competition Characteristics
5.2.6.2. Market Share & Analysis
6. North America Smart Agriculture Market Statistics, 2022-2032F
6.1. Market Size & Growth Outlook
6.1.1.By Revenues in US$ Million
6.2. Market Segmentation & Growth Outlook
6.2.1.By Offering- Market Insights and Forecast 2022-2032, USD Million
6.2.2.By Application- Market Insights and Forecast 2022-2032, USD Million
6.2.3.By Agriculture Type- Market Insights and Forecast 2022-2032, USD Million
6.2.4.By Farm Size- Market Insights and Forecast 2022-2032, USD Million
6.2.5.By Country
6.2.5.1. USA
6.2.5.2. Canada
6.2.5.3. Mexico
6.2.5.4. Rest of North America
6.3. USA Smart Agriculture Market Statistics, 2022-2032F
6.3.1.Market Size & Growth Outlook
6.3.1.1. By Revenues in US$ Million
6.3.2.Market Segmentation & Growth Outlook
6.3.2.1. By Offering- Market Insights and Forecast 2022-2032, USD Million
6.3.2.2. By Application- Market Insights and Forecast 2022-2032, USD Million
6.4. Canada Smart Agriculture Market Statistics, 2022-2032F
6.4.1.Market Size & Growth Outlook
6.4.1.1. By Revenues in US$ Million
6.4.2.Market Segmentation & Growth Outlook
6.4.2.1. By Offering- Market Insights and Forecast 2022-2032, USD Million
6.4.2.2. By Application- Market Insights and Forecast 2022-2032, USD Million
6.5. Mexico Smart Agriculture Market Statistics, 2022-2032F
6.5.1.Market Size & Growth Outlook
6.5.1.1. By Revenues in US$ Million
6.5.2.Market Segmentation & Growth Outlook
6.5.2.1. By Offering- Market Insights and Forecast 2022-2032, USD Million
6.5.2.2. By Application- Market Insights and Forecast 2022-2032, USD Million
7. Latin America Smart Agriculture Market Statistics, 2022-2032F
7.1. Market Size & Growth Outlook
7.1.1.By Revenues in US$ Million
7.2. Market Segmentation & Growth Outlook
7.2.1.By Offering- Market Insights and Forecast 2022-2032, USD Million
7.2.2.By Application- Market Insights and Forecast 2022-2032, USD Million
7.2.3.By Agriculture Type- Market Insights and Forecast 2022-2032, USD Million
7.2.4.By Farm Size- Market Insights and Forecast 2022-2032, USD Million
7.2.5.By Country
7.2.5.1. Brazil
7.2.5.2. Rest of Latin America
7.3. Brazil Smart Agriculture Market Statistics, 2022-2032F
7.3.1.Market Size & Growth Outlook
7.3.1.1. By Revenues in US$ Million
7.3.2.Market Segmentation & Growth Outlook
7.3.2.1. By Offering- Market Insights and Forecast 2022-2032, USD Million
7.3.2.2. By Application- Market Insights and Forecast 2022-2032, USD Million
8. Europe Smart Agriculture Market Statistics, 2022-2032F
8.1. Market Size & Growth Outlook
8.1.1.By Revenues in US$ Million
8.2. Market Segmentation & Growth Outlook
8.2.1.By Offering- Market Insights and Forecast 2022-2032, USD Million
8.2.2.By Application- Market Insights and Forecast 2022-2032, USD Million
8.2.3.By Agriculture Type- Market Insights and Forecast 2022-2032, USD Million
8.2.4.By Farm Size- Market Insights and Forecast 2022-2032, USD Million
8.2.5.By Country
8.2.5.1. UK
8.2.5.2. Germany
8.2.5.3. France
8.2.5.4. Netherlands
8.2.5.5. Belgium
8.2.5.6. Russia
8.2.5.7. Poland
8.2.5.8. Rest of Europe
8.3. UK Smart Agriculture Market Statistics, 2022-2032F
8.3.1.Market Size & Growth Outlook
8.3.1.1. By Revenues in US$ Million
8.3.2.Market Segmentation & Growth Outlook
8.3.2.1. By Offering- Market Insights and Forecast 2022-2032, USD Million
8.3.2.2. By Application- Market Insights and Forecast 2022-2032, USD Million
8.4. Germany Smart Agriculture Market Statistics, 2022-2032F
8.4.1.Market Size & Growth Outlook
8.4.1.1. By Revenues in US$ Million
8.4.2.Market Segmentation & Growth Outlook
8.4.2.1. By Offering- Market Insights and Forecast 2022-2032, USD Million
8.4.2.2. By Application- Market Insights and Forecast 2022-2032, USD Million
8.5. France Smart Agriculture Market Statistics, 2022-2032F
8.5.1.Market Size & Growth Outlook
8.5.1.1. By Revenues in US$ Million
8.5.2.Market Segmentation & Growth Outlook
8.5.2.1. By Offering- Market Insights and Forecast 2022-2032, USD Million
8.5.2.2. By Application- Market Insights and Forecast 2022-2032, USD Million
8.6. Netherlands Smart Agriculture Market Statistics, 2022-2032F
8.6.1.Market Size & Growth Outlook
8.6.1.1. By Revenues in US$ Million
8.6.2.Market Segmentation & Growth Outlook
8.6.2.1. By Offering- Market Insights and Forecast 2022-2032, USD Million
8.6.2.2. By Application- Market Insights and Forecast 2022-2032, USD Million
8.7. Belgium Smart Agriculture Market Statistics, 2022-2032F
8.7.1.Market Size & Growth Outlook
8.7.1.1. By Revenues in US$ Million
8.7.2.Market Segmentation & Growth Outlook
8.7.2.1. By Offering- Market Insights and Forecast 2022-2032, USD Million
8.7.2.2. By Application- Market Insights and Forecast 2022-2032, USD Million
8.8. Russia Smart Agriculture Market Statistics, 2022-2032F
8.8.1.Market Size & Growth Outlook
8.8.1.1. By Revenues in US$ Million
8.8.2.Market Segmentation & Growth Outlook
8.8.2.1. By Offering- Market Insights and Forecast 2022-2032, USD Million
8.8.2.2. By Application- Market Insights and Forecast 2022-2032, USD Million
8.9. Poland Smart Agriculture Market Statistics, 2022-2032F
8.9.1.Market Size & Growth Outlook
8.9.1.1. By Revenues in US$ Million
8.9.2.Market Segmentation & Growth Outlook
8.9.2.1. By Offering- Market Insights and Forecast 2022-2032, USD Million
8.9.2.2. By Application- Market Insights and Forecast 2022-2032, USD Million
9. Middle East & Africa Smart Agriculture Market Statistics, 2022-2032F
9.1. Market Size & Growth Outlook
9.1.1.By Revenues in US$ Million
9.2. Market Segmentation & Growth Outlook
9.2.1.By Offering- Market Insights and Forecast 2022-2032, USD Million
9.2.2.By Application- Market Insights and Forecast 2022-2032, USD Million
9.2.3.By Agriculture Type- Market Insights and Forecast 2022-2032, USD Million
9.2.4.By Farm Size- Market Insights and Forecast 2022-2032, USD Million
9.2.5.By Country
9.2.5.1. UAE
9.2.5.2. Israel
9.2.5.3. Saudi Arabia
9.2.5.4. Turkey
9.2.5.5. Rest of Middle East & Africa
9.3. UAE Smart Agriculture Market Statistics, 2022-2032F
9.3.1.Market Size & Growth Outlook
9.3.1.1. By Revenues in US$ Million
9.3.2.Market Segmentation & Growth Outlook
9.3.2.1. By Offering- Market Insights and Forecast 2022-2032, USD Million
9.3.2.2. By Application- Market Insights and Forecast 2022-2032, USD Million
9.4. Israel Smart Agriculture Market Statistics, 2022-2032F
9.4.1.Market Size & Growth Outlook
9.4.1.1. By Revenues in US$ Million
9.4.2.Market Segmentation & Growth Outlook
9.4.2.1. By Offering- Market Insights and Forecast 2022-2032, USD Million
9.4.2.2. By Application- Market Insights and Forecast 2022-2032, USD Million
9.5. Saudi Arabia Smart Agriculture Market Statistics, 2022-2032F
9.5.1.Market Size & Growth Outlook
9.5.1.1. By Revenues in US$ Million
9.5.2.Market Segmentation & Growth Outlook
9.5.2.1. By Offering- Market Insights and Forecast 2022-2032, USD Million
9.5.2.2. By Application- Market Insights and Forecast 2022-2032, USD Million
9.6. Turkey Smart Agriculture Market Statistics, 2022-2032F
9.6.1.Market Size & Growth Outlook
9.6.1.1. By Revenues in US$ Million
9.6.2.Market Segmentation & Growth Outlook
9.6.2.1. By Offering- Market Insights and Forecast 2022-2032, USD Million
9.6.2.2. By Application- Market Insights and Forecast 2022-2032, USD Million
10. Asia-Pacific Smart Agriculture Market Statistics, 2022-2032F
10.1. Market Size & Growth Outlook
10.1.1. By Revenues in US$ Million
10.2. Market Segmentation & Growth Outlook
10.2.1. By Offering- Market Insights and Forecast 2022-2032, USD Million
10.2.2. By Application- Market Insights and Forecast 2022-2032, USD Million
10.2.3. By Agriculture Type- Market Insights and Forecast 2022-2032, USD Million
10.2.4. By Farm Size- Market Insights and Forecast 2022-2032, USD Million
10.2.5. By Country
10.2.5.1. China
10.2.5.2. India
10.2.5.3. Japan
10.2.5.4. Australia
10.2.5.5. Southeast Asia
10.2.5.6. Rest of Asia-Pacific
10.3. China Smart Agriculture Market Statistics, 2022-2032F
10.3.1. Market Size & Growth Outlook
10.3.1.1. By Revenues in US$ Million
10.3.2. Market Segmentation & Growth Outlook
10.3.2.1. By Offering- Market Insights and Forecast 2022-2032, USD Million
10.3.2.2. By Application- Market Insights and Forecast 2022-2032, USD Million
10.4. India Smart Agriculture Market Statistics, 2022-2032F
10.4.1. Market Size & Growth Outlook
10.4.1.1. By Revenues in US$ Million
10.4.2. Market Segmentation & Growth Outlook
10.4.2.1. By Offering- Market Insights and Forecast 2022-2032, USD Million
10.4.2.2. By Application- Market Insights and Forecast 2022-2032, USD Million
10.5. Japan Smart Agriculture Market Statistics, 2022-2032F
10.5.1. Market Size & Growth Outlook
10.5.1.1. By Revenues in US$ Million
10.5.2. Market Segmentation & Growth Outlook
10.5.2.1. By Offering- Market Insights and Forecast 2022-2032, USD Million
10.5.2.2. By Application- Market Insights and Forecast 2022-2032, USD Million
10.6. Australia Smart Agriculture Market Statistics, 2022-2032F
10.6.1. Market Size & Growth Outlook
10.6.1.1. By Revenues in US$ Million
10.6.2. Market Segmentation & Growth Outlook
10.6.2.1. By Offering- Market Insights and Forecast 2022-2032, USD Million
10.6.2.2. By Application- Market Insights and Forecast 2022-2032, USD Million
10.7. Southeast Asia Smart Agriculture Market Statistics, 2022-2032F
10.7.1. Market Size & Growth Outlook
10.7.1.1. By Revenues in US$ Million
10.7.2. Market Segmentation & Growth Outlook
10.7.2.1. By Offering- Market Insights and Forecast 2022-2032, USD Million
10.7.2.2. By Application- Market Insights and Forecast 2022-2032, USD Million
11. Competitive Outlook
11.1. Company Profiles
11.1.1. Deere & Company
11.1.1.1. Business Description
11.1.1.2. Product Portfolio
11.1.1.3. Collaborations & Alliances
11.1.1.4. Recent Developments
11.1.1.5. Financial Details
11.1.1.6. Others
11.1.2. Trimble Inc.
11.1.2.1. Business Description
11.1.2.2. Product Portfolio
11.1.2.3. Collaborations & Alliances
11.1.2.4. Recent Developments
11.1.2.5. Financial Details
11.1.2.6. Others
11.1.3. AGCO Corporation
11.1.3.1. Business Description
11.1.3.2. Product Portfolio
11.1.3.3. Collaborations & Alliances
11.1.3.4. Recent Developments
11.1.3.5. Financial Details
11.1.3.6. Others
11.1.4. CNH Industrial
11.1.4.1. Business Description
11.1.4.2. Product Portfolio
11.1.4.3. Collaborations & Alliances
11.1.4.4. Recent Developments
11.1.4.5. Financial Details
11.1.4.6. Others
11.1.5. Raven Industries
11.1.5.1. Business Description
11.1.5.2. Product Portfolio
11.1.5.3. Collaborations & Alliances
11.1.5.4. Recent Developments
11.1.5.5. Financial Details
11.1.5.6. Others
11.1.6. CLAAS KGaA mbH
11.1.6.1. Business Description
11.1.6.2. Product Portfolio
11.1.6.3. Collaborations & Alliances
11.1.6.4. Recent Developments
11.1.6.5. Financial Details
11.1.6.6. Others
11.1.7. Topcon Positioning Systems
11.1.7.1. Business Description
11.1.7.2. Product Portfolio
11.1.7.3. Collaborations & Alliances
11.1.7.4. Recent Developments
11.1.7.5. Financial Details
11.1.7.6. Others
11.1.8. BASF (xarvio®)
11.1.8.1. Business Description
11.1.8.2. Product Portfolio
11.1.8.3. Collaborations & Alliances
11.1.8.4. Recent Developments
11.1.8.5. Financial Details
11.1.8.6. Others
11.1.9. DeLaval Inc.
11.1.9.1. Business Description
11.1.9.2. Product Portfolio
11.1.9.3. Collaborations & Alliances
11.1.9.4. Recent Developments
11.1.9.5. Financial Details
11.1.9.6. Others
11.1.10. AG Leader Technology
11.1.10.1.Business Description
11.1.10.2.Product Portfolio
11.1.10.3.Collaborations & Alliances
11.1.10.4.Recent Developments
11.1.10.5.Financial Details
11.1.10.6.Others
11.1.11. AgJunction, Inc.
11.1.11.1.Business Description
11.1.11.2.Product Portfolio
11.1.11.3.Collaborations & Alliances
11.1.11.4.Recent Developments
11.1.11.5.Financial Details
11.1.11.6.Others
11.1.12. Precision Planting, Inc.
11.1.12.1.Business Description
11.1.12.2.Product Portfolio
11.1.12.3.Collaborations & Alliances
11.1.12.4.Recent Developments
11.1.12.5.Financial Details
11.1.12.6.Others
11.1.13. DroneDeploy
11.1.13.1.Business Description
11.1.13.2.Product Portfolio
11.1.13.3.Collaborations & Alliances
11.1.13.4.Recent Developments
11.1.13.5.Financial Details
11.1.13.6.Others
11.1.14. BouMatic Robotic B.V.
11.1.14.1.Business Description
11.1.14.2.Product Portfolio
11.1.14.3.Collaborations & Alliances
11.1.14.4.Recent Developments
11.1.14.5.Financial Details
11.1.14.6.Others
11.1.15. Autonomous Solutions, Inc.
11.1.15.1.Business Description
11.1.15.2.Product Portfolio
11.1.15.3.Collaborations & Alliances
11.1.15.4.Recent Developments
11.1.15.5.Financial Details
11.1.15.6.Others
12. Disclaimer
| Segment | Sub-Segment |
|---|---|
| By Offering |
|
| By Application |
|
| By Agriculture Type |
|
| By Farm Size |
|
| By Region |
|
Research Methodology
This study followed a structured approach comprising four key phases to assess the size and scope of the electro-oxidation market. The process began with thorough secondary research to collect data on the target market, related markets, and broader industry context. These findings, along with preliminary assumptions and estimates, were then validated through extensive primary research involving industry experts from across the value chain. To calculate the overall market size, both top-down and bottom-up methodologies were employed. Finally, market segmentation and data triangulation techniques were applied to refine and validate segment-level estimations.
Secondary Research
The secondary research phase involved gathering data from a wide range of credible and published sources. This step helped in identifying industry trends, defining market segmentation, and understanding the market landscape and value chain.
Sources consulted during this phase included:
- Company annual reports, investor presentations, and press releases
- Industry white papers and certified publications
- Trade directories and market-recognized databases
- Articles from authoritative authors and reputable journals
- Gold and silver standard websites
Secondary research was critical in mapping out the industry's value chain and monetary flow, identifying key market segments, understanding regional variations, and tracking significant industry developments.
Other key sources:
- Financial disclosures
- Industry associations and trade bodies
- News outlets and business magazines
- Academic journals and research studies
- Paid industry databases
Primary Research
To validate secondary data and gain deeper market insights, primary research was conducted with key stakeholders across both the supply and demand sides of the market.
On the demand side, participants included decision-makers and influencers from end-user industries—such as CIOs, CTOs, and CSOs—who provided first-hand perspectives on market needs, product usage, and future expectations.
On the supply side, interviews were conducted with manufacturers, industry associations, and institutional participants to gather insights into current offerings, product pipelines, and market challenges.
Primary interviews provided critical inputs such as:
- Market size and revenue data
- Product and service breakdowns
- Market forecasts
- Regional and application-specific trends
Stakeholders consulted included:
- Leading OEM and solution providers
- Channel and distribution partners
- End users across various applications
- Independent consultants and industry specialists
Market Size Estimation and Data Triangulation
- Identifying Key Market Participants (Secondary Research)
- Goal: To identify the major players or companies in the target market. This typically involves using publicly available data sources such as industry reports, market research publications, and financial statements of companies.
- Tools: Reports from firms like Gartner, Forrester, Euromonitor, Statista, IBISWorld, and others. Public financial statements, news articles, and press releases from top market players.
- Extracting Earnings of Key Market Participants
- Goal: To estimate the earnings generated from the product or service being analyzed. This step helps in understanding the revenue potential of each market player in a specific geography.
- Methods: Earnings data can be gathered from:
- Publicly available financial reports (for listed companies).
- Interviews and primary data sources from professionals, such as Directors, VPs, SVPs, etc. This is especially useful for understanding more nuanced, internal data that isn't publicly disclosed.
- Annual reports and investor presentations of key players.
- Data Collation and Development of a Relevant Data Model
- Goal: To collate inputs from both primary and secondary sources into a structured, data-driven model for market estimation. This model will incorporate key market KPIs and any independent variables relevant to the market.
- Key KPIs: These could include:
- Market size, growth rate, and demand drivers.
- Industry-specific metrics like market share, average revenue per customer (ARPC), or average deal size.
- External variables, such as economic growth rates, inflation rates, or commodity prices, that could affect the market.
- Data Modeling: Based on this data, the market forecasts are developed for the next 5 years. A combination of trend analysis, scenario modeling, and statistical regression might be used to generate projections.
- Scenario Analysis
- Goal: To test different assumptions and validate how sensitive the market is to changes in key variables (e.g., market demand, regulatory changes, technological disruptions).
- Types of Scenarios:
- Base Case: Based on current assumptions and historical data.
- Best-Case Scenario: Assuming favorable market conditions, regulatory environments, and technological advancements.
- Worst-Case Scenario: Accounting for adverse factors, such as economic downturns, stricter regulations, or unexpected disruptions.


