Norway Weight Management and Wellbeing Market Report: Trends, Growth and Forecast (2026-2032)
By Category (Meal Replacement Products (Shakes, Bars, Ready-to-Drink (RTD) Beverages, Powder Mixes), OTC Obesity Products (Fat Absorption Inhibitors, Appetite Suppressants, Metabolism Boosters), Supplement Nutrition Drinks, Slimming Teas, Weight Loss Supplements), By Application (Obesity Management, Diabetes-Associated Weight Control, Cardiovascular Risk Reduction, Post-Bariatric Surgery Weight Maintenance, General Fitness & Lifestyle Weight Control), By End User (Hospitals, Specialty & Bariatric Clinics, Weight Loss Centers, Homecare/Individual Consumers), By Sales Channel (Retail Offline (Pharmacies & Drug Stores, Supermarkets/Hypermarkets, Specialty Nutrition Stores), Retail Online (E-commerce Platforms, Brand-Owned Websites)) ... Read more
|
Major Players
|
Norway Weight Management and Wellbeing Market Statistics and Insights, 2026
- Market Size Statistics
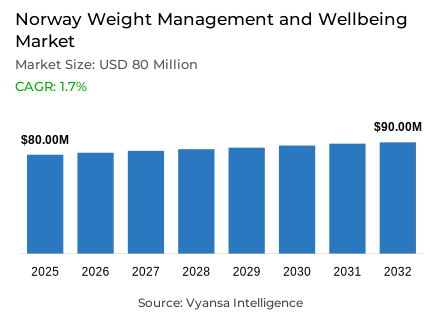
- Weight management and wellbeing market size in Norway was estimated at USD 80 million in 2025.
- The market size is expected to grow to USD 90 million by 2032.
- Market to register a CAGR of around 1.7% during 2026-32.
- Category Shares
- Meal replacement products grabbed market share of 51%.
- Competition
- More than 15 companies are actively engaged in producing weight management and wellbeing in Norway.
- Top 5 companies acquired around 80% of the market share.
- Perrigo Norge AS, Noka AS, Med-Eq AS, Nutricia Norway AS, Orkla Health AS etc., are few of the top companies.
- Sales Channel
- Retail offline grabbed 90% of the market.
Norway Weight Management and Wellbeing Market Outlook
The Norway weight management and wellbeing market size was valued at USD 80 million in 2025 and is projected to grow from USD 82 million in 2026 to USD 90 million by 2032, registering a CAGR of around 1.7% during 2026-32. A key driver in 2026 is the high prevalence of excess weight. Nordic Monitoring (NORMO) reports that 52.5% of adults have overweight or obesity (BMI ≥25), including 16.2% with obesity (BMI ≥30). Mean BMI stands at 25.8 kg/m², with waist circumference averaging 88.8 cm for men and 80.6 cm for women. This scale keeps prevention and self-management central to everyday health behaviour.
A major challenge for weight management and wellbeing is the strong shift toward prescription-led weight loss. The Norwegian Institute of Public Health (FHI) reports that in 2024 over 172,000 adults aged 18–79 collected at least one prescription weight-reducing medicine, equal to 5.9% of women and 2.3% of men. Newer GLP-1 medicines are driving this transition, raising expectations for clinically proven outcomes and placing pressure on traditional offerings to demonstrate clear efficacy and safety.
A clear trend in 2026 is routine-based physical activity rather than short-term dieting. NORMO shows 29.8% of adult men and 29.8% of adult women do not meet WHO 2020 physical activity guidelines. Moderate-to-vigorous activity averages 6.0 hours per week for men and 5.1 hours for women, reflecting structured weekly movement habits that favour consistency-focused solutions.
An opportunity lies in alignment with national diet policy. The Norwegian Directorate of Health confirms that 96 organisations are signed up to the healthier diet partnership as of November 2025. By segmentation, meal replacement products hold 51% share due to portion control appeal, while retail offline leads with 90% share, reflecting trust-led purchasing through established physical retail channels.

Norway Weight Management and Wellbeing Market Growth DriverHigh Overweight Burden Keeps Weight Control Relevant
Norway enters 2026 with a large underlying need for weight control. Nordic Council of Ministers’ Nordic Monitoring (NORMO) data for 2024 shows 52.5% of Norwegian adults have overweight or obesity (BMI ≥25), and 16.2% have obesity (BMI ≥30). The same dataset reports a mean BMI of 25.8 kg/m² and mean waist circumference of 88.8 cm (men) and 80.6 cm (women).
With excess weight this widespread, weight management stays a practical wellbeing priority rather than a “nice to have”. It also keeps prevention and self-management high on the public-health agenda. This reality sustains demand for credible, long-term support built around diet quality, routine physical activity and behaviour change especially solutions that feel evidence-led and compatible with everyday life.
Norway Weight Management and Wellbeing Market ChallengePrescription Therapies Raise the Bar for Results
In Norway, prescription-led weight loss is now a major force shaping how people think about “what works”. The Norwegian Institute of Public Health (FHI) reports that in 2024, over 172,000 individuals aged 18–79 collected at least one prescription weight reducing medicine during the year, equal to 5.9% of women and 2.3% of men in that age group.
This scale of use pushes end user expectations toward clinically proven outcomes and medical oversight. FHI also notes that newer GLP‑1 medicines drive the shift, while use of older, less effective weight‑reducing drugs falls. For traditional weight management and wellbeing products, this creates a tough value challenge: they must justify efficacy, safety and price against solutions that are perceived as “medical‑grade”.
Unlock Market Intelligence
Explore the market potential with our data-driven report
Norway Weight Management and Wellbeing Market TrendRoutine Physical Activity Anchors Everyday Weight Control
Norwegians increasingly approach weight control through day‑to‑day routines, not short “detox” cycles.As a result, the Norwegian data from the NORMO survey illustrates a common problem: 29.8% of men and 29.8% of women are not currently meeting the WHO 2020 physical activity recommendations. Therefore, regular exercise becomes a quantified component of health for the average Norwegian citizen.
If we drill down into the data, the average amount of time spent exercising for men who report moderate to vigorous physical activity is 6.0 hours, while for women, the average amount of time spent exercising is 5.1 hours per week. In addition, men also spend 2.1 hours per week walking and cycling, while women spend 2.9 hours per week walking and cycling. Once exercise becomes a planned component of one’s life, the focus shifts from band-aid solutions to more sustainable solutions such as data tracking, coaching, and habit formation.
Norway Weight Management and Wellbeing Market OpportunityPolicy Push for Healthier Diets Creates Space for Credible Solutions
As Norway enters 2026, diet becomes a critical component of long-term weight management, and policy work continues to make healthy choices easier for the average citizen. For example, the Norwegian Directorate of Health’s update from the 2025 report regarding the nation’s healthier diet partnership illustrates that 96 businesses and organizations have signed up by the end of November 2025.
As a result, the opportunity for the weight management/wellness industry becomes a way to align one’s product and marketing strategies towards the betterment of the average citizen, such as reducing salt, sugar, and saturated fats, and increasing the amount of fruit, vegetables, fish, and whole grains, rather than the current pursuit of the ‘miracle’ solution. When industry commitments are visible at national level, brands that can document nutrition credentials and communicate simply are better placed to win trust in a market that is increasingly sceptical of quick fixes.
Unlock Market Intelligence
Explore the market potential with our data-driven report
Norway Weight Management and Wellbeing Market Segmentation Analysis
By Category
- Meal Replacement Products
- Shakes
- Bars
- Ready-to-Drink (RTD) Beverages
- Powder Mixes
- OTC Obesity Products
- Fat Absorption Inhibitors
- Appetite Suppressants
- Metabolism Boosters
- Supplement Nutrition Drinks
- Slimming Teas
- Weight Loss Supplements
The segment has the highest share under the product type segmentation, and the highest market share is of meal replacement products, accounting for 51% of the market. This dominance is typically linked to the clear “use-case” of these products, structured portions, calorie visibility, and an easy substitute for breakfast or lunch making them simpler to follow than broader wellbeing aids. Their portable formats also fit busy workdays and on‑the‑go routines.
The remaining demand is distributed across other weight management formats such as supplement-style products and supportive wellbeing items, which are often used more intermittently and depend heavily on perceived credibility. In practice, end users tend to stick with formats that feel routine-friendly and results-oriented, especially when taste and satiety are strong.

By Sales Channel
- Retail Offline
- Pharmacies & Drug Stores
- Supermarkets/Hypermarkets
- Specialty Nutrition Stores
- Retail Online
- E-commerce Platforms
- Brand-Owned Websites
The segment has the highest share under the sales channel segmentation, and the highest market share is of retail offline, capturing 90% of the market. For many shoppers, offline purchase still feels more straightforward: it allows quick comparison, immediate availability, and the reassurance of buying from established retail environments rather than depending on delivery and returns. Offline also supports impulse buys and routine re‑stocking.
That said, the remaining share sits with online routes that are mainly used for convenience, wider assortment, or more private purchasing. As digital discovery increases, end users often research products online even when the final purchase happens in-store. This split suggests that visibility and shelf readiness remain critical, while online content supports consideration and brand credibility.
List of Companies Covered in Norway Weight Management and Wellbeing Market
The companies listed below are highly influential in the Norway weight management and wellbeing market, with a significant market share and a strong impact on industry developments.
- Perrigo Norge AS
- Noka AS
- Med-Eq AS
- Nutricia Norway AS
- Orkla Health AS
- Herbalife Norway Products AS
- Fresenius Kabi Norge AS
- Midsona Norge AS
- Karo Healthcare AS
- Nestle Norge AS
Competitive Landscape
In 2025, the competitive landscape of weight management and wellbeing in Norway remains subdued, with Nutricia Norway AS leading at 26.4% value share, followed by Orkla Health AS at 21.6%. Nutricia continues to strengthen its position through its flagship brand and pharmacy-led distribution, benefiting from credibility in nutritional support solutions. Orkla Health maintains a solid presence via its Nutrilett brand, particularly within grocery retail, although shelf space for the category is gradually contracting. Fresenius Kabi Norge AS is emerging as the most dynamic player, expanding share through its Fresubin portfolio of oral nutritional supplements. Competitive pressures are intensifying as prescription weight loss medications such as Ozempic and adjacent categories like RTD protein beverages and protein bars divert demand. Structural challenges persist, particularly declining direct selling relevance amid entrenched consumer scepticism, while pharmacies and retail e-commerce consolidate their importance as trusted and discreet purchasing channels.
Frequently Asked Questions
Related Report
- Market Segmentation
- Research Scope
- Research Methodology
- Definitions and Assumptions
- Executive Summary
- Norway Weight Management and Wellbeing Market Policies, Regulations, and Standards
- Norway Weight Management and Wellbeing Market Dynamics
- Growth Factors
- Challenges
- Trends
- Opportunities
- Norway Weight Management and Wellbeing Market Statistics, 2022-2032F
- Market Size & Growth Outlook
- By Revenues in USD Million
- Market Segmentation & Growth Outlook
- By Category
- Meal Replacement Products- Market Insights and Forecast 2022-2032, USD Million
- Shakes- Market Insights and Forecast 2022-2032, USD Million
- Bars- Market Insights and Forecast 2022-2032, USD Million
- Ready-to-Drink (RTD) Beverages- Market Insights and Forecast 2022-2032, USD Million
- Powder Mixes- Market Insights and Forecast 2022-2032, USD Million
- OTC Obesity Products- Market Insights and Forecast 2022-2032, USD Million
- Fat Absorption Inhibitors- Market Insights and Forecast 2022-2032, USD Million
- Appetite Suppressants- Market Insights and Forecast 2022-2032, USD Million
- Metabolism Boosters- Market Insights and Forecast 2022-2032, USD Million
- Supplement Nutrition Drinks- Market Insights and Forecast 2022-2032, USD Million
- Slimming Teas- Market Insights and Forecast 2022-2032, USD Million
- Weight Loss Supplements- Market Insights and Forecast 2022-2032, USD Million
- Meal Replacement Products- Market Insights and Forecast 2022-2032, USD Million
- By Application
- Obesity Management- Market Insights and Forecast 2022-2032, USD Million
- Diabetes-Associated Weight Control- Market Insights and Forecast 2022-2032, USD Million
- Cardiovascular Risk Reduction- Market Insights and Forecast 2022-2032, USD Million
- Post-Bariatric Surgery Weight Maintenance- Market Insights and Forecast 2022-2032, USD Million
- General Fitness & Lifestyle Weight Control- Market Insights and Forecast 2022-2032, USD Million
- By End User
- Hospitals- Market Insights and Forecast 2022-2032, USD Million
- Specialty & Bariatric Clinics- Market Insights and Forecast 2022-2032, USD Million
- Weight Loss Centers- Market Insights and Forecast 2022-2032, USD Million
- Homecare/Individual Consumers- Market Insights and Forecast 2022-2032, USD Million
- By Sales Channel
- Retail Offline- Market Insights and Forecast 2022-2032, USD Million
- Pharmacies & Drug Stores- Market Insights and Forecast 2022-2032, USD Million
- Supermarkets/Hypermarkets- Market Insights and Forecast 2022-2032, USD Million
- Specialty Nutrition Stores- Market Insights and Forecast 2022-2032, USD Million
- Retail Online- Market Insights and Forecast 2022-2032, USD Million
- E-commerce Platforms- Market Insights and Forecast 2022-2032, USD Million
- Brand-Owned Websites- Market Insights and Forecast 2022-2032, USD Million
- Retail Offline- Market Insights and Forecast 2022-2032, USD Million
- By Competitors
- Competition Characteristics
- Market Share & Analysis
- By Category
- Market Size & Growth Outlook
- Norway Meal Replacement Products Market Statistics, 2022-2032
- Market Size & Growth Outlook
- By Revenues in USD Million
- Market Segmentation & Growth Outlook
- By Application- Market Insights and Forecast 2022-2032, USD Million
- By End User- Market Insights and Forecast 2022-2032, USD Million
- By Sales Channel- Market Insights and Forecast 2022-2032, USD Million
- Market Size & Growth Outlook
- Norway OTC Obesity Products Market Statistics, 2022-2032
- Market Size & Growth Outlook
- By Revenues in USD Million
- Market Segmentation & Growth Outlook
- By Application- Market Insights and Forecast 2022-2032, USD Million
- By End User- Market Insights and Forecast 2022-2032, USD Million
- By Sales Channel- Market Insights and Forecast 2022-2032, USD Million
- Market Size & Growth Outlook
- Norway Supplement Nutrition Drinks Market Statistics, 2022-2032
- Market Size & Growth Outlook
- By Revenues in USD Million
- Market Segmentation & Growth Outlook
- By Application- Market Insights and Forecast 2022-2032, USD Million
- By End User- Market Insights and Forecast 2022-2032, USD Million
- By Sales Channel- Market Insights and Forecast 2022-2032, USD Million
- Market Size & Growth Outlook
- Norway Slimming Teas Market Statistics, 2022-2032
- Market Size & Growth Outlook
- By Revenues in USD Million
- Market Segmentation & Growth Outlook
- By Application- Market Insights and Forecast 2022-2032, USD Million
- By End User- Market Insights and Forecast 2022-2032, USD Million
- By Sales Channel- Market Insights and Forecast 2022-2032, USD Million
- Market Size & Growth Outlook
- Norway Weight Loss Supplements Market Statistics, 2022-2032
- Market Size & Growth Outlook
- By Revenues in USD Million
- Market Segmentation & Growth Outlook
- By Application- Market Insights and Forecast 2022-2032, USD Million
- By End User- Market Insights and Forecast 2022-2032, USD Million
- By Sales Channel- Market Insights and Forecast 2022-2032, USD Million
- Market Size & Growth Outlook
- Competitive Outlook
- Company Profiles
- Nutricia Norway AS
- Business Description
- Product Portfolio
- Collaborations & Alliances
- Recent Developments
- Financial Details
- Others
- Orkla Health AS
- Business Description
- Product Portfolio
- Collaborations & Alliances
- Recent Developments
- Financial Details
- Others
- Herbalife Norway Products AS
- Business Description
- Product Portfolio
- Collaborations & Alliances
- Recent Developments
- Financial Details
- Others
- Fresenius Kabi Norge AS
- Business Description
- Product Portfolio
- Collaborations & Alliances
- Recent Developments
- Financial Details
- Others
- Midsona Norge AS
- Business Description
- Product Portfolio
- Collaborations & Alliances
- Recent Developments
- Financial Details
- Others
- Perrigo Norge AS
- Business Description
- Product Portfolio
- Collaborations & Alliances
- Recent Developments
- Financial Details
- Others
- Noka AS
- Business Description
- Product Portfolio
- Collaborations & Alliances
- Recent Developments
- Financial Details
- Others
- Med-Eq AS
- Business Description
- Product Portfolio
- Collaborations & Alliances
- Recent Developments
- Financial Details
- Others
- Karo Healthcare AS
- Business Description
- Product Portfolio
- Collaborations & Alliances
- Recent Developments
- Financial Details
- Others
- Nestle Norge AS
- Business Description
- Product Portfolio
- Collaborations & Alliances
- Recent Developments
- Financial Details
- Others
- Nutricia Norway AS
- Company Profiles
- Disclaimer
| Segment | Sub-Segment |
|---|---|
| By Category |
|
| By Application |
|
| By End User |
|
| By Sales Channel |
|
Research Methodology
This study followed a structured approach comprising four key phases to assess the size and scope of the electro-oxidation market. The process began with thorough secondary research to collect data on the target market, related markets, and broader industry context. These findings, along with preliminary assumptions and estimates, were then validated through extensive primary research involving industry experts from across the value chain. To calculate the overall market size, both top-down and bottom-up methodologies were employed. Finally, market segmentation and data triangulation techniques were applied to refine and validate segment-level estimations.
Secondary Research
The secondary research phase involved gathering data from a wide range of credible and published sources. This step helped in identifying industry trends, defining market segmentation, and understanding the market landscape and value chain.
Sources consulted during this phase included:
- Company annual reports, investor presentations, and press releases
- Industry white papers and certified publications
- Trade directories and market-recognized databases
- Articles from authoritative authors and reputable journals
- Gold and silver standard websites
Secondary research was critical in mapping out the industry's value chain and monetary flow, identifying key market segments, understanding regional variations, and tracking significant industry developments.
Other key sources:
- Financial disclosures
- Industry associations and trade bodies
- News outlets and business magazines
- Academic journals and research studies
- Paid industry databases
Primary Research
To validate secondary data and gain deeper market insights, primary research was conducted with key stakeholders across both the supply and demand sides of the market.
On the demand side, participants included decision-makers and influencers from end-user industries—such as CIOs, CTOs, and CSOs—who provided first-hand perspectives on market needs, product usage, and future expectations.
On the supply side, interviews were conducted with manufacturers, industry associations, and institutional participants to gather insights into current offerings, product pipelines, and market challenges.
Primary interviews provided critical inputs such as:
- Market size and revenue data
- Product and service breakdowns
- Market forecasts
- Regional and application-specific trends
Stakeholders consulted included:
- Leading OEM and solution providers
- Channel and distribution partners
- End users across various applications
- Independent consultants and industry specialists
Market Size Estimation and Data Triangulation
- Identifying Key Market Participants (Secondary Research)
- Goal: To identify the major players or companies in the target market. This typically involves using publicly available data sources such as industry reports, market research publications, and financial statements of companies.
- Tools: Reports from firms like Gartner, Forrester, Euromonitor, Statista, IBISWorld, and others. Public financial statements, news articles, and press releases from top market players.
- Extracting Earnings of Key Market Participants
- Goal: To estimate the earnings generated from the product or service being analyzed. This step helps in understanding the revenue potential of each market player in a specific geography.
- Methods: Earnings data can be gathered from:
- Publicly available financial reports (for listed companies).
- Interviews and primary data sources from professionals, such as Directors, VPs, SVPs, etc. This is especially useful for understanding more nuanced, internal data that isn't publicly disclosed.
- Annual reports and investor presentations of key players.
- Data Collation and Development of a Relevant Data Model
- Goal: To collate inputs from both primary and secondary sources into a structured, data-driven model for market estimation. This model will incorporate key market KPIs and any independent variables relevant to the market.
- Key KPIs: These could include:
- Market size, growth rate, and demand drivers.
- Industry-specific metrics like market share, average revenue per customer (ARPC), or average deal size.
- External variables, such as economic growth rates, inflation rates, or commodity prices, that could affect the market.
- Data Modeling: Based on this data, the market forecasts are developed for the next 5 years. A combination of trend analysis, scenario modeling, and statistical regression might be used to generate projections.
- Scenario Analysis
- Goal: To test different assumptions and validate how sensitive the market is to changes in key variables (e.g., market demand, regulatory changes, technological disruptions).
- Types of Scenarios:
- Base Case: Based on current assumptions and historical data.
- Best-Case Scenario: Assuming favorable market conditions, regulatory environments, and technological advancements.
- Worst-Case Scenario: Accounting for adverse factors, such as economic downturns, stricter regulations, or unexpected disruptions.


