Norway Analgesics Market Report: Trends, Growth and Forecast (2026-2032)
By Product (Systemic Analgesics (Adult Analgesics, Paediatric Analgesics, Combined Systemic Analgesics), Topical Analgesics/Anaesthetic), By Drug Type (Opioid Analgesics (Strong Opioids, Weak Opioids), Non-opioid Analgesics (Acetaminophen, Aspirin, Combination Products, Diclofenac, Dipyrone, Ibuprofen, Ketoprofen, Naproxen, OTC Triptans), Compound/Combination Analgesics (Opioid + Non-Opioid Combinations, Multi-Ingredient Non-Opioid Combinations)), By Route of Administration (Oral, Parenteral/Injectable, Topical/External, Transdermal, Rectal/Other), By Pain Type (Acute Pain, Chronic Pain, Breakthrough Pain), By Application (Surgical & Post-operative Pain, Musculoskeletal Pain, Neuropathic Pain, Cancer Pain, Migraine/Headache, Dental Pain, Others), By Sales Channel (Retail Offline (Offline Pharmacies, Hospital Pharmacies), Retail Online (Online Pharmacies)), By Prescription Type (Prescription, OTC), By Formulation (Tablets, Capsules, Liquids, Injectables, Gels/Creams, Patches), By End User (Hospitals, Clinics/ASCs, Homecare) ... Read more
|
Major Players
|
Norway Analgesics Market Statistics and Insights, 2026
- Market Size Statistics
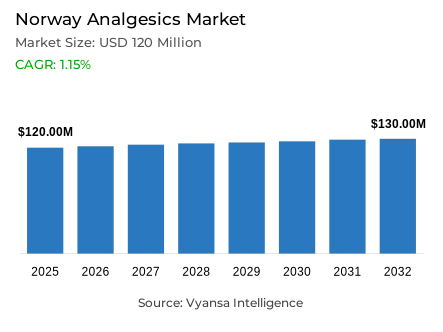
- Analgesics market size in Norway was valued at USD 120 million in 2025 and is estimated at USD 122 million in 2026.
- The market size is expected to grow to USD 130 million by 2032.
- Market to register a CAGR of around 1.15% during 2026-32.
- Product Shares
- Systemic analgesics grabbed market share of 75%.
- Competition
- More than 5 companies are actively engaged in producing analgesics in Norway.
- Top 5 companies acquired around 90% of the market share.
- Bonaventura Sales AS, Bayer AS, Stada Nordic ApS, Karo Pharma AS, Haleon Norway AS etc., are few of the top companies.
- Sales Channel
- Retail offline grabbed 85% of the market.
Norway Analgesics Market Outlook
The Norway analgesics market size is estimated to be USD 120 million in 2025 and is expected to increase by USD 122 million in 2026 to USD 130 million in 2032 with a CAGR of 1.15% over the forecast period. The growth is stable since the pain relief products will still enjoy the advantage of stable household demand due to recurrent self care needs and frequent use of mild to moderate discomfort.
The ageing population of the country continues to support demand as the need to manage pain is evident in everyday life. The elderly tend to have more joint pains, back pains, and other recurrent pains, which contributes to the continuity of using common analgesics to provide practical and reliable relief of the symptoms. Daily activities also contribute to this load, particularly in muscle fatigue, sprains, and joint pain associated with outdoor activities and daily movement.
Systemic analgesics have the highest share of approximately 75% by product, which is backed by the fact that oral pain relief products continue to be popular in treating headaches, fever, and other common ailments that consumers would like to treat fast and easily. Meanwhile, price sensitivity is also significant since these products are purchased repeatedly and consumers are aware of the price differences between channels. In conjunction with this, more intensive utilization of digital tools is influencing the way analgesics are studied and compared prior to purchase, despite the fact that the patterns of product use may remain largely the same.
Through sales channel, retail offline dominates with approximately 85% share since physical pharmacies and grocery stores are still the most preferred outlets to purchase analgesics due to easy access, instant purchase and reliable guidance. Store based purchasing is still at the center of the stage when relief is required immediately, whereas digital comparison is slowly shaping the purchasing decisions by making the consumer more conscious of the price differences among the retailers and formats.

Norway Analgesics Market Growth DriverAgeing Supports Steady Pain Relief Use
An aging population is favorable to the demand of analgesics in Norway. The elderly are more prone to joint pain, back pain, and other chronic pains, and this makes everyday pain relief still pertinent in daily self care. This helps in maintaining consistent consumption of well known analgesic products that are relied upon to provide reliable and practical symptom relief.
According to the age by age population table of 1 January 2026 of Statistics Norway, there are approximately 1.09 million individuals aged 65 and above in Norway. According to statistics Norway, the life expectancy at age 65 is also 20.85 years higher in 2025. This age distribution makes the pain management requirements visible in the nation.
Norway Analgesics Market ChallengePrice Gaps Keep Value-for-Money Important
The issue of price sensitivity is still a major problem with analgesics in Norway. Pain relief products are purchased repeatedly, and thus consumers are sensitive to price differences and more likely to compare prices across channels. This complicates the ability of more expensive products to expand demand, particularly in a category where consumers already have confidence in a small number of well known brands.
According to Statistics Norway, the consumer price index increases by 3.0% between November 2024 and November 2025. Simultaneously, the Norwegian government reports that the prices of medicine are controlled to ensure that they remain low to patients and the general population. This makes value of money central in daily medicine purchases.
Unlock Market Intelligence
Explore the market potential with our data-driven report
Norway Analgesics Market TrendDigital Comparison Shapes Buying Habits
Another trend that is more evident in Norway is the increased use of digital tools prior to purchase. Consumers are becoming more and more information seeking and comparing online, despite their continued preference to purchase via established pharmacy networks. This helps in a slow digital transformation of the way analgesics are studied and chosen, and not a significant alteration in the usage of the products.
According to Statistics Norway, 100% of individuals aged 16-79 years used the internet in the past three months, and 97% used internet banking in 2025. This very high digital participation supports more online searching, price comparison, and pharmacy website use before buying pain relief products.
Norway Analgesics Market OpportunityActive Lifestyles Create Room for Topical Relief
The active daily life provides a good opportunity to analgesics in Norway, particularly, to products that are applied to muscle pain, sprains, and joint pain. Exercise outside is still a daily routine of most individuals, and this fact contributes to the further need of topical pain relief formats that can be applied fast and locally following physical activity.
According to the Norwegian Directorate of Health (2025), half of adults comply with the physical activity recommendations. Statistics Norway also shows that, 59.1% of people aged 16 and above exercise several times a week. This high number of active consumers helps to sustain a stable topical pain relief usage.
Unlock Market Intelligence
Explore the market potential with our data-driven report
Norway Analgesics Market Segmentation Analysis
By Product
- Systemic Analgesics
- Adult Analgesics
- Paediatric Analgesics
- Combined Systemic Analgesics
- Topical Analgesics/Anaesthetic
The highest share segment under the product is systemic analgesics, which has approximately 75% of the Norway analgesics market in terms of value. This segment is leading since oral pain relief products are the most common option that consumers are used to when it comes to headaches, fever, joint pain, and other frequent discomforts that consumers wish to treat in a fast and easy way in their daily lives.
This trend is also supported by the recent official sales of analgesics. According to the Norwegian Institute of Public Health, paracetamol will be sold as approximately 60% of the OTC fever and pain medicine, and ibuprofen will be sold as approximately 30% of the OTC painkiller. This shows the continued strength of systemic products in Norway.

By Sales Channel
- Retail Offline
- Offline Pharmacies
- Hospital Pharmacies
- Retail Online
- Online Pharmacies
The retail offline segment has the largest share under sales channel, which is approximately 85% of the Norway analgesics market in value terms. This channel is the leader since consumers still choose physical pharmacies and grocery stores as the quickest way to get pain relief products, immediate purchase, and reliable advice when it comes to selecting pain relief products, particularly when they need relief without having to wait until delivery.
This offline strength is supported by the latest official channel data. According to Norwegian Institute of Public Health (FHI), 59% of OTC paracetamol volume and 38% of OTC ibuprofen volume are sold in grocery stores and grocery trade contributes approximately 35% of all OTC medicine sales. This makes store based purchasing a key point in the distribution of analgesics.
List of Companies Covered in Norway Analgesics Market
The companies listed below are highly influential in the Norway analgesics market, with a significant market share and a strong impact on industry developments.
- Bonaventura Sales AS
- Bayer AS
- Stada Nordic ApS
- Karo Pharma AS
- Haleon Norway AS
- Orifarm Healthcare AS
- Evolan Pharma AB
- Teva Norway AS
Competitive Landscape
In 2025, the Norwegian analgesics market is projected to grow in retail value terms, driven by demographic and lifestyle factors, including an ageing population, high physical activity levels, and increased screen use leading to headaches and musculoskeletal discomfort. Karo Pharma AS leads the market with a dominant 72.5% value share, primarily through its Paracet and Ibux brands, while Haleon Norway AS holds 14.7%, boosted by its Voltarol topical analgesics. Systemic analgesics, particularly paracetamol and ibuprofen, continue to account for the largest share, although a notable portion of paracetamol is now obtained via prescription. Topical analgesics are experiencing dynamic growth, supported by active lifestyles and preference for localised pain relief. Pharmacies remain the primary distribution channel, though grocery stores and retail e-commerce are gradually gaining share, with digital tools increasingly influencing price-sensitive consumers. Innovation in systemic analgesics remains limited due to the entrenched position of leading brands, while topical formats benefit from health and wellness trends, particularly among older adults. The overall market is traditional, with gradual digital adoption and continued reliance on established brands.
Frequently Asked Questions
Related Report
- Market Segmentation
- Research Scope
- Research Methodology
- Definitions and Assumptions
- Executive Summary
- Norway Analgesics Market Policies, Regulations, and Standards
- Norway Analgesics Market Dynamics
- Growth Factors
- Challenges
- Trends
- Opportunities
- Norway Analgesics Market Statistics, 2022-2032F
- Market Size & Growth Outlook
- By Revenues in USD Million
- Market Segmentation & Growth Outlook
- By Product
- Systemic Analgesics- Market Insights and Forecast 2022-2032, USD Million
- Adult Analgesics- Market Insights and Forecast 2022-2032, USD Million
- Paediatric Analgesics- Market Insights and Forecast 2022-2032, USD Million
- Combined Systemic Analgesics- Market Insights and Forecast 2022-2032, USD Million
- Topical Analgesics/Anaesthetic- Market Insights and Forecast 2022-2032, USD Million
- Systemic Analgesics- Market Insights and Forecast 2022-2032, USD Million
- By Drug Type
- Opioid Analgesics- Market Insights and Forecast 2022-2032, USD Million
- Strong Opioids- Market Insights and Forecast 2022-2032, USD Million
- Weak Opioids- Market Insights and Forecast 2022-2032, USD Million
- Non-opioid Analgesics- Market Insights and Forecast 2022-2032, USD Million
- Acetaminophen- Market Insights and Forecast 2022-2032, USD Million
- Aspirin- Market Insights and Forecast 2022-2032, USD Million
- Combination Products- Market Insights and Forecast 2022-2032, USD Million
- Diclofenac- Market Insights and Forecast 2022-2032, USD Million
- Dipyrone- Market Insights and Forecast 2022-2032, USD Million
- Ibuprofen- Market Insights and Forecast 2022-2032, USD Million
- Ketoprofen- Market Insights and Forecast 2022-2032, USD Million
- Naproxen- Market Insights and Forecast 2022-2032, USD Million
- OTC Triptans- Market Insights and Forecast 2022-2032, USD Million
- Compound/Combination Analgesics- Market Insights and Forecast 2022-2032, USD Million
- Opioid + Non-Opioid Combinations- Market Insights and Forecast 2022-2032, USD Million
- Multi-Ingredient Non-Opioid Combinations- Market Insights and Forecast 2022-2032, USD Million
- Opioid Analgesics- Market Insights and Forecast 2022-2032, USD Million
- By Route of Administration
- Oral- Market Insights and Forecast 2022-2032, USD Million
- Parenteral/Injectable- Market Insights and Forecast 2022-2032, USD Million
- Topical/External- Market Insights and Forecast 2022-2032, USD Million
- Transdermal- Market Insights and Forecast 2022-2032, USD Million
- Rectal/Other- Market Insights and Forecast 2022-2032, USD Million
- By Pain Type
- Acute Pain- Market Insights and Forecast 2022-2032, USD Million
- Chronic Pain- Market Insights and Forecast 2022-2032, USD Million
- Breakthrough Pain- Market Insights and Forecast 2022-2032, USD Million
- By Application
- Surgical & Post-operative Pain- Market Insights and Forecast 2022-2032, USD Million
- Musculoskeletal Pain- Market Insights and Forecast 2022-2032, USD Million
- Neuropathic Pain- Market Insights and Forecast 2022-2032, USD Million
- Cancer Pain- Market Insights and Forecast 2022-2032, USD Million
- Migraine/Headache- Market Insights and Forecast 2022-2032, USD Million
- Dental Pain- Market Insights and Forecast 2022-2032, USD Million
- Others- Market Insights and Forecast 2022-2032, USD Million
- By Sales Channel
- Retail Offline- Market Insights and Forecast 2022-2032, USD Million
- Offline Pharmacies- Market Insights and Forecast 2022-2032, USD Million
- Hospital Pharmacies- Market Insights and Forecast 2022-2032, USD Million
- Retail Online- Market Insights and Forecast 2022-2032, USD Million
- Online Pharmacies- Market Insights and Forecast 2022-2032, USD Million
- Retail Offline- Market Insights and Forecast 2022-2032, USD Million
- By Prescription Type
- Prescription- Market Insights and Forecast 2022-2032, USD Million
- OTC- Market Insights and Forecast 2022-2032, USD Million
- By Formulation
- Tablets- Market Insights and Forecast 2022-2032, USD Million
- Capsules- Market Insights and Forecast 2022-2032, USD Million
- Liquids- Market Insights and Forecast 2022-2032, USD Million
- Injectables- Market Insights and Forecast 2022-2032, USD Million
- Gels/Creams- Market Insights and Forecast 2022-2032, USD Million
- Patches- Market Insights and Forecast 2022-2032, USD Million
- By End User
- Hospitals- Market Insights and Forecast 2022-2032, USD Million
- Clinics/ASCs- Market Insights and Forecast 2022-2032, USD Million
- Homecare- Market Insights and Forecast 2022-2032, USD Million
- By Competitors
- Competition Characteristics
- Market Share & Analysis
- By Product
- Market Size & Growth Outlook
- Norway Systemic Analgesics Market Statistics, 2022-2032
- Market Size & Growth Outlook
- By Revenues in USD Million
- Market Segmentation & Growth Outlook
- By Drug Type- Market Insights and Forecast 2022-2032, USD Million
- By Route of Administration- Market Insights and Forecast 2022-2032, USD Million
- By Pain Type- Market Insights and Forecast 2022-2032, USD Million
- By Application- Market Insights and Forecast 2022-2032, USD Million
- By Sales Channel- Market Insights and Forecast 2022-2032, USD Million
- By Prescription Type- Market Insights and Forecast 2022-2032, USD Million
- By Formulation- Market Insights and Forecast 2022-2032, USD Million
- By End User- Market Insights and Forecast 2022-2032, USD Million
- Market Size & Growth Outlook
- Norway Topical Analgesics/Anaesthetic Market Statistics, 2022-2032
- Market Size & Growth Outlook
- By Revenues in USD Million
- Market Segmentation & Growth Outlook
- By Drug Type- Market Insights and Forecast 2022-2032, USD Million
- By Route of Administration- Market Insights and Forecast 2022-2032, USD Million
- By Pain Type- Market Insights and Forecast 2022-2032, USD Million
- By Application- Market Insights and Forecast 2022-2032, USD Million
- By Sales Channel- Market Insights and Forecast 2022-2032, USD Million
- By Prescription Type- Market Insights and Forecast 2022-2032, USD Million
- By Formulation- Market Insights and Forecast 2022-2032, USD Million
- By End User- Market Insights and Forecast 2022-2032, USD Million
- Market Size & Growth Outlook
- Competitive Outlook
- Company Profiles
- Karo Pharma AS
- Business Description
- Product Portfolio
- Collaborations & Alliances
- Recent Developments
- Financial Details
- Others
- Haleon Norway AS
- Business Description
- Product Portfolio
- Collaborations & Alliances
- Recent Developments
- Financial Details
- Others
- Orifarm Healthcare AS
- Business Description
- Product Portfolio
- Collaborations & Alliances
- Recent Developments
- Financial Details
- Others
- Evolan Pharma AB
- Business Description
- Product Portfolio
- Collaborations & Alliances
- Recent Developments
- Financial Details
- Others
- Teva Norway AS
- Business Description
- Product Portfolio
- Collaborations & Alliances
- Recent Developments
- Financial Details
- Others
- Bonaventura Sales AS
- Business Description
- Product Portfolio
- Collaborations & Alliances
- Recent Developments
- Financial Details
- Others
- Bayer AS
- Business Description
- Product Portfolio
- Collaborations & Alliances
- Recent Developments
- Financial Details
- Others
- Stada Nordic ApS
- Business Description
- Product Portfolio
- Collaborations & Alliances
- Recent Developments
- Financial Details
- Others
- Viatris AS
- Business Description
- Product Portfolio
- Collaborations & Alliances
- Recent Developments
- Financial Details
- Others
- GlaxoSmithKline AS
- Business Description
- Product Portfolio
- Collaborations & Alliances
- Recent Developments
- Financial Details
- Others
- Karo Pharma AS
- Company Profiles
- Disclaimer
| Segment | Sub-Segment |
|---|---|
| By Product |
|
| By Drug Type |
|
| By Route of Administration |
|
| By Pain Type |
|
| By Application |
|
| By Sales Channel |
|
| By Prescription Type |
|
| By Formulation |
|
| By End User |
|
Research Methodology
This study followed a structured approach comprising four key phases to assess the size and scope of the electro-oxidation market. The process began with thorough secondary research to collect data on the target market, related markets, and broader industry context. These findings, along with preliminary assumptions and estimates, were then validated through extensive primary research involving industry experts from across the value chain. To calculate the overall market size, both top-down and bottom-up methodologies were employed. Finally, market segmentation and data triangulation techniques were applied to refine and validate segment-level estimations.
Secondary Research
The secondary research phase involved gathering data from a wide range of credible and published sources. This step helped in identifying industry trends, defining market segmentation, and understanding the market landscape and value chain.
Sources consulted during this phase included:
- Company annual reports, investor presentations, and press releases
- Industry white papers and certified publications
- Trade directories and market-recognized databases
- Articles from authoritative authors and reputable journals
- Gold and silver standard websites
Secondary research was critical in mapping out the industry's value chain and monetary flow, identifying key market segments, understanding regional variations, and tracking significant industry developments.
Other key sources:
- Financial disclosures
- Industry associations and trade bodies
- News outlets and business magazines
- Academic journals and research studies
- Paid industry databases
Primary Research
To validate secondary data and gain deeper market insights, primary research was conducted with key stakeholders across both the supply and demand sides of the market.
On the demand side, participants included decision-makers and influencers from end-user industries—such as CIOs, CTOs, and CSOs—who provided first-hand perspectives on market needs, product usage, and future expectations.
On the supply side, interviews were conducted with manufacturers, industry associations, and institutional participants to gather insights into current offerings, product pipelines, and market challenges.
Primary interviews provided critical inputs such as:
- Market size and revenue data
- Product and service breakdowns
- Market forecasts
- Regional and application-specific trends
Stakeholders consulted included:
- Leading OEM and solution providers
- Channel and distribution partners
- End users across various applications
- Independent consultants and industry specialists
Market Size Estimation and Data Triangulation
- Identifying Key Market Participants (Secondary Research)
- Goal: To identify the major players or companies in the target market. This typically involves using publicly available data sources such as industry reports, market research publications, and financial statements of companies.
- Tools: Reports from firms like Gartner, Forrester, Euromonitor, Statista, IBISWorld, and others. Public financial statements, news articles, and press releases from top market players.
- Extracting Earnings of Key Market Participants
- Goal: To estimate the earnings generated from the product or service being analyzed. This step helps in understanding the revenue potential of each market player in a specific geography.
- Methods: Earnings data can be gathered from:
- Publicly available financial reports (for listed companies).
- Interviews and primary data sources from professionals, such as Directors, VPs, SVPs, etc. This is especially useful for understanding more nuanced, internal data that isn't publicly disclosed.
- Annual reports and investor presentations of key players.
- Data Collation and Development of a Relevant Data Model
- Goal: To collate inputs from both primary and secondary sources into a structured, data-driven model for market estimation. This model will incorporate key market KPIs and any independent variables relevant to the market.
- Key KPIs: These could include:
- Market size, growth rate, and demand drivers.
- Industry-specific metrics like market share, average revenue per customer (ARPC), or average deal size.
- External variables, such as economic growth rates, inflation rates, or commodity prices, that could affect the market.
- Data Modeling: Based on this data, the market forecasts are developed for the next 5 years. A combination of trend analysis, scenario modeling, and statistical regression might be used to generate projections.
- Scenario Analysis
- Goal: To test different assumptions and validate how sensitive the market is to changes in key variables (e.g., market demand, regulatory changes, technological disruptions).
- Types of Scenarios:
- Base Case: Based on current assumptions and historical data.
- Best-Case Scenario: Assuming favorable market conditions, regulatory environments, and technological advancements.
- Worst-Case Scenario: Accounting for adverse factors, such as economic downturns, stricter regulations, or unexpected disruptions.


