Global Medical Oxygen Market Report: Trends, Growth and Forecast (2026-2032)
By Form (Liquid Oxygen, Compressed Oxygen, Oxygen Gas Mixture), By Supply Mode (Tanks/Pipeline, Cylinder, On-Site Production, Others), By Application (Therapeutic, Diagnostics), By End User (Hospitals & Clinics, Ambulatory Care Centers, Homecare, Others), By Region (North America, South America, Europe, Middle East & Africa, Asia Pacific) ... Read more
|
Major Players
|
Global Medical Oxygen Market Statistics and Insights, 2026
- Market Size Statistics
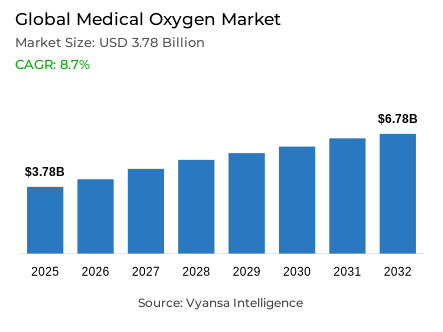
- Global medical oxygen market is estimated at USD 3.78 billion in 2025.
- The market size is expected to grow to USD 6.78 billion by 2032.
- Market to register a CAGR of around 8.7% during 2026-32.
- Form Shares
- Compressed oxygen grabbed market share of 35%.
- Competition
- Global medical oxygen market is currently being catered to by more than 10 companies.
- Top 5 companies acquired around 80% of the market share.
- Keen Compressed Gas Co.; Atlas Copco Group; Jubail Gas Plant Co. Ltd.; Linde PLC; Air Products and Chemicals Inc. etc., are few of the top companies.
- Supply Mode
- Cylinder grabbed 45% of the market.
- Region
- Asia Pacific leads with a 40% share of the global market.
Global Medical Oxygen Market Outlook
The global medical oxygen market is growing aggressively due to continuously rising chronic respiratory diseases, and health systems are working to close long-standing gaps in oxygen access. In 2025, the market was valued at USD 3.78 billion and is projected to reach USD 6.78 billion by 2032, expanding at a CAGR of around 8.7% during 2026-2032. Increasing cases of asthma, COPD, and severe pneumonia, along with the persistent mismatch between patient needs and oxygen availability in low-resource regions, underpin strong demand across hospitals, emergency care, and long-term disease management.
Infrastructure has continued to be a challenge particularly in the low and middle income countries, where less than half of the medical facilities can guarantee a regular supply of oxygen. Installation costs for liquid oxygen systems are very high, as well as maintenance costs, and pulse oximeters are not yet in adequate supply, which continues to slow progress being made. Despite such setbacks, technologies for decentralized oxygen generation, including PSA plants and concentrator-based systems, do contribute to country efforts toward stronger local production and reduced dependence on cylinder logistics.
Significant investments from governments and global health agencies are accelerating market transformation. Scaling PSA plants is also one of the key directions developed in countries of Africa and Asia, scaling home-based oxygen therapy and adoption of digital monitoring tools to improve efficiency. Home healthcare has gained strong traction, especially among elderly patients, supported by portable oxygen concentrators that enhance long-term care outcomes.
In market segmentation, compressed oxygen contributes to the largest share at 35% owing to its critical involvement in emergency and acute care. Cylinder-based supply remains dominant, with a 45% share, driven by portability and suitability for resource-limited settings. Regionally, Asia-Pacific leads with 40% of the market share, supported by a high prevalence of disease, large population, strong government initiatives, and expanding local manufacturing.

Global Medical Oxygen Market Growth Driver
Escalating Healthcare Burden from Respiratory Diseases
Respiratory illnesses are on a steep increase worldwide, thus fueling market growth. Demand for medical oxygen exceeds 1.2 billion Nm³ every year with a patient base that consists of 374 million people. The main drivers of medical oxygen consumption are asthmatic and COPD patients. It should be noted that more people have died from COPD with 3.5 million deaths due to COPD alone in 2021. Also, it emerged as the fourth leading cause of death. Pneumonia and deaths from respiratory illness will continue to drive dependence on oxygen therapy.
The gap between disease burden and guaranteed oxygen access continues to fuel market growth as healthcare infrastructures seek an upgrade in oxygen supply chain trustworthiness. Only fewer than 50% of healthcare facilities in LMICs have uninterrupted oxygen supply; hypoxemia leads to 9 million deaths per year. The impact of COVID-19 brought about an additional focus on oxygen demand with 1.9 billion Nm3 demand in 2021. Governments' focus on making targeted investments to remedy discrepancies drives medical oxygen use at a faster rate.
Global Medical Oxygen Market Challenge
Persistent Infrastructure Limitations and High Operational Expenses
Despite the demand is growing, infrastructure deficits and operational inefficiencies hold back the market, with high costs constraining supply growth in low-resource settings. Only 30% of the 299 million patients requiring oxygen for acute conditions receive adequate therapy, while sub-Saharan Africa faces the widest access gaps. A lack of pulse oximeters in as many as 70% of operating theaters reveals fundamental shortcomings in monitoring and safety. Liquid oxygen infrastructure presents particularly high financial hurdles: African facilities pay USD 1.2-3 per kilogram for the product and install tanks at USD 4,400-7,100 with ongoing maintenance, constraints that make scaling challenging.
Cost differences by region further add to the intricacies of optimizing the supply chain. Although oxygen is available more cheaply in Asia at between USD 0.20-1.90 per kilogram, installation and service costs remain out of reach for smaller facilities. Even for already set-up systems, lifecycle costs remain very high: three year project costs range from USD 200,000 for low usage sites to USD 2.7 million for high demand scenarios. These financial burdens explain the slow pace of renewal of infrastructure and the imperative for innovative financing models and partnerships if structural constraints are to be surmounted.
Unlock Market Intelligence
Explore the market potential with our data-driven report
Global Medical Oxygen Market Trend
Decentralized Production Advancements and Technology Integration
The market is realizing a very rapid development of decentralized oxygen generation through PSA plants and concentrator-based systems, reducing dependency on cylinder logistics and making it more resilient during disruptions in supply. Large-scale efforts are seen in Africa, too, such as new PSA facilities in Kenya and Tanzania, which are set to treble regional output with over 60 tons added daily, while prices drop by over 25%. Rwanda's strategy for nationwide PSA installations has also experienced expansion by 600% in just two years, proof that on-site production models are efficient and viable at scale.
International agencies including UNICEF and WHO are reinforcing this with more than 45,000 oxygen concentrators distributed across the globe to establish local production. Meanwhile, digital health technologies are transforming oxygen delivery and system optimization. Telehealth-enabled home oxygen therapy has been shown to reduce hospital readmissions and improve quality of life among COPD patients. UNICEF's pricing dashboards now support data-driven procurement, allowing hospitals and governments to model costs, evaluate suppliers, and develop long-term oxygen strategies. Taken together, the integration of digital monitoring, transparent pricing tools, and decentralized infrastructure will enhance system resilience while positioning the market for sustained long-term scalability.
Global Medical Oxygen Market Opportunity
Expanding Home Care Utilization and Aging Population Needs
The shift toward home based oxygen therapy which creates a significant potential for market expansion, as aging populations and clinical preferences continue to evolve. Home healthcare accounted for the largest share of oxygen therapy demand in 2023, underpinned by the rising adoption of long-term oxygen therapy among elderly patients desiring prolonged independence. Portable oxygen concentrators dominate this category, driven by improved mobility, relative ease of use, and clinical effectiveness in the management of chronic diseases. The pandemic accelerated acceptance of decentralized oxygen care models, showcasing resilience during supply chain disruption and reinforcing home therapy as a key constituent of respiratory care strategies.
Furthermore, economic benefits create an edge for the momentum of home care, as it has been recognized by governments and strengthened by universal health coverage, reducing hospital burdens. Most of the large Asian markets, including China and India, have embedded targets in national health strategies to ensure access to oxygen, supporting wide-scale deployments of home oxygen devices into county and district medical systems. Moreover, telehealth, extended battery concentrators, and integrated digital monitoring further enhance home therapy's viability. These factors fuel sustained adoption across both developed and emerging markets, strengthening long-term demand growth.
Global Medical Oxygen Market Regional Analysis

By Region
- North America
- South America
- Europe
- Middle East & Africa
- Asia Pacific
Asia Pacific leads the Global Medical Oxygen Market with a commanding 40% share, driven by its large population, high respiratory disease prevalence, and strong governmental support for healthcare infrastructure expansion. Over 68% of global patients requiring medical oxygen reside in South and East Asia, creating substantial demand for hospital and home based oxygen systems. China contributes significantly through its regional oxygen concentrator segment and extensive domestic manufacturing capacity. India’s rapid expansion of oxygen production from 5,700 to 9,690 metric tons per day highlights the region’s continued commitment to strengthening oxygen availability across medical facilities.
The region benefits from favorable oxygen economics and large scale investments that reduce costs and accelerate deployment of oxygen systems. Liquid oxygen rental prices of USD 0.20-1.90 per kilogram and installation costs as low as USD 750 improve affordability, while national oxygen plans across multiple Asia Pacific countries support long term oxygen security strategies. Strong government mandates, expanding home care demand, local manufacturing ecosystems, and access to UNICEF’s global oxygen planning resources collectively reinforce Asia Pacific’s sustained market leadership for the 2026-2032 period.
Unlock Market Intelligence
Explore the market potential with our data-driven report
Global Medical Oxygen Market Segmentation Analysis
By Form
- Liquid Oxygen
- Compressed Oxygen
- Oxygen Gas Mixture
Compressed oxygen holds the leading position in the form based segmentation, capturing approximately 35% of the Global Medical Oxygen Market due to its essential role in emergency and acute care settings. Its immediate availability makes it indispensable for intensive care units, ambulance fleets, and emergency departments where rapid respiratory support is critical. Established regulatory familiarity, decades of validated clinical use, and compatibility with existing hospital equipment further reinforce its dominant position across healthcare environments. The segment’s operational flexibility, especially in crisis response situations, continues to underpin its widespread utilization worldwide.
Despite increased adoption of liquid oxygen and concentrator technologies, compressed oxygen systems remain central to hospital based care due to their portability, stability, and reliability during high acuity events. Hospitals and emergency response units continue to rely heavily on cylinders for backup supply, transport, and surge capacity management. As end users prioritize dependable oxygen sources for critical care operations, the compressed oxygen segment maintains strong market penetration and consistent demand, particularly in regions with evolving healthcare infrastructure.

By Supply Mode
- Tanks/Pipeline
- Cylinder
- On-Site Production
- Others
Cylinder based supply dominates global distribution with a 45% share, reflecting its entrenched utility across diverse healthcare settings and geographies. Cylinders offer unparalleled portability and are widely preferred in hospitals, ambulatory centers, and home care environments where flexible oxygen delivery is essential. Their minimal infrastructure requirements make them particularly suitable for resource constrained regions where centralized systems or continuous power availability are not guaranteed. Cylinder distribution also aligns with conventional procurement practices, preserving its leadership despite advancements in alternative supply models.
While PSA plants and liquid oxygen systems continue expanding, cylinders remain the primary mode of supply in emerging markets where investment barriers limit adoption of capital intensive systems. Transportation and refilling networks for cylinders are well established, ensuring consistent availability even in rural or remote areas. End users also value cylinders for emergency preparedness, redundancy, and mobility across clinical settings. As many health systems continue transitioning to modernized supply infrastructure, cylinder based distribution retains strong relevance within mixed supply ecosystems.
Market Players in Global Medical Oxygen Market
These market players maintain a significant presence in the Global medical oxygen market sector and contribute to its ongoing evolution.
- Keen Compressed Gas Co.
- Atlas Copco Group
- Jubail Gas Plant Co. Ltd.
- Linde PLC
- Air Products and Chemicals Inc.
- Air Liquide S.A.
- Taiyo Nippon Sanso Corp.
- Messer SE & Co KGaA
- Jacko Gases Company
- Aldakheel Industrial Gases Plant (DIGAS)
Market News & Updates
- Air Liquide S.A., 2025:
Air Liquide officially launched its ECO ORIGIN™ certified low-carbon medical oxygen and nitrogen program in January 2025, achieving a 70% reduction in carbon footprint compared to standard supply through 100% renewable energy production. The company signed initial contracts with 20 hospitals and clinics across six European countries (Belgium, France, Germany, Italy, Netherlands, Spain) and Brazil, with rapid expansion to over 120 hospitals across Europe and Brazil by October 2025. This initiative represents a significant shift toward sustainable medical gas supply chains, enabling healthcare facilities to reduce their environmental impact while maintaining the highest oxygen purity standards required for patient safety across hospitals, surgical centers, and extended care facilities.
- Linde PLC, 2025:
Linde strengthened its medical oxygen distribution capabilities with infrastructure enhancements supporting its extensive network across 60+ countries serving 20,000 hospitals and healthcare facilities. The company maintains critical supply chains for medical oxygen applications spanning hospitals, surgical centers, extended care facilities, research laboratories, and MRI imaging centers with emphasis on supply reliability and oxygen purity standards that meet international healthcare requirements. Linde's medical oxygen operations support 4 million customers and patients globally through 66,300 employees, positioning the company as a major supplier of life-saving medical gases to healthcare providers worldwide with proven capability to scale operations during health crises and maintain continuous supply to essential medical facilities.
Frequently Asked Questions
Related Report
1. Market Segmentation
1.1. Research Scope
1.2. Research Methodology
1.3. Definitions and Assumptions
2. Executive Summary
3. Global Medical Oxygen Market Policies, Regulations, and Standards
4. Global Medical Oxygen Market Dynamics
4.1. Growth Factors
4.2. Challenges
4.3. Trends
4.4. Opportunities
5. Global Medical Oxygen Market Statistics, 2022-2032
5.1. Market Size & Growth Outlook
5.1.1.By Revenues in USD Million
5.1.2.By Quantity Sold in Million Tons
5.2. Market Segmentation & Growth Outlook
5.2.1.By Form
5.2.1.1. Liquid Oxygen- Market Size, 2022-2032, Million Tons
5.2.1.2. Compressed Oxygen- Market Size, 2022-2032, Million Tons
5.2.1.3. Oxygen Gas Mixture- Market Size, 2022-2032, Million Tons
5.2.2.By Supply Mode
5.2.2.1. Tanks/Pipeline- Market Size, 2022-2032, Million Tons
5.2.2.2. Cylinder- Market Size, 2022-2032, Million Tons
5.2.2.3. On-Site Production- Market Size, 2022-2032, Million Tons
5.2.2.4. Others- Market Size, 2022-2032, Million Tons
5.2.3.By Application
5.2.3.1. Therapeutic- Market Size, 2022-2032, Million Tons
5.2.3.2. Diagnostics- Market Size, 2022-2032, Million Tons
5.2.4.By End User
5.2.4.1. Hospitals & Clinics- Market Size, 2022-2032, Million Tons
5.2.4.2. Ambulatory Care Centers- Market Size, 2022-2032, Million Tons
5.2.4.3. Homecare- Market Size, 2022-2032, Million Tons
5.2.4.4. Others- Market Size, 2022-2032, Million Tons
5.2.5.By Region
5.2.5.1. North America
5.2.5.2. South America
5.2.5.3. Europe
5.2.5.4. Middle East & Africa
5.2.5.5. Asia Pacific
5.2.6.By Competitors
5.2.6.1. Competition Characteristics
5.2.6.2. Market Share & Analysis
6. North America Medical Oxygen Market Statistics, 2022-2032
6.1. Market Size & Growth Outlook
6.1.1.By Revenues in USD Million
6.1.2.By Quantity Sold in Million Tons
6.2. Market Segmentation & Growth Outlook
6.2.1.By Form- Market Size, 2022-2032, Million Tons
6.2.2.By Supply Mode- Market Size, 2022-2032, Million Tons
6.2.3.By Application- Market Size, 2022-2032, Million Tons
6.2.4.By End User- Market Size, 2022-2032, Million Tons
6.2.5.By Country
6.2.5.1. US
6.2.5.2. Canada
6.2.5.3. Mexico
6.2.5.4. Rest of North America
6.3. US Medical Oxygen Market Statistics, 2022-2032
6.3.1.Market Size & Growth Outlook
6.3.1.1. By Revenues in USD Million
6.3.1.2. By Quantity Sold in Million Tons
6.3.2.Market Segmentation & Growth Outlook
6.3.2.1. By Form- Market Size, 2022-2032, Million Tons
6.3.2.2. By Application- Market Size, 2022-2032, Million Tons
6.4. Canada Medical Oxygen Market Statistics, 2022-2032
6.4.1.Market Size & Growth Outlook
6.4.1.1. By Revenues in USD Million
6.4.1.2. By Quantity Sold in Million Tons
6.4.2.Market Segmentation & Growth Outlook
6.4.2.1. By Form- Market Size, 2022-2032, Million Tons
6.4.2.2. By Application- Market Size, 2022-2032, Million Tons
6.5. Mexico Medical Oxygen Market Statistics, 2022-2032
6.5.1.Market Size & Growth Outlook
6.5.1.1. By Revenues in USD Million
6.5.1.2. By Quantity Sold in Million Tons
6.5.2.Market Segmentation & Growth Outlook
6.5.2.1. By Form- Market Size, 2022-2032, Million Tons
6.5.2.2. By Application- Market Size, 2022-2032, Million Tons
7. South America Medical Oxygen Market Statistics, 2022-2032
7.1. Market Size & Growth Outlook
7.1.1.By Revenues in USD Million
7.1.2.By Quantity Sold in Million Tons
7.2. Market Segmentation & Growth Outlook
7.2.1.By Form- Market Size, 2022-2032, Million Tons
7.2.2.By Supply Mode- Market Size, 2022-2032, Million Tons
7.2.3.By Application- Market Size, 2022-2032, Million Tons
7.2.4.By End User- Market Size, 2022-2032, Million Tons
7.2.5.By Country
7.2.5.1. Brazil
7.2.5.2. Argentina
7.2.5.3. Colombia
7.2.5.4. Rest of South America
7.3. Brazil Medical Oxygen Market Statistics, 2022-2032
7.3.1.Market Size & Growth Outlook
7.3.1.1. By Revenues in USD Million
7.3.1.2. By Quantity Sold in Million Tons
7.3.2.Market Segmentation & Growth Outlook
7.3.2.1. By Form- Market Size, 2022-2032, Million Tons
7.3.2.2. By Application- Market Size, 2022-2032, Million Tons
7.4. Argentina Medical Oxygen Market Statistics, 2022-2032
7.4.1.Market Size & Growth Outlook
7.4.1.1. By Revenues in USD Million
7.4.1.2. By Quantity Sold in Million Tons
7.4.2.Market Segmentation & Growth Outlook
7.4.2.1. By Form- Market Size, 2022-2032, Million Tons
7.4.2.2. By Application- Market Size, 2022-2032, Million Tons
7.5. Colombia Medical Oxygen Market Statistics, 2022-2032
7.5.1.Market Size & Growth Outlook
7.5.1.1. By Revenues in USD Million
7.5.1.2. By Quantity Sold in Million Tons
7.5.2.Market Segmentation & Growth Outlook
7.5.2.1. By Form- Market Size, 2022-2032, Million Tons
7.5.2.2. By Application- Market Size, 2022-2032, Million Tons
8. Europe Medical Oxygen Market Statistics, 2022-2032
8.1. Market Size & Growth Outlook
8.1.1.By Revenues in USD Million
8.1.2.By Quantity Sold in Million Tons
8.2. Market Segmentation & Growth Outlook
8.2.1.By Form- Market Size, 2022-2032, Million Tons
8.2.2.By Supply Mode- Market Size, 2022-2032, Million Tons
8.2.3.By Application- Market Size, 2022-2032, Million Tons
8.2.4.By End User- Market Size, 2022-2032, Million Tons
8.2.5.By Country
8.2.5.1. France
8.2.5.2. UK
8.2.5.3. Italy
8.2.5.4. Germany
8.2.5.5. Spain
8.2.5.6. Rest of Europe
8.3. France Medical Oxygen Market Statistics, 2022-2032
8.3.1.Market Size & Growth Outlook
8.3.1.1. By Revenues in USD Million
8.3.1.2. By Quantity Sold in Million Tons
8.3.2.Market Segmentation & Growth Outlook
8.3.2.1. By Form- Market Size, 2022-2032, Million Tons
8.3.2.2. By Application- Market Size, 2022-2032, Million Tons
8.4. UK Medical Oxygen Market Statistics, 2022-2032
8.4.1.Market Size & Growth Outlook
8.4.1.1. By Revenues in USD Million
8.4.1.2. By Quantity Sold in Million Tons
8.4.2.Market Segmentation & Growth Outlook
8.4.2.1. By Form- Market Size, 2022-2032, Million Tons
8.4.2.2. By Application- Market Size, 2022-2032, Million Tons
8.5. Italy Medical Oxygen Market Statistics, 2022-2032
8.5.1.Market Size & Growth Outlook
8.5.1.1. By Revenues in USD Million
8.5.1.2. By Quantity Sold in Million Tons
8.5.2.Market Segmentation & Growth Outlook
8.5.2.1. By Form- Market Size, 2022-2032, Million Tons
8.5.2.2. By Application- Market Size, 2022-2032, Million Tons
8.6. Germany Medical Oxygen Market Statistics, 2022-2032
8.6.1.Market Size & Growth Outlook
8.6.1.1. By Revenues in USD Million
8.6.1.2. By Quantity Sold in Million Tons
8.6.2.Market Segmentation & Growth Outlook
8.6.2.1. By Form- Market Size, 2022-2032, Million Tons
8.6.2.2. By Application- Market Size, 2022-2032, Million Tons
8.7. Spain Medical Oxygen Market Statistics, 2022-2032
8.7.1.Market Size & Growth Outlook
8.7.1.1. By Revenues in USD Million
8.7.1.2. By Quantity Sold in Million Tons
8.7.2.Market Segmentation & Growth Outlook
8.7.2.1. By Form- Market Size, 2022-2032, Million Tons
8.7.2.2. By Application- Market Size, 2022-2032, Million Tons
9. Middle East & Africa Medical Oxygen Market Statistics, 2022-2032
9.1. Market Size & Growth Outlook
9.1.1.By Revenues in USD Million
9.1.2.By Quantity Sold in Million Tons
9.2. Market Segmentation & Growth Outlook
9.2.1.By Form- Market Size, 2022-2032, Million Tons
9.2.2.By Supply Mode- Market Size, 2022-2032, Million Tons
9.2.3.By Application- Market Size, 2022-2032, Million Tons
9.2.4.By End User- Market Size, 2022-2032, Million Tons
9.2.5.By Country
9.2.5.1. South Africa
9.2.5.2. Saudi Arabia
9.2.5.3. UAE
9.2.5.4. Rest of Middle East & Africa
9.3. South Africa Medical Oxygen Market Statistics, 2022-2032
9.3.1.Market Size & Growth Outlook
9.3.1.1. By Revenues in USD Million
9.3.1.2. By Quantity Sold in Million Tons
9.3.2.Market Segmentation & Growth Outlook
9.3.2.1. By Form- Market Size, 2022-2032, Million Tons
9.3.2.2. By Application- Market Size, 2022-2032, Million Tons
9.4. Saudi Arabia Medical Oxygen Market Statistics, 2022-2032
9.4.1.Market Size & Growth Outlook
9.4.1.1. By Revenues in USD Million
9.4.1.2. By Quantity Sold in Million Tons
9.4.2.Market Segmentation & Growth Outlook
9.4.2.1. By Form- Market Size, 2022-2032, Million Tons
9.4.2.2. By Application- Market Size, 2022-2032, Million Tons
9.5. UAE Medical Oxygen Market Statistics, 2022-2032
9.5.1.Market Size & Growth Outlook
9.5.1.1. By Revenues in USD Million
9.5.1.2. By Quantity Sold in Million Tons
9.5.2.Market Segmentation & Growth Outlook
9.5.2.1. By Form- Market Size, 2022-2032, Million Tons
9.5.2.2. By Application- Market Size, 2022-2032, Million Tons
10. Asia Pacific Medical Oxygen Market Statistics, 2022-2032
10.1. Market Size & Growth Outlook
10.1.1. By Revenues in USD Million
10.1.2. By Quantity Sold in Million Tons
10.2. Market Segmentation & Growth Outlook
10.2.1. By Form- Market Size, 2022-2032, Million Tons
10.2.2. By Supply Mode- Market Size, 2022-2032, Million Tons
10.2.3. By Application- Market Size, 2022-2032, Million Tons
10.2.4. By End User- Market Size, 2022-2032, Million Tons
10.2.5. By Country
10.2.5.1. China
10.2.5.2. India
10.2.5.3. Japan
10.2.5.4. Australia
10.2.5.5. South Korea
10.2.5.6. Rest of Asia Pacific
10.3. China Medical Oxygen Market Statistics, 2022-2032
10.3.1. Market Size & Growth Outlook
10.3.1.1. By Revenues in USD Million
10.3.1.2. By Quantity Sold in Million Tons
10.3.2. Market Segmentation & Growth Outlook
10.3.2.1. By Form- Market Size, 2022-2032, Million Tons
10.3.2.2. By Application- Market Size, 2022-2032, Million Tons
10.4. India Medical Oxygen Market Statistics, 2022-2032
10.4.1. Market Size & Growth Outlook
10.4.1.1. By Revenues in USD Million
10.4.1.2. By Quantity Sold in Million Tons
10.4.2. Market Segmentation & Growth Outlook
10.4.2.1. By Form- Market Size, 2022-2032, Million Tons
10.4.2.2. By Application- Market Size, 2022-2032, Million Tons
10.5. Japan Medical Oxygen Market Statistics, 2022-2032
10.5.1. Market Size & Growth Outlook
10.5.1.1. By Revenues in USD Million
10.5.1.2. By Quantity Sold in Million Tons
10.5.2. Market Segmentation & Growth Outlook
10.5.2.1. By Form- Market Size, 2022-2032, Million Tons
10.5.2.2. By Application- Market Size, 2022-2032, Million Tons
10.6. Australia Medical Oxygen Market Statistics, 2022-2032
10.6.1. Market Size & Growth Outlook
10.6.1.1. By Revenues in USD Million
10.6.1.2. By Quantity Sold in Million Tons
10.6.2. Market Segmentation & Growth Outlook
10.6.2.1. By Form- Market Size, 2022-2032, Million Tons
10.6.2.2. By Application- Market Size, 2022-2032, Million Tons
10.7. South Korea Medical Oxygen Market Statistics, 2022-2032
10.7.1. Market Size & Growth Outlook
10.7.1.1. By Revenues in USD Million
10.7.1.2. By Quantity Sold in Million Tons
10.7.2. Market Segmentation & Growth Outlook
10.7.2.1. By Form- Market Size, 2022-2032, Million Tons
10.7.2.2. By Application- Market Size, 2022-2032, Million Tons
11. Competitive Outlook
11.1. Company Profiles
11.1.1. Linde PLC
11.1.1.1. Business Description
11.1.1.2. Product Portfolio
11.1.1.3. Collaborations & Alliances
11.1.1.4. Recent Developments
11.1.1.5. Financial Details
11.1.1.6. Others
11.1.2. Air Products and Chemicals Inc.
11.1.2.1. Business Description
11.1.2.2. Product Portfolio
11.1.2.3. Collaborations & Alliances
11.1.2.4. Recent Developments
11.1.2.5. Financial Details
11.1.2.6. Others
11.1.3. Air Liquide S.A.
11.1.3.1. Business Description
11.1.3.2. Product Portfolio
11.1.3.3. Collaborations & Alliances
11.1.3.4. Recent Developments
11.1.3.5. Financial Details
11.1.3.6. Others
11.1.4. Taiyo Nippon Sanso Corp.
11.1.4.1. Business Description
11.1.4.2. Product Portfolio
11.1.4.3. Collaborations & Alliances
11.1.4.4. Recent Developments
11.1.4.5. Financial Details
11.1.4.6. Others
11.1.5. Messer SE & Co KGaA
11.1.5.1. Business Description
11.1.5.2. Product Portfolio
11.1.5.3. Collaborations & Alliances
11.1.5.4. Recent Developments
11.1.5.5. Financial Details
11.1.5.6. Others
11.1.6. Keen Compressed Gas Co.
11.1.6.1. Business Description
11.1.6.2. Product Portfolio
11.1.6.3. Collaborations & Alliances
11.1.6.4. Recent Developments
11.1.6.5. Financial Details
11.1.6.6. Others
11.1.7. Atlas Copco Group
11.1.7.1. Business Description
11.1.7.2. Product Portfolio
11.1.7.3. Collaborations & Alliances
11.1.7.4. Recent Developments
11.1.7.5. Financial Details
11.1.7.6. Others
11.1.8. Jubail Gas Plant Co. Ltd.
11.1.8.1. Business Description
11.1.8.2. Product Portfolio
11.1.8.3. Collaborations & Alliances
11.1.8.4. Recent Developments
11.1.8.5. Financial Details
11.1.8.6. Others
11.1.9. Jacko Gases Company
11.1.9.1. Business Description
11.1.9.2. Product Portfolio
11.1.9.3. Collaborations & Alliances
11.1.9.4. Recent Developments
11.1.9.5. Financial Details
11.1.9.6. Others
11.1.10. Aldakheel Industrial Gases Plant (DIGAS)
11.1.10.1. Business Description
11.1.10.2. Product Portfolio
11.1.10.3. Collaborations & Alliances
11.1.10.4. Recent Developments
11.1.10.5. Financial Details
11.1.10.6. Others
11.1.11. Others
12. Disclaimer
| Segment | Sub-Segment |
|---|---|
| By Form |
|
| By Supply Mode |
|
| By Application |
|
| By End User |
|
| By Region |
|
Research Methodology
This study followed a structured approach comprising four key phases to assess the size and scope of the electro-oxidation market. The process began with thorough secondary research to collect data on the target market, related markets, and broader industry context. These findings, along with preliminary assumptions and estimates, were then validated through extensive primary research involving industry experts from across the value chain. To calculate the overall market size, both top-down and bottom-up methodologies were employed. Finally, market segmentation and data triangulation techniques were applied to refine and validate segment-level estimations.
Secondary Research
The secondary research phase involved gathering data from a wide range of credible and published sources. This step helped in identifying industry trends, defining market segmentation, and understanding the market landscape and value chain.
Sources consulted during this phase included:
- Company annual reports, investor presentations, and press releases
- Industry white papers and certified publications
- Trade directories and market-recognized databases
- Articles from authoritative authors and reputable journals
- Gold and silver standard websites
Secondary research was critical in mapping out the industry's value chain and monetary flow, identifying key market segments, understanding regional variations, and tracking significant industry developments.
Other key sources:
- Financial disclosures
- Industry associations and trade bodies
- News outlets and business magazines
- Academic journals and research studies
- Paid industry databases
Primary Research
To validate secondary data and gain deeper market insights, primary research was conducted with key stakeholders across both the supply and demand sides of the market.
On the demand side, participants included decision-makers and influencers from end-user industries—such as CIOs, CTOs, and CSOs—who provided first-hand perspectives on market needs, product usage, and future expectations.
On the supply side, interviews were conducted with manufacturers, industry associations, and institutional participants to gather insights into current offerings, product pipelines, and market challenges.
Primary interviews provided critical inputs such as:
- Market size and revenue data
- Product and service breakdowns
- Market forecasts
- Regional and application-specific trends
Stakeholders consulted included:
- Leading OEM and solution providers
- Channel and distribution partners
- End users across various applications
- Independent consultants and industry specialists
Market Size Estimation and Data Triangulation
- Identifying Key Market Participants (Secondary Research)
- Goal: To identify the major players or companies in the target market. This typically involves using publicly available data sources such as industry reports, market research publications, and financial statements of companies.
- Tools: Reports from firms like Gartner, Forrester, Euromonitor, Statista, IBISWorld, and others. Public financial statements, news articles, and press releases from top market players.
- Extracting Earnings of Key Market Participants
- Goal: To estimate the earnings generated from the product or service being analyzed. This step helps in understanding the revenue potential of each market player in a specific geography.
- Methods: Earnings data can be gathered from:
- Publicly available financial reports (for listed companies).
- Interviews and primary data sources from professionals, such as Directors, VPs, SVPs, etc. This is especially useful for understanding more nuanced, internal data that isn't publicly disclosed.
- Annual reports and investor presentations of key players.
- Data Collation and Development of a Relevant Data Model
- Goal: To collate inputs from both primary and secondary sources into a structured, data-driven model for market estimation. This model will incorporate key market KPIs and any independent variables relevant to the market.
- Key KPIs: These could include:
- Market size, growth rate, and demand drivers.
- Industry-specific metrics like market share, average revenue per customer (ARPC), or average deal size.
- External variables, such as economic growth rates, inflation rates, or commodity prices, that could affect the market.
- Data Modeling: Based on this data, the market forecasts are developed for the next 5 years. A combination of trend analysis, scenario modeling, and statistical regression might be used to generate projections.
- Scenario Analysis
- Goal: To test different assumptions and validate how sensitive the market is to changes in key variables (e.g., market demand, regulatory changes, technological disruptions).
- Types of Scenarios:
- Base Case: Based on current assumptions and historical data.
- Best-Case Scenario: Assuming favorable market conditions, regulatory environments, and technological advancements.
- Worst-Case Scenario: Accounting for adverse factors, such as economic downturns, stricter regulations, or unexpected disruptions.


