India Smart Kitchen Appliances Market Report: Trends, Growth and Forecast (2026-2032)
By Product Type (Cooking Appliances (Smart Ovens, Smart Induction Cooktops, Smart Microwaves, Smart Air Fryers, Smart Slow Cookers), Food Storage (Smart Refrigerators, Smart Wine Coolers), Food Preparation (Smart Coffee Makers, Smart Blenders, Smart Kitchen Scales), Cleaning Appliances (Smart Dishwashers)), By Connectivity Type (Wireless Internet Connectivity (Wi-Fi), Short-Range Connectivity (Bluetooth, NFC), Smart Home Protocols (Zigbee, Thread, Others)), By Control Type (App-Controlled, Voice-Controlled, Touch / Remote Controlled), By Price Range (Low / Economy, Mid-Range, Premium), By Sales Channel (Retail Online (Direct Sale, E-Commerce), Retail Offline (Direct Sale, Supermarkets / Hypermarkets, Specialty Stores, Brand Stores)), By End User (Residential, Commercial), By Region (North, East, West, South) ... Read more
|
Major Players
|
India Smart Kitchen Appliances Market Statistics and Insights, 2026
- Market Size Statistics
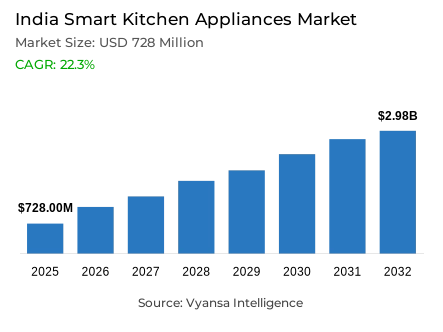
- Smart kitchen appliances market size in India was valued at USD 728 million in 2025 and is estimated at USD 822 Million in 2026.
- The market size is expected to grow to USD 2.98 billion by 2032.
- Market to register a CAGR of around 22.3% during 2026-32.
- Product Type Shares
- Food storage grabbed market share of 40%.
- Competition
- More than 10 companies are actively engaged in producing smart kitchen appliances in India.
- Top 5 companies acquired around 70% of the market share.
- Haier Appliances India Pvt. Ltd., Panasonic Life Solutions India Pvt. Ltd., BSH Household Appliances Manufacturing Pvt. Ltd., LG Electronics India Pvt. Ltd., Samsung India Electronics Pvt. Ltd. etc., are few of the top companies.
- Connectivity Type
- Wireless internet connectivity grabbed 60% of the market.
India Smart Kitchen Appliances Market Outlook
The India Smart Kitchen Appliances market was valued at USD 728 million in 2025 and is forecast to expand from USD 822 million in 2026 to USD 2.98 billion by 2032, implying a compound annual growth rate of 22.3% over the forecast period. The strong growth of the market is directly linked to the active development of digital infrastructure in the country. As of December 2025, India had 1,028.61 million internet subscribers and 1,007.35 million broadband subscribers, and the broadband base had passed the 1 billion mark in November 2025, according to the Telecom Regulatory Authority of India (TRAI). This growing connectivity ecosystem enables the growing use of application-enabled and IoT-integrated kitchen appliances in Indian homes.
Smart appliances are becoming more visible as the connectivity of homes is becoming more stable. September 2025 TRAI data indicates 938.92 million mobile wireless broadband subscribers, 44.40 million wired broadband subscribers, and 12.31 million fixed wireless access subscribers. The convergence of mobile broadband and residential Wi-Fi networks allows remote control, monitoring, and connection to smart-home ecosystems of appliances like connected refrigerators, smart ovens, and automated cooking systems.
Within the product portfolio, food‑storage appliances constitute 40% of market share. This category includes integrated refrigerators and smart storage devices that help families keep track of freshness, organize groceries, and reduce food spoilage. Their prevalence is indicative of the daily significance of food preservation in Indian kitchens, where families often deal with a blend of fresh, processed, and packaged foods.
From a connectivity perspective, wireless Internet connectivity accounts for 60% of the market. Appliances with Wi-Fi can be controlled through smartphone apps and can be connected to larger smart-home systems. With the mobile broadband penetration still growing and the number of households adopting connected devices steadily increasing, the India smart kitchen appliances market is expected to maintain a high growth rate up to 2032.

India Smart Kitchen Appliances Market Growth DriverConnected Households Build the Adoption Base
The main drivers in the Indian is the overall trend of digital connectivity in the country. With more households being able to access internet services, the overall scenario for connected home devices becomes more positive, especially for devices that require app control, remote control, or cloud-based technology to operate.
According to TRAI, as of December 2025, India had a total of 1,028.61 million internet subscribers, with a total of 1,007.35 million broadband subscribers, with broadband penetration crossing 1 billion as of November 2025. September 2025 also reports a total of 938.92 million mobile wireless broadband subscribers, with a further 44.40 million wired broadband subscribers, as well as a further 12.31 million fixed wireless access subscribers. The overall scenario for smart home technology, which can enable smart kitchen devices, makes such devices more feasible in Indian households.
India Smart Kitchen Appliances Market ChallengeUneven Household Readiness Slows Wider Adoption
While digital connectivity is a positive driver for smart home technology, overall readiness to adopt smart kitchen devices also remains a challenge, with the affordability gap between urban and rural India impacting overall willingness to adopt high-end connected devices in Indian households. The MoSPI Household Consumption Expenditure Survey for the period of 2023-24 reports an average monthly per capita expenditure of ₹4,122 in rural areas, as opposed to an average monthly per capita expenditure of ₹6,996 in urban areas, with a general urban-rural expenditure gap of approximately 70%.
Smart kitchen devices, as a non-food item, form a small percentage of overall household expenditure, with a general non-food item expenditure of 53% in rural India, as opposed to a general non-food item expenditure of 60% in urban India. Even with a total of 1,028.61 million internet subscribers, as of December 2025, only a further 47.37 million were wireline subscribers, with a majority of users preferring mobile internet access as opposed to stable broadband access in their homes.
Unlock Market Intelligence
Explore the market potential with our data-driven report
India Smart Kitchen Appliances Market TrendEnergy-Smart Positioning Gains Ground in Kitchen Purchases
Another notable trend is the integration of smart technology with energy efficiency. This is because end user today are becoming increasingly aware of energy consumption patterns. This has made brands focus on energy-efficient technology. The energy efficiency scheme in India has also contributed to this trend. The Bureau of Energy Efficiency (BEE) has a standards and labelling programme that covers 34 appliance categories.
These appliances include microwaves, induction hobs, side-by-side refrigerators, and deep freezers. According to BEE’s India Energy Scenario 2023-24, the total electricity consumed by the S&L appliance set is 197.70 TWh. This includes 27.38 TWh consumed by refrigerators. This shows that with the use of kitchen appliances, brands that integrate technology with energy efficiency will be a perfect match for end user.
India Smart Kitchen Appliances Market OpportunityFood Preservation Opens a Strong Product White Space
Food preservation technology offers a strong opportunity for smart kitchen appliances. This is because end user today are increasingly buying beverages, fresh food, and processed food. This has made the demand for technology that improves food preservation a necessity. According to the Ministry of Statistics and Programme Implementation (MoSPI) Household Consumption Expenditure Survey 2023-24, beverages, refreshments, and processed food form a major component of the food basket of both rural and urban households.
The government has also provided support to this category. According to BEE, the standards and labelling programme includes direct cool refrigerators, frost-free refrigerators, deep freezers, and side-by-side refrigerators. The total electricity consumed by refrigerators is 27.38 TWh.
Unlock Market Intelligence
Explore the market potential with our data-driven report
India Smart Kitchen Appliances Market Segmentation Analysis
By Product Type
- Cooking Appliances
- Smart Ovens
- Smart Induction Cooktops
- Smart Microwaves
- Smart Air Fryers
- Smart Slow Cookers
- Food Storage
- Smart Refrigerators
- Smart Wine Coolers
- Food Preparation
- Smart Coffee Makers
- Smart Blenders
- Smart Kitchen Scales
- Cleaning Appliances
- Smart Dishwashers
The segment with the highest share under Product Type is Food Storage, accounting for 40% of the market. This leadership reflects the central role storage appliances play in Indian kitchens, where households frequently manage a combination of fresh produce, packaged foods, beverages, and leftovers.
Food storage appliances also benefit from consistent daily usage and strong consumer relevance. Smart refrigerators and advanced storage systems allow households to monitor food freshness, manage grocery inventories, and reduce food waste through temperature control and remote alerts. Their importance aligns with broader household consumption patterns. The MoSPI Household Consumption Expenditure Survey 2023–24 shows that beverages, refreshments, and processed foods remain major contributors to food expenditure in India. Because storage appliances support everyday food management, they continue to hold the largest share within the smart kitchen appliance product mix.

By Connectivity Type
- Wireless Internet Connectivity
- Wi-Fi
- Short-Range Connectivity
- Bluetooth
- NFC
- Smart Home Protocols
- Zigbee
- Thread
- Others
Under Connectivity Type, Wireless Internet Connectivity accounts for approximately 60% of the market. This dominance reflects the strong preference for appliances that operate through Wi-Fi networks and smartphone applications rather than fixed or manually programmed interfaces.
Wireless connectivity enables remote monitoring, usage alerts, and integration with smart-home ecosystems, making it the most practical connectivity format for connected kitchen appliances. The digital infrastructure supporting this segment is substantial. According to TRAI, India records 1,028.61 million internet subscribers and 1,007.35 million broadband subscribers as of December 2025. In September 2025, mobile wireless broadband alone accounts for 938.92 million connections, while fixed wireless access reaches 12.31 million. This connectivity structure clearly favours wireless appliance integration, allowing households to operate smart kitchen devices through mobile networks and home Wi-Fi systems.
List of Companies Covered in India Smart Kitchen Appliances Market
The companies listed below are highly influential in the India smart kitchen appliances market, with a significant market share and a strong impact on industry developments.
- Haier Appliances India Pvt. Ltd.
- Panasonic Life Solutions India Pvt. Ltd.
- BSH Household Appliances Manufacturing Pvt. Ltd.
- LG Electronics India Pvt. Ltd.
- Samsung India Electronics Pvt. Ltd.
- Whirlpool of India Ltd.
- Godrej Appliances (Godrej & Boyce Manufacturing Company Ltd.)
- IFB Industries Ltd.
- Versuni India Home Solutions Ltd.
- Voltas Beko Home Appliances Pvt. Ltd.
Market News & Updates
- Samsung India Electronics Pvt. Ltd, 2025:
Samsung introduced its 2025 Bespoke AI appliance lineup in India, expanding AI Home across refrigerators and other connected home appliances with SmartThings integration, AI Home displays, Knox security, and AI-powered energy and food-management features. This is a major smart-kitchen update because it moves Indian kitchens further toward app-controlled, voice-enabled, connected appliance ecosystems rather than standalone hardware purchases.
- Haier Appliances India Pvt. Ltd., 2025:
Haier launched the Lumiere Series, described as India’s only 4-door convertible side-by-side refrigerator range, combining AI-powered technology, convertible storage, and premium design. This matters for the smart kitchen appliances market because refrigerators remain the center of connected kitchen adoption, and Haier’s launch pushes intelligent storage, energy efficiency, and premium smart-refrigeration features further into Indian households.
Frequently Asked Questions
Related Report
- Market Segmentation
- Research Scope
- Research Methodology
- Definitions and Assumptions
- Executive Summary
- India Smart Kitchen Appliances Market Policies, Regulations, and Standards
- India Smart Kitchen Appliances Market Dynamics
- Growth Factors
- Challenges
- Trends
- Opportunities
- India Smart Kitchen Appliances Market Statistics, 2022-2032F
- Market Size & Growth Outlook
- By Revenues in USD Million
- Market Segmentation & Growth Outlook
- By Product Type
- Cooking Appliances- Market Insights and Forecast 2022-2032, USD Million
- Smart Ovens- Market Insights and Forecast 2022-2032, USD Million
- Smart Induction Cooktops- Market Insights and Forecast 2022-2032, USD Million
- Smart Microwaves- Market Insights and Forecast 2022-2032, USD Million
- Smart Air Fryers- Market Insights and Forecast 2022-2032, USD Million
- Smart Slow Cookers- Market Insights and Forecast 2022-2032, USD Million
- Food Storage- Market Insights and Forecast 2022-2032, USD Million
- Smart Refrigerators- Market Insights and Forecast 2022-2032, USD Million
- Smart Wine Coolers- Market Insights and Forecast 2022-2032, USD Million
- Food Preparation- Market Insights and Forecast 2022-2032, USD Million
- Smart Coffee Makers- Market Insights and Forecast 2022-2032, USD Million
- Smart Blenders- Market Insights and Forecast 2022-2032, USD Million
- Smart Kitchen Scales- Market Insights and Forecast 2022-2032, USD Million
- Cleaning Appliances- Market Insights and Forecast 2022-2032, USD Million
- Smart Dishwashers- Market Insights and Forecast 2022-2032, USD Million
- Cooking Appliances- Market Insights and Forecast 2022-2032, USD Million
- By Connectivity Type
- Wireless Internet Connectivity- Market Insights and Forecast 2022-2032, USD Million
- Wi-Fi- Market Insights and Forecast 2022-2032, USD Million
- Short-Range Connectivity- Market Insights and Forecast 2022-2032, USD Million
- Bluetooth- Market Insights and Forecast 2022-2032, USD Million
- NFC- Market Insights and Forecast 2022-2032, USD Million
- Smart Home Protocols- Market Insights and Forecast 2022-2032, USD Million
- Zigbee- Market Insights and Forecast 2022-2032, USD Million
- Thread- Market Insights and Forecast 2022-2032, USD Million
- Others - Market Insights and Forecast 2022-2032, USD Million
- Wireless Internet Connectivity- Market Insights and Forecast 2022-2032, USD Million
- By Control Type
- App-Controlled- Market Insights and Forecast 2022-2032, USD Million
- Voice-Controlled- Market Insights and Forecast 2022-2032, USD Million
- Touch / Remote Controlled- Market Insights and Forecast 2022-2032, USD Million
- By Price Range
- Low / Economy- Market Insights and Forecast 2022-2032, USD Million
- Mid-Range- Market Insights and Forecast 2022-2032, USD Million
- Premium - Market Insights and Forecast 2022-2032, USD Million
- By Sales Channel
- Retail Online- Market Insights and Forecast 2022-2032, USD Million
- Direct Sale- Market Insights and Forecast 2022-2032, USD Million
- E-Commerce- Market Insights and Forecast 2022-2032, USD Million
- Retail Offline- Market Insights and Forecast 2022-2032, USD Million
- Direct Sale- Market Insights and Forecast 2022-2032, USD Million
- Supermarkets / Hypermarkets- Market Insights and Forecast 2022-2032, USD Million
- Specialty Stores- Market Insights and Forecast 2022-2032, USD Million
- Brand Stores- Market Insights and Forecast 2022-2032, USD Million
- Retail Online- Market Insights and Forecast 2022-2032, USD Million
- By End User
- Residential- Market Insights and Forecast 2022-2032, USD Million
- Commercial- Market Insights and Forecast 2022-2032, USD Million
- By Region
- North
- East
- West
- South
- By Competitors
- Competition Characteristics
- Market Share & Analysis
- By Product Type
- Market Size & Growth Outlook
- India Cooking Appliances Market Statistics, 2022-2032
- Market Size & Growth Outlook
- By Revenues in USD Million
- Market Segmentation & Growth Outlook
- By Connectivity Type- Market Insights and Forecast 2022-2032, USD Million
- By Control Type- Market Insights and Forecast 2022-2032, USD Million
- By Price Range- Market Insights and Forecast 2022-2032, USD Million
- By Sales Channel- Market Insights and Forecast 2022-2032, USD Million
- By End User- Market Insights and Forecast 2022-2032, USD Million
- By Region- Market Insights and Forecast 2022-2032, USD Million
- Market Size & Growth Outlook
- India Food Storage Market Statistics, 2022-2032
- Market Size & Growth Outlook
- By Revenues in USD Million
- Market Segmentation & Growth Outlook
- By Connectivity Type- Market Insights and Forecast 2022-2032, USD Million
- By Control Type- Market Insights and Forecast 2022-2032, USD Million
- By Price Range- Market Insights and Forecast 2022-2032, USD Million
- By Sales Channel- Market Insights and Forecast 2022-2032, USD Million
- By End User- Market Insights and Forecast 2022-2032, USD Million
- By Region- Market Insights and Forecast 2022-2032, USD Million
- Market Size & Growth Outlook
- India Food Preparation Market Statistics, 2022-2032
- Market Size & Growth Outlook
- By Revenues in USD Million
- Market Segmentation & Growth Outlook
- By Connectivity Type- Market Insights and Forecast 2022-2032, USD Million
- By Control Type- Market Insights and Forecast 2022-2032, USD Million
- By Price Range- Market Insights and Forecast 2022-2032, USD Million
- By Sales Channel- Market Insights and Forecast 2022-2032, USD Million
- By End User- Market Insights and Forecast 2022-2032, USD Million
- By Region- Market Insights and Forecast 2022-2032, USD Million
- Market Size & Growth Outlook
- India Cleaning Appliances Market Statistics, 2022-2032
- Market Size & Growth Outlook
- By Revenues in USD Million
- Market Segmentation & Growth Outlook
- By Connectivity Type- Market Insights and Forecast 2022-2032, USD Million
- By Control Type- Market Insights and Forecast 2022-2032, USD Million
- By Price Range- Market Insights and Forecast 2022-2032, USD Million
- By Sales Channel- Market Insights and Forecast 2022-2032, USD Million
- By End User- Market Insights and Forecast 2022-2032, USD Million
- By Region- Market Insights and Forecast 2022-2032, USD Million
- Market Size & Growth Outlook
- Competitive Outlook
- Company Profiles
- LG Electronics India Pvt. Ltd.
- Business Description
- Product Portfolio
- Collaborations & Alliances
- Recent Developments
- Financial Details
- Others
- Samsung India Electronics Pvt. Ltd.
- Business Description
- Product Portfolio
- Collaborations & Alliances
- Recent Developments
- Financial Details
- Others
- Whirlpool of India Ltd.
- Business Description
- Product Portfolio
- Collaborations & Alliances
- Recent Developments
- Financial Details
- Others
- Godrej Appliances (Godrej & Boyce Manufacturing Company Ltd.)
- Business Description
- Product Portfolio
- Collaborations & Alliances
- Recent Developments
- Financial Details
- Others
- IFB Industries Ltd.
- Business Description
- Product Portfolio
- Collaborations & Alliances
- Recent Developments
- Financial Details
- Others
- Haier Appliances India Pvt. Ltd.
- Business Description
- Product Portfolio
- Collaborations & Alliances
- Recent Developments
- Financial Details
- Others
- Panasonic Life Solutions India Pvt. Ltd.
- Business Description
- Product Portfolio
- Collaborations & Alliances
- Recent Developments
- Financial Details
- Others
- BSH Household Appliances Manufacturing Pvt. Ltd.
- Business Description
- Product Portfolio
- Collaborations & Alliances
- Recent Developments
- Financial Details
- Others
- Versuni India Home Solutions Ltd.
- Business Description
- Product Portfolio
- Collaborations & Alliances
- Recent Developments
- Financial Details
- Others
- Voltas Beko Home Appliances Pvt. Ltd.
- Business Description
- Product Portfolio
- Collaborations & Alliances
- Recent Developments
- Financial Details
- Others
- LG Electronics India Pvt. Ltd.
- Company Profiles
- Disclaimer
| Segment | Sub-Segment |
|---|---|
| By Product Type |
|
| By Connectivity Type |
|
| By Control Type |
|
| By Price Range |
|
| By Sales Channel |
|
| By End User |
|
| By Region |
|
Research Methodology
This study followed a structured approach comprising four key phases to assess the size and scope of the electro-oxidation market. The process began with thorough secondary research to collect data on the target market, related markets, and broader industry context. These findings, along with preliminary assumptions and estimates, were then validated through extensive primary research involving industry experts from across the value chain. To calculate the overall market size, both top-down and bottom-up methodologies were employed. Finally, market segmentation and data triangulation techniques were applied to refine and validate segment-level estimations.
Secondary Research
The secondary research phase involved gathering data from a wide range of credible and published sources. This step helped in identifying industry trends, defining market segmentation, and understanding the market landscape and value chain.
Sources consulted during this phase included:
- Company annual reports, investor presentations, and press releases
- Industry white papers and certified publications
- Trade directories and market-recognized databases
- Articles from authoritative authors and reputable journals
- Gold and silver standard websites
Secondary research was critical in mapping out the industry's value chain and monetary flow, identifying key market segments, understanding regional variations, and tracking significant industry developments.
Other key sources:
- Financial disclosures
- Industry associations and trade bodies
- News outlets and business magazines
- Academic journals and research studies
- Paid industry databases
Primary Research
To validate secondary data and gain deeper market insights, primary research was conducted with key stakeholders across both the supply and demand sides of the market.
On the demand side, participants included decision-makers and influencers from end-user industries—such as CIOs, CTOs, and CSOs—who provided first-hand perspectives on market needs, product usage, and future expectations.
On the supply side, interviews were conducted with manufacturers, industry associations, and institutional participants to gather insights into current offerings, product pipelines, and market challenges.
Primary interviews provided critical inputs such as:
- Market size and revenue data
- Product and service breakdowns
- Market forecasts
- Regional and application-specific trends
Stakeholders consulted included:
- Leading OEM and solution providers
- Channel and distribution partners
- End users across various applications
- Independent consultants and industry specialists
Market Size Estimation and Data Triangulation
- Identifying Key Market Participants (Secondary Research)
- Goal: To identify the major players or companies in the target market. This typically involves using publicly available data sources such as industry reports, market research publications, and financial statements of companies.
- Tools: Reports from firms like Gartner, Forrester, Euromonitor, Statista, IBISWorld, and others. Public financial statements, news articles, and press releases from top market players.
- Extracting Earnings of Key Market Participants
- Goal: To estimate the earnings generated from the product or service being analyzed. This step helps in understanding the revenue potential of each market player in a specific geography.
- Methods: Earnings data can be gathered from:
- Publicly available financial reports (for listed companies).
- Interviews and primary data sources from professionals, such as Directors, VPs, SVPs, etc. This is especially useful for understanding more nuanced, internal data that isn't publicly disclosed.
- Annual reports and investor presentations of key players.
- Data Collation and Development of a Relevant Data Model
- Goal: To collate inputs from both primary and secondary sources into a structured, data-driven model for market estimation. This model will incorporate key market KPIs and any independent variables relevant to the market.
- Key KPIs: These could include:
- Market size, growth rate, and demand drivers.
- Industry-specific metrics like market share, average revenue per customer (ARPC), or average deal size.
- External variables, such as economic growth rates, inflation rates, or commodity prices, that could affect the market.
- Data Modeling: Based on this data, the market forecasts are developed for the next 5 years. A combination of trend analysis, scenario modeling, and statistical regression might be used to generate projections.
- Scenario Analysis
- Goal: To test different assumptions and validate how sensitive the market is to changes in key variables (e.g., market demand, regulatory changes, technological disruptions).
- Types of Scenarios:
- Base Case: Based on current assumptions and historical data.
- Best-Case Scenario: Assuming favorable market conditions, regulatory environments, and technological advancements.
- Worst-Case Scenario: Accounting for adverse factors, such as economic downturns, stricter regulations, or unexpected disruptions.


