Europe Fuel Cell Electric Vehicle Market Report: Trends, Growth and Forecast (2026-2032)
By Vehicle (Passenger Vehicles (Hatchback, Sedan, SUV), Commercial Vehicles (Light Commercial Vehicles (LCV), Medium Commercial Vehicles (MCV), Heavy Commercial Vehicles (HCV))), By Fuel Cell (Proton Exchange Membrane Fuel Cells (PEMFC), Phosphoric Acid Fuel Cells (PAFC), Solid Oxide Fuel Cells (SOFC)), By Range (Short Range (Below 250 Miles), Medium Range (250 – 500 Miles), Long Range (Above 500 Miles)), By Application (Personal Use, Public Transport, Freight & Logistics), By Refueling Infrastructure (On-Board Hydrogen Storage, Off-Board Hydrogen Refueling), By End User (Private, Fleet Operators), By Country (Germany, United Kingdom, France, Italy, Spain, Rest of Europe) ... Read more
|
Major Players
|
Europe Fuel Cell Electric Vehicle Market Statistics and Insights, 2026
- Market Size Statistics
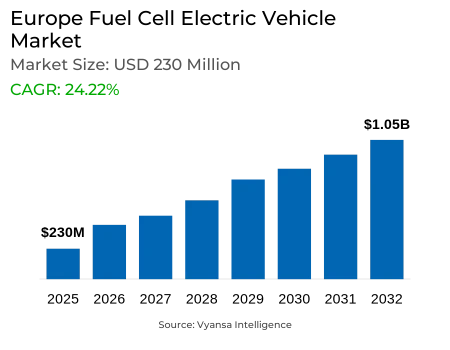
- Europe Fuel Cell Electric Vehicle Market is estimated at $ 230 Million.
- The market size is expected to grow to $ 1.05 Billion by 2032.
- Market to register a CAGR of around 24.22% during 2026-32.
- Vehicle Shares
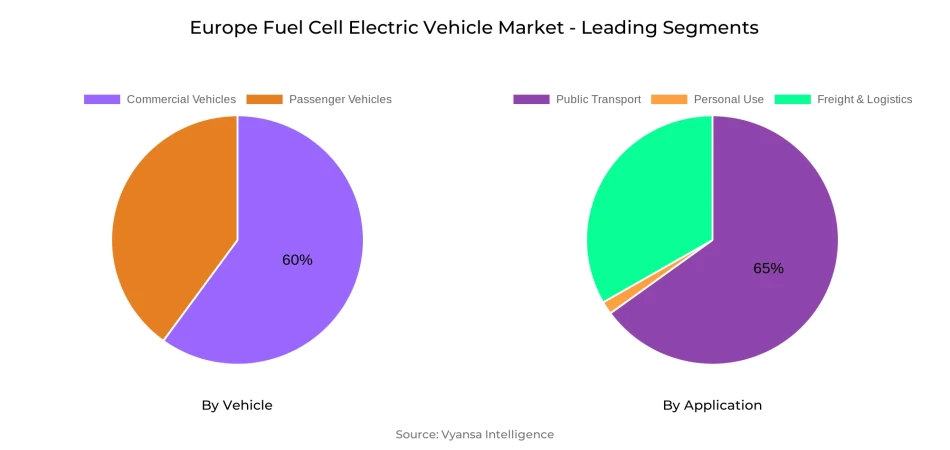
- Commercial Vehicles grabbed market share of 60%.
- Competition
- More than 10 companies are actively engaged in producing Fuel Cell Electric Vehicle in Europe.
- Top 5 companies acquired 55% of the market share.
- Renault, Volkswagen AG, Volvo Group, Toyota Motor Corporation, Hyundai Motor Company etc., are few of the top companies.
- Application
- Public Transport grabbed 65% of the market.
- Country
- Germany leads with a 40% share of the Europe Market.
Europe Fuel Cell Electric Vehicle Market Outlook
Europe Fuel Cell Electric Vehicle Market 2026-32 will grow strongly, supported by extensive government policies encouraging hydrogen deployment. Tax breaks, subsidies, and advantageous financing strategies are rendering FCEVs more competitive, especially for fleet operators. Public transport is at the forefront of adoption, with hydrogen buses capturing 65% of new zero-emission orders in urban centers. Moreover, strategic investment in refueling infrastructure, like Germany's €9 billion hydrogen plan, is giving confidence to OEMs and logistics suppliers that there will be a supportive ecosystem for mass-scale deployment. Thus, the market will grow from $230 Million in 2025 to $1.05 Billion in 2032 at an impressive CAGR of approximately 24.22% during 2026-32.
Commercial vehicles lead the market, with 60% market share, due to their high utilization and aptness to incorporate hydrogen. Modular fuel cell architecture enables smooth transition into trucks, vans, and light commercial vehicles to facilitate both last-mile delivery and long-haul use. Rapid refueling and long ranges position the vehicles as economically viable options for logistics and public transport markets. While passenger cars are still niche, their increasing adoption helps drive infrastructure use and promote awareness, which supports commercial FCEVs' expansion throughout Europe.
Public transport is the largest application segment, which held 65% of new zero-emission bus deployments. City governments favor hydrogen buses due to their large range, fast refueling, and ability to provide continuous service on high-density urban routes. Logistics and passenger transport segments are also developing steadily due to modular fuel cell designs for light commercial vehicles and passenger car environmental incentive programs. These uses are increasingly diversifying market demand and enabling long-term uptake of hydrogen mobility in Europe.
The regional market is dominated by Germany with a 40% share, supported by strong industrial backing, comprehensive policy frameworks, and an established network of refueling stations. Strategic partnerships between OEMs and power companies have formed a sustainable system, which has emerged as a model for the neighboring nations of France, the United Kingdom, and Italy. When these economies emulate Germany's strategy, economies of scale, reduced component costs, and increased competitiveness are likely to further bolster the Europe Fuel Cell Electric Vehicle Market between 2026-32.

Europe Fuel Cell Electric Vehicle Market Growth Driver
Policy Support Driving Market Expansion
Governments all over Europe are adopting ambitious hydrogen plans that drive the uptake of fuel cell electric vehicles (FCEVs) much faster. Tax credits, subsidies, and positive financing packages are reducing initial capital costs for fleet operators, making FCEVs more competitive with traditional options. Public transport operators are quickest to switch away from diesel, with hydrogen models now winning 65% of new zero-emission bus orders in major European cities. This points to the success of policy-driven adoption and the role of the government in influencing a greener mobility ecosystem.
Moreover, dedicated funding for refueling infrastructure solidifies OEM and logistics provider market confidence. Germany's €9 billion hydrogen initiative is among national commitments that are establishing the basis for long-term expansion. The interventions not only respond to infrastructure deficits but also provide a favorable backdrop for large-scale FCEV deployment, solidifying Europe as the champion of hydrogen fuel cell mobility.
Europe Fuel Cell Electric Vehicle Market Challenge
Infrastructure Barriers Restricting Broader Uptake
In spite of supportive policies, hydrogen refueling infrastructure development continues to be uneven on the continent. City centers enjoy increasing station density, but rural areas and intercity corridors still have sparse coverage. This unequal access hinders long-distance and freight operators, who need predictable and reliable refueling stops. In addition, the absence of properly qualified technicians with knowledge in servicing high-pressure hydrogen systems is a cause for concern regarding operational readiness and reliability.
Yet another significant barrier is the vast initial investment to set up refueling stations, which in many cases exceeds €1 million per location. This discourages private sector participation and retards the rate of network build-out. Without targeted policies from governments to facilitate the development of standardized stations and private capital attraction, the rate of adoption might be retarded, lowering confidence among end users who require long-term operating certainty.
Unlock Market Intelligence
Explore the market potential with our data-driven report
Europe Fuel Cell Electric Vehicle Market Trend
Technological Shifts Reshaping Mobility Models
Technical improvements in fuel cell stack technology are enhancing efficiency, longevity, and reliability, reducing degradation levels by almost 30% over a five-year period. These advances increase the economic competitiveness of FCEVs by cutting replacement and maintenance costs. Modular fuel cell technology also facilitates easier integration into light commercial vehicles, expanding their use in urban logistics and last-mile delivery services. This versatility is increasingly moving FCEVs from a niche to a mainstream transport option.
At the same time, hybrid designs that integrate fuel cells and batteries are increasingly popular. These vehicles maximize energy consumption in repeated stop-and-go driving, particularly for urban buses. On-road tests show that hybrid FCEVs deliver more than 20% superior energy efficiency compared to battery-electric buses in heavy traffic in cities. This diversification of designs reflects the flexibility of hydrogen technologies as a viable option in several mobility segments in Europe.
Europe Fuel Cell Electric Vehicle Market Opportunity
Expanding Commercial Fleet Potential
Commercial fleets is one of the most promising markets for FCEV uptake, aided by the technology's capability to offer both long range and fast refueling. Heavy-duty trucks tested already achieve more than 500 km range per fill-up, with refueling time as low as 20 minutes. This makes fuel cells a viable option for freight and logistics businesses where downtime incurs direct cost burdens. Collaborations between OEMs and fuel suppliers are also reducing risks by providing bundled vehicle and fuel packages, reducing end users' total cost of ownership.
Corporate sustainability programs are also nudging operators towards zero-emission solutions. With green hydrogen production being scaled up, cost equivalence with diesel on high-utilization corridors is achievable, and FCEVs become an economically viable option. With increasing adoption in heavy-duty fleets, the segment is likely to create huge demand, with lucrative opportunities for energy suppliers, vehicle makers, and infrastructure developers in Europe.
Europe Fuel Cell Electric Vehicle Market Country Analysis
Germany has the largest market share in the Europe Fuel Cell Electric Vehicle Market at 40% of total deployment. The leadership is fueled by solid industrial backing, firm policy commitment, and an advanced refueling infrastructure. Strategic collaboration among top OEMs and energy companies has established an accommodative ecosystem that speeds up production and deployment. This model has placed Germany at the forefront, driving investment strategies throughout the continent.
Germany's neighboring nations are watching closely as its hydrogen rollout plans are mimicked and its best practices copied. Its incentive programs, infrastructure planning, and technology partnerships are being borrowed in markets like France, the United Kingdom, and Italy. When these plans mature, regional aggregation within Germany will fuel economies of scale, lower component prices, and encourage greater competitiveness in the European FCEV market.
Unlock Market Intelligence
Explore the market potential with our data-driven report
Europe Fuel Cell Electric Vehicle Market Segmentation Analysis
By Vehicle
- Passenger Vehicles
- Commercial Vehicles
Commercial vehicles segment has the highest market share of around 60% under the vehicle type segment because they are highly utilized and can adopt hydrogen with ease. Modular fuel cell architecture now facilitates seamless integration into vans and trucks, and can enable last-mile delivery and long-haul freight services. Fast refueling and greater ranges allow fleet operators to be economically competitive for logistics and public transport applications. Ongoing technological advances in fuel cell stacks and supporting systems contribute further to the reliability and efficiency of commercial FCEVs.
Passenger cars are increasing acceptance but adoption is still focused in niche areas. Incentive programs and green commitments attract early adopters. Passenger cars have lesser contributions towards overall volumes but support driving infrastructure utilization and raise consumer awareness. Commercial vehicles will maintain the largest share of the market during the forecast period, while passenger cars slowly increase as urban fleets and private individual end users take up hydrogen cars.
By Application
- Personal Use
- Public Transport
- Freight & Logistics
Public transport is the biggest use in the Europe Fuel Cell Electric Vehicle Market, with 65% of new zero-emission bus deployments. Hydrogen buses are preferred by city authorities because they have long range, fast refueling, and can operate continuously on high-density urban corridors. Municipal transit agencies use their purchasing power to enable high-volume adoption, building a foundation for a sustainable hydrogen economy. This focus emphasizes the pivotal position of public sector end users in early commercialization.
Logistics and passenger mobility applications are coming on stream gradually. Light commercial vehicles increasingly undergo trial for last-mile delivery, taking advantage of modular fuel cell technology and reduced turnaround time. Passenger cars move into niche urban and fleet applications, inspired by environmental protection regulations and incentive schemes. While these segments now account for a smaller fraction of the market, their incremental growth supports public transport expansion, driving overall market diversification and long-term hydrogen uptake in Europe.
Top Companies in Europe Fuel Cell Electric Vehicle Market
The top companies operating in the market include Renault, Volkswagen AG, Volvo Group, Toyota Motor Corporation, Hyundai Motor Company, Honda Motor Corporation, BMW Group, Daimler AG, Iveco Group, Nikola Corporation, Hopium, Riversimple, etc., are the top players operating in the Europe Fuel Cell Electric Vehicle Market.
Frequently Asked Questions
Related Report
1. Market Segmentation
1.1. Research Scope
1.2. Research Methodology
1.3. Definitions and Assumptions
2. Executive Summary
3. Europe Fuel Cell Electric Vehicle Market Policies, Regulations, and Standards
4. Europe Fuel Cell Electric Vehicle Market Dynamics
4.1. Growth Factors
4.2. Challenges
4.3. Trends
4.4. Opportunities
5. Europe Fuel Cell Electric Vehicle Market Statistics, 2022-2032F
5.1. Market Size & Growth Outlook
5.1.1. By Revenues in US$ Million
5.2. Market Segmentation & Growth Outlook
5.2.1. By Vehicle
5.2.1.1. Passenger Vehicles- Market Insights and Forecast 2022-2032, USD Million
5.2.1.1.1. Hatchback- Market Insights and Forecast 2022-2032, USD Million
5.2.1.1.2. Sedan- Market Insights and Forecast 2022-2032, USD Million
5.2.1.1.3. SUV- Market Insights and Forecast 2022-2032, USD Million
5.2.1.2. Commercial Vehicles- Market Insights and Forecast 2022-2032, USD Million
5.2.1.2.1. Light Commercial Vehicles (LCV)- Market Insights and Forecast 2022-2032, USD Million
5.2.1.2.2. Medium Commercial Vehicles (MCV)- Market Insights and Forecast 2022-2032, USD Million
5.2.1.2.3. Heavy Commercial Vehicles (HCV)- Market Insights and Forecast 2022-2032, USD Million
5.2.2. By Fuel Cell
5.2.2.1. Proton Exchange Membrane Fuel Cells (PEMFC)- Market Insights and Forecast 2022-2032, USD Million
5.2.2.2. Phosphoric Acid Fuel Cells (PAFC)- Market Insights and Forecast 2022-2032, USD Million
5.2.2.3. Solid Oxide Fuel Cells (SOFC)- Market Insights and Forecast 2022-2032, USD Million
5.2.3. By Range
5.2.3.1. Short Range (Below 250 Miles)- Market Insights and Forecast 2022-2032, USD Million
5.2.3.2. Medium Range (250 – 500 Miles)- Market Insights and Forecast 2022-2032, USD Million
5.2.3.3. Long Range (Above 500 Miles)- Market Insights and Forecast 2022-2032, USD Million
5.2.4. By Application
5.2.4.1. Personal Use- Market Insights and Forecast 2022-2032, USD Million
5.2.4.2. Public Transport- Market Insights and Forecast 2022-2032, USD Million
5.2.4.3. Freight & Logistics- Market Insights and Forecast 2022-2032, USD Million
5.2.5. By Refueling Infrastructure
5.2.5.1. On-Board Hydrogen Storage- Market Insights and Forecast 2022-2032, USD Million
5.2.5.2. Off-Board Hydrogen Refueling- Market Insights and Forecast 2022-2032, USD Million
5.2.6. By End User
5.2.6.1. Private- Market Insights and Forecast 2022-2032, USD Million
5.2.6.2. Fleet Operators- Market Insights and Forecast 2022-2032, USD Million
5.2.7. By Country
5.2.7.1. Germany
5.2.7.2. United Kingdom
5.2.7.3. France
5.2.7.4. Italy
5.2.7.5. Spain
5.2.7.6. Rest of Europe
5.2.8. By Competitors
5.2.8.1. Competition Characteristics
5.2.8.2. Market Share & Analysis
6. Germany Fuel Cell Electric Vehicle Market Statistics, 2022-2032F
6.1. Market Size & Growth Outlook
6.1.1. By Revenues in US$ Million
6.2. Market Segmentation & Growth Outlook
6.2.1. By Vehicle- Market Insights and Forecast 2022-2032, USD Million
6.2.2. By Fuel Cell- Market Insights and Forecast 2022-2032, USD Million
6.2.3. By Range- Market Insights and Forecast 2022-2032, USD Million
6.2.4. By Application- Market Insights and Forecast 2022-2032, USD Million
6.2.5. By Refueling Infrastructure- Market Insights and Forecast 2022-2032, USD Million
6.2.6. By End User- Market Insights and Forecast 2022-2032, USD Million
7. United Kingdom Fuel Cell Electric Vehicle Market Statistics, 2022-2032F
7.1. Market Size & Growth Outlook
7.1.1. By Revenues in US$ Million
7.2. Market Segmentation & Growth Outlook
7.2.1. By Vehicle- Market Insights and Forecast 2022-2032, USD Million
7.2.2. By Fuel Cell- Market Insights and Forecast 2022-2032, USD Million
7.2.3. By Range- Market Insights and Forecast 2022-2032, USD Million
7.2.4. By Application- Market Insights and Forecast 2022-2032, USD Million
7.2.5. By Refueling Infrastructure- Market Insights and Forecast 2022-2032, USD Million
7.2.6. By End User- Market Insights and Forecast 2022-2032, USD Million
8. France Fuel Cell Electric Vehicle Market Statistics, 2022-2032F
8.1. Market Size & Growth Outlook
8.1.1. By Revenues in US$ Million
8.2. Market Segmentation & Growth Outlook
8.2.1. By Vehicle- Market Insights and Forecast 2022-2032, USD Million
8.2.2. By Fuel Cell- Market Insights and Forecast 2022-2032, USD Million
8.2.3. By Range- Market Insights and Forecast 2022-2032, USD Million
8.2.4. By Application- Market Insights and Forecast 2022-2032, USD Million
8.2.5. By Refueling Infrastructure- Market Insights and Forecast 2022-2032, USD Million
8.2.6. By End User- Market Insights and Forecast 2022-2032, USD Million
9. Italy Fuel Cell Electric Vehicle Market Statistics, 2022-2032F
9.1. Market Size & Growth Outlook
9.1.1. By Revenues in US$ Million
9.2. Market Segmentation & Growth Outlook
9.2.1. By Vehicle- Market Insights and Forecast 2022-2032, USD Million
9.2.2. By Fuel Cell- Market Insights and Forecast 2022-2032, USD Million
9.2.3. By Range- Market Insights and Forecast 2022-2032, USD Million
9.2.4. By Application- Market Insights and Forecast 2022-2032, USD Million
9.2.5. By Refueling Infrastructure- Market Insights and Forecast 2022-2032, USD Million
9.2.6. By End User- Market Insights and Forecast 2022-2032, USD Million
10. Spain Fuel Cell Electric Vehicle Market Statistics, 2022-2032F
10.1.Market Size & Growth Outlook
10.1.1. By Revenues in US$ Million
10.2.Market Segmentation & Growth Outlook
10.2.1. By Vehicle- Market Insights and Forecast 2022-2032, USD Million
10.2.2. By Fuel Cell- Market Insights and Forecast 2022-2032, USD Million
10.2.3. By Range- Market Insights and Forecast 2022-2032, USD Million
10.2.4. By Application- Market Insights and Forecast 2022-2032, USD Million
10.2.5. By Refueling Infrastructure- Market Insights and Forecast 2022-2032, USD Million
10.2.6. By End User- Market Insights and Forecast 2022-2032, USD Million
11. Competitive Outlook
11.1.Company Profiles
11.1.1. Toyota Motor Corporation
11.1.1.1. Business Description
11.1.1.2. Product Portfolio
11.1.1.3. Collaborations & Alliances
11.1.1.4. Recent Developments
11.1.1.5. Financial Details
11.1.1.6. Others
11.1.2. Hyundai Motor Company
11.1.2.1. Business Description
11.1.2.2. Product Portfolio
11.1.2.3. Collaborations & Alliances
11.1.2.4. Recent Developments
11.1.2.5. Financial Details
11.1.2.6. Others
11.1.3. Honda Motor Corporation
11.1.3.1. Business Description
11.1.3.2. Product Portfolio
11.1.3.3. Collaborations & Alliances
11.1.3.4. Recent Developments
11.1.3.5. Financial Details
11.1.3.6. Others
11.1.4. BMW Group
11.1.4.1. Business Description
11.1.4.2. Product Portfolio
11.1.4.3. Collaborations & Alliances
11.1.4.4. Recent Developments
11.1.4.5. Financial Details
11.1.4.6. Others
11.1.5. Daimler AG
11.1.5.1. Business Description
11.1.5.2. Product Portfolio
11.1.5.3. Collaborations & Alliances
11.1.5.4. Recent Developments
11.1.5.5. Financial Details
11.1.5.6. Others
11.1.6. Renault
11.1.6.1. Business Description
11.1.6.2. Product Portfolio
11.1.6.3. Collaborations & Alliances
11.1.6.4. Recent Developments
11.1.6.5. Financial Details
11.1.6.6. Others
11.1.7. Volkswagen AG
11.1.7.1. Business Description
11.1.7.2. Product Portfolio
11.1.7.3. Collaborations & Alliances
11.1.7.4. Recent Developments
11.1.7.5. Financial Details
11.1.7.6. Others
11.1.8. Volvo Group
11.1.8.1. Business Description
11.1.8.2. Product Portfolio
11.1.8.3. Collaborations & Alliances
11.1.8.4. Recent Developments
11.1.8.5. Financial Details
11.1.8.6. Others
11.1.9. Iveco Group
11.1.9.1. Business Description
11.1.9.2. Product Portfolio
11.1.9.3. Collaborations & Alliances
11.1.9.4. Recent Developments
11.1.9.5. Financial Details
11.1.9.6. Others
11.1.10. Nikola Corporation
11.1.10.1. Business Description
11.1.10.2. Product Portfolio
11.1.10.3. Collaborations & Alliances
11.1.10.4. Recent Developments
11.1.10.5. Financial Details
11.1.10.6. Others
11.1.11. Hopium
11.1.11.1. Business Description
11.1.11.2. Product Portfolio
11.1.11.3. Collaborations & Alliances
11.1.11.4. Recent Developments
11.1.11.5. Financial Details
11.1.11.6. Others
11.1.12. Riversimple
11.1.12.1. Business Description
11.1.12.2. Product Portfolio
11.1.12.3. Collaborations & Alliances
11.1.12.4. Recent Developments
11.1.12.5. Financial Details
11.1.12.6. Others
12. Disclaimer
| Segment | Sub-Segment |
|---|---|
| By Vehicle |
|
| By Fuel Cell |
|
| By Range |
|
| By Application |
|
| By Refueling Infrastructure |
|
| By End User |
|
| By Country |
|
Research Methodology
This study followed a structured approach comprising four key phases to assess the size and scope of the electro-oxidation market. The process began with thorough secondary research to collect data on the target market, related markets, and broader industry context. These findings, along with preliminary assumptions and estimates, were then validated through extensive primary research involving industry experts from across the value chain. To calculate the overall market size, both top-down and bottom-up methodologies were employed. Finally, market segmentation and data triangulation techniques were applied to refine and validate segment-level estimations.
Secondary Research
The secondary research phase involved gathering data from a wide range of credible and published sources. This step helped in identifying industry trends, defining market segmentation, and understanding the market landscape and value chain.
Sources consulted during this phase included:
- Company annual reports, investor presentations, and press releases
- Industry white papers and certified publications
- Trade directories and market-recognized databases
- Articles from authoritative authors and reputable journals
- Gold and silver standard websites
Secondary research was critical in mapping out the industry's value chain and monetary flow, identifying key market segments, understanding regional variations, and tracking significant industry developments.
Other key sources:
- Financial disclosures
- Industry associations and trade bodies
- News outlets and business magazines
- Academic journals and research studies
- Paid industry databases
Primary Research
To validate secondary data and gain deeper market insights, primary research was conducted with key stakeholders across both the supply and demand sides of the market.
On the demand side, participants included decision-makers and influencers from end-user industries—such as CIOs, CTOs, and CSOs—who provided first-hand perspectives on market needs, product usage, and future expectations.
On the supply side, interviews were conducted with manufacturers, industry associations, and institutional participants to gather insights into current offerings, product pipelines, and market challenges.
Primary interviews provided critical inputs such as:
- Market size and revenue data
- Product and service breakdowns
- Market forecasts
- Regional and application-specific trends
Stakeholders consulted included:
- Leading OEM and solution providers
- Channel and distribution partners
- End users across various applications
- Independent consultants and industry specialists
Market Size Estimation and Data Triangulation
- Identifying Key Market Participants (Secondary Research)
- Goal: To identify the major players or companies in the target market. This typically involves using publicly available data sources such as industry reports, market research publications, and financial statements of companies.
- Tools: Reports from firms like Gartner, Forrester, Euromonitor, Statista, IBISWorld, and others. Public financial statements, news articles, and press releases from top market players.
- Extracting Earnings of Key Market Participants
- Goal: To estimate the earnings generated from the product or service being analyzed. This step helps in understanding the revenue potential of each market player in a specific geography.
- Methods: Earnings data can be gathered from:
- Publicly available financial reports (for listed companies).
- Interviews and primary data sources from professionals, such as Directors, VPs, SVPs, etc. This is especially useful for understanding more nuanced, internal data that isn't publicly disclosed.
- Annual reports and investor presentations of key players.
- Data Collation and Development of a Relevant Data Model
- Goal: To collate inputs from both primary and secondary sources into a structured, data-driven model for market estimation. This model will incorporate key market KPIs and any independent variables relevant to the market.
- Key KPIs: These could include:
- Market size, growth rate, and demand drivers.
- Industry-specific metrics like market share, average revenue per customer (ARPC), or average deal size.
- External variables, such as economic growth rates, inflation rates, or commodity prices, that could affect the market.
- Data Modeling: Based on this data, the market forecasts are developed for the next 5 years. A combination of trend analysis, scenario modeling, and statistical regression might be used to generate projections.
- Scenario Analysis
- Goal: To test different assumptions and validate how sensitive the market is to changes in key variables (e.g., market demand, regulatory changes, technological disruptions).
- Types of Scenarios:
- Base Case: Based on current assumptions and historical data.
- Best-Case Scenario: Assuming favorable market conditions, regulatory environments, and technological advancements.
- Worst-Case Scenario: Accounting for adverse factors, such as economic downturns, stricter regulations, or unexpected disruptions.


