China Water Quality Testing & Monitoring Market Report: Trends, Growth and Forecast (2026-2032)
By Product Type (Water Quality Testing Instruments, Water Quality Sensors & Probes, Test Kits & Reagents, Online Water Quality Monitoring Systems, Portable Water Testing Devices, Software & Data Management Platforms, Others), By Parameter Type (Physical Parameters, Chemical Parameters, Biological/Microbiological Parameters, Radiological Parameters, Others), By Technology (Laboratory-Based Testing, Portable/Field Testing, Online/Real-Time Monitoring, IoT-Based Monitoring, Manual Testing, Others), By Water Source (Drinking Water, Wastewater & Effluent, Surface Water, Groundwater, Industrial Process Water, Recreational Water, Others), By End User (Municipal Water Utilities, Industrial Facilities, Environmental Agencies, Commercial Testing Laboratories, Research & Academic Institutes, Residential & Commercial Users, Others), By Sales Channel (Retail Online (Company-Owned Websites, E-Commerce Platforms, Online Laboratory Service Portals, B2B Procurement Platforms), Retail Offline (Direct Sales, Distributors/Dealers, Specialty Instrument Stores, Laboratory Equipment Suppliers, Local Authorized Sales Partners)), By Region (North, East, Southwest, Northwest, North East, South) ... Read more
|
Major Players
|
China Water Quality Testing & Monitoring Market Statistics and Insights, 2026
- Market Size Statistics
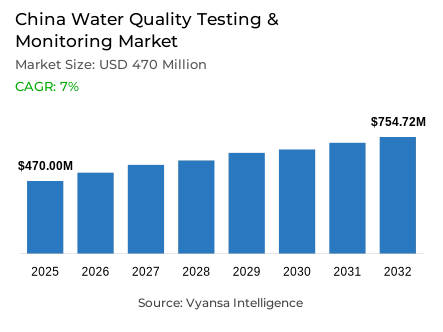
- Water quality testing & monitoring market size in China was valued at USD 470 million in 2025 and is estimated at USD 502.9 million in 2026.
- The market size is expected to grow to USD 754.72 million by 2032.
- Market to register a CAGR of around 7% during 2026-32.
- Product Type Shares
- Online water quality monitoring systems grabbed market share of 25%.
- Competition
- More than 10 companies are actively engaged in producing water quality testing & monitoring in China.
- Top 5 companies acquired around 20% of the market share.
- Beijing SDL Technology, Hangzhou Zetian / Tranlion, Jiangsu Skyray Instrument, Focused Photonics Inc., Lianhua Technology/Shanghai Lianhua etc., are few of the top companies.
- Parameter Type
- Chemical parameters grabbed 40% of the market.
China Water Quality Testing & Monitoring Market Outlook
Valued at USD 470 million in 2025, China water quality testing and monitoring market is advancing from USD 502.9 million in 2026 toward USD 754.72 million by 2032, representing 7% compound annual growth rate throughout the forecast window. This growth trajectory reflects steady expansion supported by rising monitoring needs, strengthened focus on water management, and growing use of systems improving testing efficiency and data visibility. Market momentum remains underpinned by expanding national water-governance execution with broader assessment coverage, standardized automated monitoring infrastructure rollout, and extension of monitoring networks into tributaries and smaller community-facing water bodies.
Stronger national water-governance execution establishes foundational market driver sustaining consistent demand for water quality testing and monitoring solutions throughout China. Evidence from Ministry of Ecology and Environment reveals 3,641 national surface-water assessment sections are monitored in 2024 with 90.4% meeting Grade I-III quality, up 1.0 percentage point year-on-year, establishing regulatory emphasis on continuous sampling and compliance. Published data from Chinese government indicates 2,573 water bodies are included in national list protecting and creating beautiful rivers and lakes under 2025-2027 action plan, with full coverage exceeding 6,300 kilometers of Yangtze trunk stream and over 5,400 kilometers of Yellow River trunk stream. This policy-driven expansion directly supports market growth through persistent demand for online systems, laboratory testing, and basin-level monitoring support addressing complex water governance priorities.
Standardized automated monitoring infrastructure and regulatory framework expansion reshape China water quality testing and monitoring market toward systematic technology deployment. Data from Ministry of Ecology and Environment indicates HJ 915.1-2024 standard for site selection and infrastructure construction of surface-water quality automated monitoring stations takes effect on July 1, 2025, establishing uniform site planning and infrastructure deployment requirements. Published guidance from Ministry of Ecology and Environment reveals HJ 915.3-2024 standard for operation and maintenance of automated monitoring stations also takes effect on July 1, 2025, covering conventional five parameters along with CODMn, NH3-N, TP, and TN. This standardization framework accelerates industry-wide adoption of real-time monitoring, quality control systems, and continuous data collection positioning online monitoring systems as market centerpiece.
Market segmentation demonstrates pronounced demand concentration within online monitoring infrastructure and chemical parameter analysis. Online Water Quality Monitoring Systems commands 25% market share through alignment with continuous observation and faster alert capabilities supporting operational visibility, while Chemical Parameters account for 40% of demand reflecting central importance of chemical analysis in contamination assessment. This China water quality testing and monitoring market structure indicates facility operators increasingly prioritize real-time monitoring solutions and comprehensive chemical analysis supporting compliance tracking and treatment performance optimization.

China Water Quality Testing & Monitoring Market Growth Driver
Policy Pressure Keeps Monitoring Demand Expanding
Expanding national water-governance execution and broader monitoring coverage establish sustained demand for water quality testing and monitoring solutions throughout China's aquatic infrastructure. Statistics from Ministry of Ecology and Environment confirm 3,641 national surface-water assessment sections are monitored in 2024 with 90.4% meeting Grade I-III quality standards, up 1.0 percentage point year-on-year, establishing regulatory focus on continuous performance tracking. This monitoring expansion directly translates into heightened market relevance for water quality testing solutions emphasizing accurate parameter measurement and rapid identification of water-quality shifts. Regulatory performance improvements create foundation for sustained monitoring investment ensuring authorities maintain oversight momentum addressing water quality priorities.
National policy framework expansion and river-lake protection initiatives strengthen commercial foundation for comprehensive water quality testing and monitoring systems. Published evidence from Chinese government indicates 2,573 water bodies are included in national list protecting and creating beautiful rivers and lakes under 2025-2027 action plan, with full coverage addressing more than 6,300 kilometers of Yangtze trunk stream and over 5,400 kilometers of Yellow River trunk stream. This expansive policy scope creates persistent demand for laboratory testing capabilities, online systems infrastructure, and basin-level monitoring support addressing complex water management requirements. Large-scale geographic coverage and multi-parameter monitoring requirements ensure sustained revenue generation for water quality testing and monitoring service providers throughout extended forecast period.
China Water Quality Testing & Monitoring Market Challenge
Chemical Complexity Keeps Detection Burdens High
Water quality testing and monitoring market faces substantial technical complexity navigating multiple difficult chemical indicators rather than single simplified measurement approaches. Official records from Ministry of Ecology and Environment indicate main exceeding indicators across 3,641 national surface-water assessment sections are chemical oxygen demand, permanganate index, and total phosphorus, requiring sophisticated monitoring protocols and stronger calibration discipline. This parameter complexity makes testing work technically demanding because suppliers and users must manage broader parameter coverage and more frequent quality checks. Multi-parameter approach increases operational burden and training requirements affecting service provider efficiency and cost structures.
Eutrophication stress and nutrient loading create additional operational complexity affecting monitoring program execution and treatment response requirements. Evidence from Ministry of Ecology and Environment reveals among 204 monitored key lakes and reservoirs in 2025, 55 are mildly eutrophic equal to 27%, while 3.3% of 209 monitored key lakes and reservoirs record worse than Grade V water quality. This widespread eutrophication indicates monitoring programs must handle nutrient stress, chemical loading, and changing local conditions simultaneously raising operating burden substantially. Service providers must develop adaptive monitoring protocols addressing regional water body variations and complex contamination patterns throughout China water quality testing and monitoring market.
Unlock Market Intelligence
Explore the market potential with our data-driven report
China Water Quality Testing & Monitoring Market Trend
Automated Networks Move Into the Mainstream
China water quality testing and monitoring industry demonstrates pronounced shift from periodic checking toward standardized automated monitoring infrastructure with uniform deployment and operation standards. Market data from Ministry of Ecology and Environment indicates HJ 915.1-2024 standard for site selection and infrastructure construction of surface-water quality automated monitoring stations takes effect on July 1, 2025, establishing regulatory requirements for systematic station planning and deployment. This standardization framework pushes industry toward technology-led monitoring replacing manual approaches, supporting market expansion for automated infrastructure and sensor-based solutions. Uniform standards enable scalable deployment across geographically dispersed monitoring points supporting systematic coverage of national assessment network.
Operating procedures standardization and real-time monitoring capability emphasis strengthen industry-wide technology adoption momentum. Published data from Ministry of Ecology and Environment reveals HJ 915.3-2024 standard for operation and maintenance of automated monitoring stations takes effect on July 1, 2025, covering conventional five parameters along with CODMn, NH3-N, TP, and TN. This operational framework establishes clear requirements for continuous data collection, quality control procedures, and standardized reporting supporting industry-wide adoption of real-time monitoring systems. Standardization enables service providers developing cloud-based water quality monitoring platforms and remote monitoring capabilities to establish competitive advantages within China market.
China Water Quality Testing & Monitoring Market Opportunity
Smaller Water Bodies Open a Wider Runway
Strong opportunities emerge in extending monitoring coverage beyond major rivers into tributaries and smaller water bodies supporting community-facing water asset management. Official records from Chinese government indicate China plans to add more than 200 small water bodies to water monitoring network during 15th Five-Year Plan period from 2026 to 2030, establishing substantial expansion roadmap. This monitoring network extension creates fresh demand for compact instruments, distributed sensors, and localized service models built for smaller monitoring points with different operational characteristics. Extended coverage generates market opportunities for portable testing solutions and simplified monitoring equipment serving fragmented smaller water body infrastructure.
Community-focused monitoring priorities and distributed water system expansion create meaningful commercial opportunities for localized solutions and data platforms. Evidence from Chinese government reveals China plans to add more than 200 tributaries and small water bodies to national surface-water monitoring network during 15th Five-Year Plan period from 2026 to 2030, establishing phased expansion addressing water body diversity. Published data from Chinese government indicates 89% of country's surface-water bodies are already at or above Grade III in first half 2025, establishing improved baseline supporting shift toward localized monitoring focusing on community-facing assets. Service providers developing portable testing equipment, IoT water quality monitoring systems, and localized data platforms designed for smaller water systems position themselves advantageously to capture growth opportunities throughout expanding tributary and small water body monitoring market.
Unlock Market Intelligence
Explore the market potential with our data-driven report
China Water Quality Testing & Monitoring Market Segmentation Analysis
By Product Type
- Water Quality Testing Instruments
- Water Quality Sensors & Probes
- Test Kits & Reagents
- Online Water Quality Monitoring Systems
- Portable Water Testing Devices
- Software & Data Management Platforms
- Others
Online water quality monitoring systems commands market leadership at 25% share within China water quality testing and monitoring market, establishing dominant product-type positioning through essential role in continuous observation and operational visibility. This market segment maintains leading position due to buyer prioritization of systems supporting continuous observation, faster alerts, and better visibility across water assets, generating sustained demand for real-time monitoring infrastructure. Online monitoring solutions deliver accessible positioning supporting routine water quality tracking while enabling rapid response to changing conditions, establishing broad appeal across municipal, industrial, and environmental applications. Market leadership reflects growing acceptance of automated monitoring replacing manual testing approaches.
This market leadership position reflects buyers' continued selection of continuous monitoring systems reducing gaps between testing cycles and response actions. Online water quality monitoring systems remain important because they help users track conditions more regularly and manage changing water-quality patterns more efficiently. The 25% market share indicates this segment continues shaping product demand, deployment priorities, and competitive focus across China water quality testing and monitoring market. Service providers developing advanced online monitoring capabilities with cloud-based data platforms and remote analytics positioning themselves advantageously for sustained market growth.

By Parameter Type
- Physical Parameters
- Chemical Parameters
- Biological/Microbiological Parameters
- Radiological Parameters
- Others
Chemical parameters commands market leadership at 40% share within China water quality testing and monitoring market, establishing dominant parameter-type positioning through central importance in contamination assessment and treatment performance evaluation. This market segment maintains leading position due to user prioritization of chemical analysis revealing pollution load and water-quality change more directly, supporting sustained demand for comprehensive chemical testing protocols. Chemical parameter solutions deliver accessible positioning supporting routine assessment and regulatory tracking while enabling operational decision-making across diverse water environments, establishing broad appeal across municipal, industrial, and environmental applications.
This market leadership position reflects users' continued selection of chemical parameter testing supporting contamination evaluation and compliance tracking. Chemical Parameters remain important because they support routine assessment, regulatory tracking, and operational decision-making across industrial, municipal, and environmental applications. The 40% market share indicates this segment continues shaping testing priorities, product development focus, and broader structure of competition throughout China water quality testing and monitoring market. Service providers developing sophisticated multiparameter water quality meters and comprehensive chemical testing equipment position themselves advantageously for sustained market growth throughout extended forecast period.
List of Companies Covered in China Water Quality Testing & Monitoring Market
The companies listed below are highly influential in the China water quality testing & monitoring market, with a significant market share and a strong impact on industry developments.
- Beijing SDL Technology
- Hangzhou Zetian / Tranlion
- Jiangsu Skyray Instrument
- Focused Photonics Inc.
- Lianhua Technology/Shanghai Lianhua
- Shanghai BOQU Instrument
- Shanghai Chunye Instrument Technology
- Sailhero
- Hach
- Xylem Analytics
Market News & Updates
- Xylem Analytics, 2026:
Xylem reported a major China wastewater-monitoring deployment with Beijing Enterprises Water Group, where new nitrogen limits affected more than 300 wastewater treatment plants and required stronger ammonia and nitrate visibility. The company validated WTW spectral nitrate analyzers and WTW ion-selective ammonia-nitrogen analyzers at BEWG’s Jiaozhou plant, after which the technology entered centralized procurement and enabled bulk deployment across hundreds of facilities. This is significant for China’s water quality testing and monitoring market because it shifts monitoring demand toward high-precision, real-time, process-control instruments that support compliance, energy efficiency, and operating-cost reduction. Xylem states that WTW-based process control can deliver energy savings above 10% in prior projects, making the update commercially important for large municipal wastewater networks.
- Hach, 2026:
Hach China highlighted its 20-year local R&D milestone in March 2026, emphasizing China-focused innovation, local supply-chain expansion, 29 developed products, and 15 patents/software copyrights. The company specifically cited the NP5800 total phosphorus online analyzer, developed in 14 months to respond to new environmental regulatory needs, and later detailed that the instrument complies with current Chinese water-quality monitoring standards while serving municipal wastewater, industrial discharge, surface water, aquaculture tailwater, and coastal monitoring applications. This strengthens Hach’s position in China by aligning product development with local compliance requirements and by reducing adoption barriers through training, diagnostics, and localized support. The update supports market growth toward smarter online analyzers with stronger reliability, predictive maintenance, and broader application coverage.
Frequently Asked Questions
Related Report
- Market Segmentation
- Research Scope
- Research Methodology
- Definitions and Assumptions
- Executive Summary
- China Water Quality Testing & Monitoring Market Policies, Regulations, and Standards
- China Water Quality Testing & Monitoring Market Dynamics
- Growth Factors
- Challenges
- Trends
- Opportunities
- China Water Quality Testing & Monitoring Market Statistics, 2022-2032F
- Market Size & Growth Outlook
- By Revenues in USD Million
- Market Segmentation & Growth Outlook
- By Product Type
- Water Quality Testing Instruments- Market Insights and Forecast 2022-2032, USD Million
- Water Quality Sensors & Probes- Market Insights and Forecast 2022-2032, USD Million
- Test Kits & Reagents- Market Insights and Forecast 2022-2032, USD Million
- Online Water Quality Monitoring Systems- Market Insights and Forecast 2022-2032, USD Million
- Portable Water Testing Devices- Market Insights and Forecast 2022-2032, USD Million
- Software & Data Management Platforms- Market Insights and Forecast 2022-2032, USD Million
- Others- Market Insights and Forecast 2022-2032, USD Million
- By Parameter Type
- Physical Parameters- Market Insights and Forecast 2022-2032, USD Million
- Chemical Parameters- Market Insights and Forecast 2022-2032, USD Million
- Biological/Microbiological Parameters- Market Insights and Forecast 2022-2032, USD Million
- Radiological Parameters- Market Insights and Forecast 2022-2032, USD Million
- Others- Market Insights and Forecast 2022-2032, USD Million
- By Technology
- Laboratory-Based Testing- Market Insights and Forecast 2022-2032, USD Million
- Portable/Field Testing- Market Insights and Forecast 2022-2032, USD Million
- Online/Real-Time Monitoring- Market Insights and Forecast 2022-2032, USD Million
- IoT-Based Monitoring- Market Insights and Forecast 2022-2032, USD Million
- Manual Testing- Market Insights and Forecast 2022-2032, USD Million
- Others- Market Insights and Forecast 2022-2032, USD Million
- By Water Source
- Drinking Water- Market Insights and Forecast 2022-2032, USD Million
- Wastewater & Effluent- Market Insights and Forecast 2022-2032, USD Million
- Surface Water- Market Insights and Forecast 2022-2032, USD Million
- Groundwater- Market Insights and Forecast 2022-2032, USD Million
- Industrial Process Water- Market Insights and Forecast 2022-2032, USD Million
- Recreational Water- Market Insights and Forecast 2022-2032, USD Million
- Others- Market Insights and Forecast 2022-2032, USD Million
- By End User
- Municipal Water Utilities- Market Insights and Forecast 2022-2032, USD Million
- Industrial Facilities- Market Insights and Forecast 2022-2032, USD Million
- Environmental Agencies- Market Insights and Forecast 2022-2032, USD Million
- Commercial Testing Laboratories- Market Insights and Forecast 2022-2032, USD Million
- Research & Academic Institutes- Market Insights and Forecast 2022-2032, USD Million
- Residential & Commercial Users- Market Insights and Forecast 2022-2032, USD Million
- Others- Market Insights and Forecast 2022-2032, USD Million
- By Sales Channel
- Retail Online- Market Insights and Forecast 2022-2032, USD Million
- Company-Owned Websites- Market Insights and Forecast 2022-2032, USD Million
- E-Commerce Platforms- Market Insights and Forecast 2022-2032, USD Million
- Online Laboratory Service Portals- Market Insights and Forecast 2022-2032, USD Million
- B2B Procurement Platforms- Market Insights and Forecast 2022-2032, USD Million
- Retail Offline- Market Insights and Forecast 2022-2032, USD Million
- Direct Sales- Market Insights and Forecast 2022-2032, USD Million
- Distributors/Dealers- Market Insights and Forecast 2022-2032, USD Million
- Specialty Instrument Stores- Market Insights and Forecast 2022-2032, USD Million
- Laboratory Equipment Suppliers- Market Insights and Forecast 2022-2032, USD Million
- Local Authorized Sales Partners- Market Insights and Forecast 2022-2032, USD Million
- Retail Online- Market Insights and Forecast 2022-2032, USD Million
- By Region
- North- Market Insights and Forecast 2022-2032, USD Million
- East- Market Insights and Forecast 2022-2032, USD Million
- Southwest- Market Insights and Forecast 2022-2032, USD Million
- Northwest- Market Insights and Forecast 2022-2032, USD Million
- North East- Market Insights and Forecast 2022-2032, USD Million
- South- Market Insights and Forecast 2022-2032, USD Million
- By Competitors
- Competition Characteristics
- Market Share & Analysis
- By Product Type
- Market Size & Growth Outlook
- China Water Quality Testing Instruments Market Statistics, 2022-2032
- Market Size & Growth Outlook
- By Revenues in USD Million
- Market Segmentation & Growth Outlook
- By Parameter Type- Market Insights and Forecast 2022-2032, USD Million
- By Technology- Market Insights and Forecast 2022-2032, USD Million
- By Water Source- Market Insights and Forecast 2022-2032, USD Million
- By End User- Market Insights and Forecast 2022-2032, USD Million
- By Sales Channel- Market Insights and Forecast 2022-2032, USD Million
- By Region- Market Insights and Forecast 2022-2032, USD Million
- Market Size & Growth Outlook
- China Water Quality Sensors & Probes Market Statistics, 2022-2032
- Market Size & Growth Outlook
- By Revenues in USD Million
- Market Segmentation & Growth Outlook
- By Parameter Type- Market Insights and Forecast 2022-2032, USD Million
- By Technology- Market Insights and Forecast 2022-2032, USD Million
- By Water Source- Market Insights and Forecast 2022-2032, USD Million
- By End User- Market Insights and Forecast 2022-2032, USD Million
- By Sales Channel- Market Insights and Forecast 2022-2032, USD Million
- By Region- Market Insights and Forecast 2022-2032, USD Million
- Market Size & Growth Outlook
- China Test Kits & Reagents Market Statistics, 2022-2032
- Market Size & Growth Outlook
- By Revenues in USD Million
- Market Segmentation & Growth Outlook
- By Parameter Type- Market Insights and Forecast 2022-2032, USD Million
- By Technology- Market Insights and Forecast 2022-2032, USD Million
- By Water Source- Market Insights and Forecast 2022-2032, USD Million
- By End User- Market Insights and Forecast 2022-2032, USD Million
- By Sales Channel- Market Insights and Forecast 2022-2032, USD Million
- By Region- Market Insights and Forecast 2022-2032, USD Million
- Market Size & Growth Outlook
- China Online Water Quality Monitoring Systems Market Statistics, 2022-2032
- Market Size & Growth Outlook
- By Revenues in USD Million
- Market Segmentation & Growth Outlook
- By Parameter Type- Market Insights and Forecast 2022-2032, USD Million
- By Technology- Market Insights and Forecast 2022-2032, USD Million
- By Water Source- Market Insights and Forecast 2022-2032, USD Million
- By End User- Market Insights and Forecast 2022-2032, USD Million
- By Sales Channel- Market Insights and Forecast 2022-2032, USD Million
- By Region- Market Insights and Forecast 2022-2032, USD Million
- Market Size & Growth Outlook
- China Portable Water Testing Devices Market Statistics, 2022-2032
- Market Size & Growth Outlook
- By Revenues in USD Million
- Market Segmentation & Growth Outlook
- By Parameter Type- Market Insights and Forecast 2022-2032, USD Million
- By Technology- Market Insights and Forecast 2022-2032, USD Million
- By Water Source- Market Insights and Forecast 2022-2032, USD Million
- By End User- Market Insights and Forecast 2022-2032, USD Million
- By Sales Channel- Market Insights and Forecast 2022-2032, USD Million
- By Region- Market Insights and Forecast 2022-2032, USD Million
- Market Size & Growth Outlook
- China Software & Data Management Platforms Market Statistics, 2022-2032
- Market Size & Growth Outlook
- By Revenues in USD Million
- Market Segmentation & Growth Outlook
- By Parameter Type- Market Insights and Forecast 2022-2032, USD Million
- By Technology- Market Insights and Forecast 2022-2032, USD Million
- By Water Source- Market Insights and Forecast 2022-2032, USD Million
- By End User- Market Insights and Forecast 2022-2032, USD Million
- By Sales Channel- Market Insights and Forecast 2022-2032, USD Million
- By Region- Market Insights and Forecast 2022-2032, USD Million
- Market Size & Growth Outlook
- Competitive Outlook
- Company Profiles
- Focused Photonics Inc.
- Business Description
- Product Portfolio
- Collaborations & Alliances
- Recent Developments
- Financial Details
- Others
- Lianhua Technology/Shanghai Lianhua
- Business Description
- Product Portfolio
- Collaborations & Alliances
- Recent Developments
- Financial Details
- Others
- Shanghai BOQU Instrument
- Business Description
- Product Portfolio
- Collaborations & Alliances
- Recent Developments
- Financial Details
- Others
- Shanghai Chunye Instrument Technology
- Business Description
- Product Portfolio
- Collaborations & Alliances
- Recent Developments
- Financial Details
- Others
- Sailhero
- Business Description
- Product Portfolio
- Collaborations & Alliances
- Recent Developments
- Financial Details
- Others
- Beijing SDL Technology
- Business Description
- Product Portfolio
- Collaborations & Alliances
- Recent Developments
- Financial Details
- Others
- Hangzhou Zetian/Tranlion
- Business Description
- Product Portfolio
- Collaborations & Alliances
- Recent Developments
- Financial Details
- Others
- Jiangsu Skyray Instrument
- Business Description
- Product Portfolio
- Collaborations & Alliances
- Recent Developments
- Financial Details
- Others
- Hach
- Business Description
- Product Portfolio
- Collaborations & Alliances
- Recent Developments
- Financial Details
- Others
- Xylem Analytics
- Business Description
- Product Portfolio
- Collaborations & Alliances
- Recent Developments
- Financial Details
- Others
- Focused Photonics Inc.
- Company Profiles
- Disclaimer
| Segment | Sub-Segment |
|---|---|
| By Product Type |
|
| By Parameter Type |
|
| By Technology |
|
| By Water Source |
|
| By End User |
|
| By Sales Channel |
|
| By Region |
|
Research Methodology
This study followed a structured approach comprising four key phases to assess the size and scope of the electro-oxidation market. The process began with thorough secondary research to collect data on the target market, related markets, and broader industry context. These findings, along with preliminary assumptions and estimates, were then validated through extensive primary research involving industry experts from across the value chain. To calculate the overall market size, both top-down and bottom-up methodologies were employed. Finally, market segmentation and data triangulation techniques were applied to refine and validate segment-level estimations.
Secondary Research
The secondary research phase involved gathering data from a wide range of credible and published sources. This step helped in identifying industry trends, defining market segmentation, and understanding the market landscape and value chain.
Sources consulted during this phase included:
- Company annual reports, investor presentations, and press releases
- Industry white papers and certified publications
- Trade directories and market-recognized databases
- Articles from authoritative authors and reputable journals
- Gold and silver standard websites
Secondary research was critical in mapping out the industry's value chain and monetary flow, identifying key market segments, understanding regional variations, and tracking significant industry developments.
Other key sources:
- Financial disclosures
- Industry associations and trade bodies
- News outlets and business magazines
- Academic journals and research studies
- Paid industry databases
Primary Research
To validate secondary data and gain deeper market insights, primary research was conducted with key stakeholders across both the supply and demand sides of the market.
On the demand side, participants included decision-makers and influencers from end-user industries—such as CIOs, CTOs, and CSOs—who provided first-hand perspectives on market needs, product usage, and future expectations.
On the supply side, interviews were conducted with manufacturers, industry associations, and institutional participants to gather insights into current offerings, product pipelines, and market challenges.
Primary interviews provided critical inputs such as:
- Market size and revenue data
- Product and service breakdowns
- Market forecasts
- Regional and application-specific trends
Stakeholders consulted included:
- Leading OEM and solution providers
- Channel and distribution partners
- End users across various applications
- Independent consultants and industry specialists
Market Size Estimation and Data Triangulation
- Identifying Key Market Participants (Secondary Research)
- Goal: To identify the major players or companies in the target market. This typically involves using publicly available data sources such as industry reports, market research publications, and financial statements of companies.
- Tools: Reports from firms like Gartner, Forrester, Euromonitor, Statista, IBISWorld, and others. Public financial statements, news articles, and press releases from top market players.
- Extracting Earnings of Key Market Participants
- Goal: To estimate the earnings generated from the product or service being analyzed. This step helps in understanding the revenue potential of each market player in a specific geography.
- Methods: Earnings data can be gathered from:
- Publicly available financial reports (for listed companies).
- Interviews and primary data sources from professionals, such as Directors, VPs, SVPs, etc. This is especially useful for understanding more nuanced, internal data that isn't publicly disclosed.
- Annual reports and investor presentations of key players.
- Data Collation and Development of a Relevant Data Model
- Goal: To collate inputs from both primary and secondary sources into a structured, data-driven model for market estimation. This model will incorporate key market KPIs and any independent variables relevant to the market.
- Key KPIs: These could include:
- Market size, growth rate, and demand drivers.
- Industry-specific metrics like market share, average revenue per customer (ARPC), or average deal size.
- External variables, such as economic growth rates, inflation rates, or commodity prices, that could affect the market.
- Data Modeling: Based on this data, the market forecasts are developed for the next 5 years. A combination of trend analysis, scenario modeling, and statistical regression might be used to generate projections.
- Scenario Analysis
- Goal: To test different assumptions and validate how sensitive the market is to changes in key variables (e.g., market demand, regulatory changes, technological disruptions).
- Types of Scenarios:
- Base Case: Based on current assumptions and historical data.
- Best-Case Scenario: Assuming favorable market conditions, regulatory environments, and technological advancements.
- Worst-Case Scenario: Accounting for adverse factors, such as economic downturns, stricter regulations, or unexpected disruptions.


