Brazil Herbal/Traditional Products Market Report: Trends, Growth and Forecast (2026-2032)
By Category (Topical Analgesics, Sleep Aids, Cough, Cold & Allergy Remedies, Digestive Remedies, Dermatologicals, Paediatric Dietary Supplements, Dietary Supplements, Tonics), By Form (Capsules/Tablets, Powder, Syrups, Oils & Ointments, Others), By Health Benefit (General Wellness, Cardiovascular Health, Cognitive & Mental Health, Digestive & Gut Health, Immunity Support, Respiratory Health, Bone & Joint Health, Others), By Source (Leaves, Roots, Barks, Flowers, Seeds, Others), By Ingredient Type (Single-Herb Products, Multi-Herb Products), By Function (Preventive Care, Curative/Relief Care), By End User (Adults, Geriatric Population, Children), By Prescription Type (Over-the-Counter (OTC), Prescription Herbal Medicines), By Sales Channel (Retail Offline, Retail Online) ... Read more
|
Major Players
|
Brazil Herbal/Traditional Products Market Statistics and Insights, 2026
- Market Size Statistics
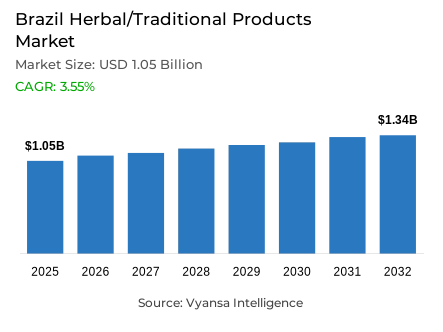
- Herbal/traditional products market size in Brazil was estimated at USD 1.05 billion in 2025.
- The market size is expected to grow to USD 1.34 billion by 2032.
- Market to register a CAGR of around 3.55% during 2026-32.
- Category Shares
- Dietary supplements grabbed market share of 35%.
- Competition
- More than 10 companies are actively engaged in producing herbal/traditional products in Brazil.
- Top 5 companies acquired around 25% of the market share.
- Neo Vida Comércio e Importação de Produtos Naturais SA, Laboratório Catarinense SA, Herbalife International Do Brasil Ltda, Hypera SA, Hiramitsu Farmacêutica do Brasil Ltda etc., are few of the top companies.
- Sales Channel
- Retail offline grabbed 70% of the market.
Brazil Herbal/Traditional Products Market Outlook
The Brazil herbal and traditional products market is in a transformative stage as it tries to reconcile the ancient wisdom of plants with the scientific validation. The market is estimated to be USD 1.05 billion in 2025, and is expected to be USD 1.34 billion in 2032, with a steady CAGR of about 3.55% between 2026 and 2032. This is driven by a massive change in consumer behaviour, in which Brazilians are moving towards using herbal products as long-term wellness and disease prevention, and standard OTC drugs as acute symptom management.
One of the key factors behind this growth is the adoption of modern technology, including AI and dedicated apps like FitoFinder, which inform consumers on how to use native Brazilian biodiversity safely. The emergence of Amazonian adaptogens and nootropics such as guaraná as an energy source and muirapuama as a mental stimulant has turned traditional ingredients into sought-after functional supplements. Moreover, with the significant government support in the form of the Unified Health System (SUS) that will see a fivefold increase in investments in 2024, these treatments will be available in all Brazilian cities by 2027.
Although Brazil is a country with immense biodiversity, it now contributes less than 2% of the world herbal sales, which highlights a huge potential. The regulatory environment is also becoming stricter, with Anvisa beginning significant changes in late 2024 to harmonise registration and restrict pesticide residues. The reforms are meant to address the credibility problems that have plagued the industry since time immemorial by minimizing the availability of illegal, unregistered products and making sure that natural also means scientifically proven and safe.
sales channel is still deeply entrenched in physical retail, with offline retail taking 70% of the market. The main reliable sources of these products remain pharmacies and specialised health stores. Nevertheless, with brand consolidation taking over the existing disjointed market of small local players, and with the increasing confidence in standardised herbal supplements, Brazil will be ranked 13th largest consumer of herbal and traditional products by 2032.

Brazil Herbal/Traditional Products Market Growth Driver
SUS Funding and Municipal Rollout Institutionalising Phytotherapeutics and Expanding Access
Public-policy support will be a key growth engine in 2026, with herbal and phytotherapeutic alternatives institutionalised via the Unified Health System (SUS) in Brazil. According to the Ministry of Health, it has already allocated over R$ 30 million in one instalment to 1,304 municipalities to undertake measures related to medicinal plants and phytotherapeutics, thus directly increasing access to these services as part of regular primary-care and pharmacy services. This is a huge investment that highlights the interest of the government in the integration of traditional medicine into mainstream healthcare delivery systems.
This is not a symbolic funding, municipalities have the resources to fund the cultivation, acquisition, and processing of phytotherapeutics, to offer professional training, and to seek research collaborations, and thus help shift the use of phytotherapeutics out of the niche of prevention and into the mainstream of care delivery. A 2025 Ministerial Ordinance (GM/MS n 6.837/2025) also provides per-capita transfer bands of R$ 0.20 to R$ 1.00, indexed to the level of municipal development (IDHM), supporting a systematic, nationwide implementation. Government subsidies provide long-term infrastructure to integrate herbal medicine into state healthcare, thus providing legitimacy and access that facilitates long-term category growth by institutionalizing it, training professionals, and distributing it through systematic networks to underserved populations.
Brazil Herbal/Traditional Products Market Challenge
Pesticide Residue and Quality Variability Risks Undermining Trust and Slowing Mainstream Adoption
Credibility is the main market tension in 2026 consumers are exposed to a plethora of herbal products, but the uncertainty of the quality of the product, especially the presence of pesticides, keeps the trust in a precarious position. The Brazilian regulator Anvisa highlights the sensitivity of this issue in its PARA report of the 2024 cycle (published December 2025), it identifies that 20.6% of the tested food samples of plant origin are non-conforming, with three containing pesticides banned in Brazil and 13 containing unregistered pesticides. These contamination results pose a big threat to consumer confidence.
In the case of unequal trust, buyers revert to conventional over-the-counter medicines to relieve symptoms quickly, thus supporting the perception of preventative-only. In the case of legitimate brands, this dynamic turns compliance into a competitive requirement traceable sourcing, batch-level quality records, and residue-ready raw-material control become necessary simply to maintain minimum consumer confidence. Quality issues create structural obstacles to mainstream adoption, forcing manufacturers to spend a lot of money on quality assurance, supply-chain transparency, and contamination testing. The issue of credibility makes quality control and regulatory compliance the main competitive differentiators instead of the auxiliary operational needs in the Brazilian market of herbal products.
Unlock Market Intelligence
Explore the market potential with our data-driven report
Brazil Herbal/Traditional Products Market Trend
Tech-Led Consumer Education Translating Traditional Remedies into Evidence-Led Everyday Use
The most apparent structural change in 2026 is the way technology can transform traditional knowledge into more usable and safer guidance. Applications and artificial intelligence systems explain herbal properties, dosages, contraindications, and side-effects, thus allowing consumers to make more informed choices and aiding a scientifically-proven positioning that transcends traditional word-of-mouth delivery. Digital education tools democratise access to credible information on herbal medicine, closing the gaps between traditional knowledge and evidence-based use recommendations.
This pattern is supported by the connectivity footprint of Brazil. According to government reporting, based on Anatel data, there are 270.2 million mobile telephony accesses in 2025, of which optical fibre covers about 79% of fixed broadband connections; fixed broadband has 53.9 million accesses as of December 2025. Through this reach, trust-building is becoming more and more dependent on digital touchpoints, education, instructions, and evidence summaries, and not just in-store advice. Technology-based education is a paradigm shift in the transmission of herbal knowledge, which is experiential and anecdotal, to scientifically based, digitally available information to aid informed consumer decision-making. This creates a space of brands investing in educational content, app-based guidance systems, and evidence-based communication strategies that are in line with the highly connected consumer base in Brazil.
Brazil Herbal/Traditional Products Market Opportunity
Modernised Anvisa Framework Unlocking Compliant Innovation and Native Botanical Development
The most obvious opportunity is the regulatory reset itself, which in 2026 will make it easier to comply with innovation and increase safety-and-quality requirements. After several public consultations and a public hearing in February 2025, Anvisa adopted a new framework in December 2025 that simplifies registration and notification procedures and revises technical pathways, such as special rules on pesticide-residue assessment of phytotherapeutics. This regulatory modernization establishes a positive environment of innovation without compromising on safety standards.
Anvisa also reports that Brazil has some 350 herbal medicines regularised under its supervision and estimates that only 15% of Brazilian plant species have been investigated as medicines- a knowledge gap that can be filled by rigorous research and development and standardised extracts. To companies, this is a viable chance to create research-based products using native botanicals and to establish long-term trust through transparent dossiers in accordance with updated regulations. The new regulatory framework facilitates growth based on innovation by facilitating easy approval procedures, quality standards, and large untapped botanical resources. Manufacturers with research potential, regulatory compliance preparedness and native species knowledge are well placed to take advantage of the Brazilian biodiversity advantage in a modernised regulatory framework that favours evidence-based development of herbal medicine.
Unlock Market Intelligence
Explore the market potential with our data-driven report
Brazil Herbal/Traditional Products Market Segmentation Analysis
By Category
- Topical Analgesics
- Sleep Aids
- Cough, Cold & Allergy Remedies
- Digestive Remedies
- Dermatologicals
- Paediatric Dietary Supplements
- Dietary Supplements
- Tonics
The segment has the highest share around the category in the Brazil herbal/traditional products market, where Dietary Supplements grabbed a market share of 35%. This dominance is largely due to the "preventative wellness" trend, where consumers proactively use herbal formulations to manage stress, boost immunity, and support metabolic health. Brands are increasingly launching premium functional blends, such as hibiscus and ginger for detox or lemongrass for sleep, effectively moving herbal teas and supplements into the mainstream lifestyle category.
Traditional knowledge is being repurposed for the modern market, with a focus on scientifically backed ingredients like silymarin for fat breakdown and camu camu for vitamin C. Because dietary supplements are perceived as safer, long-term alternatives to synthetic drugs, they have become the go-to choice for Brazilians looking to complement their healthy routines. This segment is expected to remain the primary value driver as the industry shifts toward evidence-based natural solutions.

By Sales Channel
- Retail Offline
- Retail Online
The segment has the highest share around the Sales Channel is Retail Offline, which grabbed 70% of the market. In Brazil, the "trust factor" is critical for herbal products, leading consumers to prefer purchasing from physical pharmacies and health stores where they can receive guidance from pharmacists. This offline dominance is also supported by the government’s SUS (Unified Health System) initiatives, which distribute medicinal plants and herbal medicines through physical healthcare centers across the country.
While offline retail remains the giant, it is increasingly being supported by digital tools. Consumers often use apps to research dosages and side effects before making an in-store purchase. As Anvisa tightens regulations to remove unregulated products from shelves, the role of established offline retailers as "gatekeepers" of quality and safety will only strengthen. This 70% market share highlights the continued importance of tactile shopping and professional consultation in the Brazilian health and wellness journey.
List of Companies Covered in Brazil Herbal/Traditional Products Market
The companies listed below are highly influential in the Brazil herbal/traditional products market, with a significant market share and a strong impact on industry developments.
- Neo Vida Comércio e Importação de Produtos Naturais SA
- Laboratório Catarinense SA
- Herbalife International Do Brasil Ltda
- Hypera SA
- Hiramitsu Farmacêutica do Brasil Ltda
- Laboratório Canonne Ltda
- Procter & Gamble do Brasil SA
- Takeda Pharma Ltda
- Natulab Laboratório SA
- Marjan Indústria e Comércio Ltda
Competitive Landscape
Brazil herbal and traditional products market is fragmented yet expanding, driven by demand for preventive wellness and native ingredients. Growth is led by herbal dietary supplements and functional teas incorporating Amazonian adaptogens such as guaraná and muirapuama, while standard OTC medicines remain strong competitors for acute symptom relief. Emerging innovators such as NAtiva differentiate through scientifically validated phytotherapeutics, blending traditional knowledge with modern R&D, while digital tools like the FitoFinder app enhance consumer education and trust. Larger established OTC players indirectly compete by reinforcing efficacy perceptions. Regulatory tightening by Anvisa is expected to favour compliant, quality focused brands over informal operators. Key opportunities lie in brand consolidation, standardisation, premium organic lines, and government backed expansion through SUS to strengthen credibility and scale.
Frequently Asked Questions
Related Report
1. Market Segmentation
1.1. Research Scope
1.2. Research Methodology
1.3. Definitions and Assumptions
2. Executive Summary
3. Brazil Herbal/Traditional Products Market Policies, Regulations, and Standards
4. Brazil Herbal/Traditional Products Market Dynamics
4.1. Growth Factors
4.2. Challenges
4.3. Trends
4.4. Opportunities
5. Brazil Herbal/Traditional Products Market Statistics, 2022-2032F
5.1. Market Size & Growth Outlook
5.1.1.By Revenues in USD Million
5.2. Market Segmentation & Growth Outlook
5.2.1.By Category
5.2.1.1. Topical Analgesics- Market Insights and Forecast 2022-2032, USD Million
5.2.1.2. Sleep Aids- Market Insights and Forecast 2022-2032, USD Million
5.2.1.3. Cough, Cold & Allergy Remedies- Market Insights and Forecast 2022-2032, USD Million
5.2.1.4. Digestive Remedies- Market Insights and Forecast 2022-2032, USD Million
5.2.1.5. Dermatologicals- Market Insights and Forecast 2022-2032, USD Million
5.2.1.6. Paediatric Dietary Supplements- Market Insights and Forecast 2022-2032, USD Million
5.2.1.7. Dietary Supplements- Market Insights and Forecast 2022-2032, USD Million
5.2.1.8. Tonics- Market Insights and Forecast 2022-2032, USD Million
5.2.2.By Form
5.2.2.1. Capsules/Tablets- Market Insights and Forecast 2022-2032, USD Million
5.2.2.2. Powder- Market Insights and Forecast 2022-2032, USD Million
5.2.2.3. Syrups- Market Insights and Forecast 2022-2032, USD Million
5.2.2.4. Oils & Ointments- Market Insights and Forecast 2022-2032, USD Million
5.2.2.5. Others- Market Insights and Forecast 2022-2032, USD Million
5.2.3.By Health Benefit
5.2.3.1. General Wellness- Market Insights and Forecast 2022-2032, USD Million
5.2.3.2. Cardiovascular Health- Market Insights and Forecast 2022-2032, USD Million
5.2.3.3. Cognitive & Mental Health- Market Insights and Forecast 2022-2032, USD Million
5.2.3.4. Digestive & Gut Health- Market Insights and Forecast 2022-2032, USD Million
5.2.3.5. Immunity Support- Market Insights and Forecast 2022-2032, USD Million
5.2.3.6. Respiratory Health- Market Insights and Forecast 2022-2032, USD Million
5.2.3.7. Bone & Joint Health- Market Insights and Forecast 2022-2032, USD Million
5.2.3.8. Others- Market Insights and Forecast 2022-2032, USD Million
5.2.4.By Source
5.2.4.1. Leaves- Market Insights and Forecast 2022-2032, USD Million
5.2.4.2. Roots- Market Insights and Forecast 2022-2032, USD Million
5.2.4.3. Barks- Market Insights and Forecast 2022-2032, USD Million
5.2.4.4. Flowers- Market Insights and Forecast 2022-2032, USD Million
5.2.4.5. Seeds- Market Insights and Forecast 2022-2032, USD Million
5.2.4.6. Others- Market Insights and Forecast 2022-2032, USD Million
5.2.5.By Ingredient Type
5.2.5.1. Single-Herb Products- Market Insights and Forecast 2022-2032, USD Million
5.2.5.2. Multi-Herb Products- Market Insights and Forecast 2022-2032, USD Million
5.2.6.By Function
5.2.6.1. Preventive Care- Market Insights and Forecast 2022-2032, USD Million
5.2.6.2. Curative/Relief Care- Market Insights and Forecast 2022-2032, USD Million
5.2.7.By End User
5.2.7.1. Adults- Market Insights and Forecast 2022-2032, USD Million
5.2.7.2. Geriatric Population- Market Insights and Forecast 2022-2032, USD Million
5.2.7.3. Children- Market Insights and Forecast 2022-2032, USD Million
5.2.8.By Prescription Type
5.2.8.1. Over-the-Counter (OTC)- Market Insights and Forecast 2022-2032, USD Million
5.2.8.2. Prescription Herbal Medicines- Market Insights and Forecast 2022-2032, USD Million
5.2.9.By Sales Channel
5.2.9.1. Retail Offline- Market Insights and Forecast 2022-2032, USD Million
5.2.9.2. Retail Online- Market Insights and Forecast 2022-2032, USD Million
5.2.10. By Competitors
5.2.10.1. Competition Characteristics
5.2.10.2. Market Share & Analysis
6. Brazil Topical Analgesics Herbal/Traditional Products Market Statistics, 2022-2032
6.1. Market Size & Growth Outlook
6.1.1.By Revenues in USD Million
6.2. Market Segmentation & Growth Outlook
6.2.1.By Form- Market Insights and Forecast 2022-2032, USD Million
6.2.2.By Health Benefit - Market Insights and Forecast 2022-2032, USD Million
6.2.3.By Source- Market Insights and Forecast 2022-2032, USD Million
6.2.4.By Ingredient Type- Market Insights and Forecast 2022-2032, USD Million
6.2.5.By Function- Market Insights and Forecast 2022-2032, USD Million
6.2.6.By End User- Market Insights and Forecast 2022-2032, USD Million
6.2.7.By Prescription Type- Market Insights and Forecast 2022-2032, USD Million
6.2.8.By Sales Channel- Market Insights and Forecast 2022-2032, USD Million
7. Brazil Sleep Aids Herbal/Traditional Products Market Statistics, 2022-2032
7.1. Market Size & Growth Outlook
7.1.1.By Revenues in USD Million
7.2. Market Segmentation & Growth Outlook
7.2.1.By Form- Market Insights and Forecast 2022-2032, USD Million
7.2.2.By Health Benefit - Market Insights and Forecast 2022-2032, USD Million
7.2.3.By Source- Market Insights and Forecast 2022-2032, USD Million
7.2.4.By Ingredient Type- Market Insights and Forecast 2022-2032, USD Million
7.2.5.By Function- Market Insights and Forecast 2022-2032, USD Million
7.2.6.By End User- Market Insights and Forecast 2022-2032, USD Million
7.2.7.By Prescription Type- Market Insights and Forecast 2022-2032, USD Million
7.2.8.By Sales Channel- Market Insights and Forecast 2022-2032, USD Million
8. Brazil Cough, Cold & Allergy Remedies Herbal/Traditional Products Market Statistics, 2022-2032
8.1. Market Size & Growth Outlook
8.1.1.By Revenues in USD Million
8.2. Market Segmentation & Growth Outlook
8.2.1.By Form- Market Insights and Forecast 2022-2032, USD Million
8.2.2.By Health Benefit - Market Insights and Forecast 2022-2032, USD Million
8.2.3.By Source- Market Insights and Forecast 2022-2032, USD Million
8.2.4.By Ingredient Type- Market Insights and Forecast 2022-2032, USD Million
8.2.5.By Function- Market Insights and Forecast 2022-2032, USD Million
8.2.6.By End User- Market Insights and Forecast 2022-2032, USD Million
8.2.7.By Prescription Type- Market Insights and Forecast 2022-2032, USD Million
8.2.8.By Sales Channel- Market Insights and Forecast 2022-2032, USD Million
9. Brazil Digestive Remedies Herbal/Traditional Products Market Statistics, 2022-2032
9.1. Market Size & Growth Outlook
9.1.1.By Revenues in USD Million
9.2. Market Segmentation & Growth Outlook
9.2.1.By Form- Market Insights and Forecast 2022-2032, USD Million
9.2.2.By Health Benefit - Market Insights and Forecast 2022-2032, USD Million
9.2.3.By Source- Market Insights and Forecast 2022-2032, USD Million
9.2.4.By Ingredient Type- Market Insights and Forecast 2022-2032, USD Million
9.2.5.By Function- Market Insights and Forecast 2022-2032, USD Million
9.2.6.By End User- Market Insights and Forecast 2022-2032, USD Million
9.2.7.By Prescription Type- Market Insights and Forecast 2022-2032, USD Million
9.2.8.By Sales Channel- Market Insights and Forecast 2022-2032, USD Million
10. Brazil Dermatologicals Herbal/Traditional Products Market Statistics, 2022-2032
10.1. Market Size & Growth Outlook
10.1.1. By Revenues in USD Million
10.2. Market Segmentation & Growth Outlook
10.2.1. By Form- Market Insights and Forecast 2022-2032, USD Million
10.2.2. By Health Benefit - Market Insights and Forecast 2022-2032, USD Million
10.2.3. By Source- Market Insights and Forecast 2022-2032, USD Million
10.2.4. By Ingredient Type- Market Insights and Forecast 2022-2032, USD Million
10.2.5. By Function- Market Insights and Forecast 2022-2032, USD Million
10.2.6. By End User- Market Insights and Forecast 2022-2032, USD Million
10.2.7. By Prescription Type- Market Insights and Forecast 2022-2032, USD Million
10.2.8. By Sales Channel- Market Insights and Forecast 2022-2032, USD Million
11. Brazil Paediatric Dietary Supplements Herbal/Traditional Products Market Statistics, 2022-2032
11.1. Market Size & Growth Outlook
11.1.1. By Revenues in USD Million
11.2. Market Segmentation & Growth Outlook
11.2.1. By Form- Market Insights and Forecast 2022-2032, USD Million
11.2.2. By Health Benefit - Market Insights and Forecast 2022-2032, USD Million
11.2.3. By Source- Market Insights and Forecast 2022-2032, USD Million
11.2.4. By Ingredient Type- Market Insights and Forecast 2022-2032, USD Million
11.2.5. By Function- Market Insights and Forecast 2022-2032, USD Million
11.2.6. By End User- Market Insights and Forecast 2022-2032, USD Million
11.2.7. By Prescription Type- Market Insights and Forecast 2022-2032, USD Million
11.2.8. By Sales Channel- Market Insights and Forecast 2022-2032, USD Million
12. Brazil Dietary Supplements Herbal/Traditional Products Market Statistics, 2022-2032
12.1. Market Size & Growth Outlook
12.1.1. By Revenues in USD Million
12.2. Market Segmentation & Growth Outlook
12.2.1. By Form- Market Insights and Forecast 2022-2032, USD Million
12.2.2. By Health Benefit - Market Insights and Forecast 2022-2032, USD Million
12.2.3. By Source- Market Insights and Forecast 2022-2032, USD Million
12.2.4. By Ingredient Type- Market Insights and Forecast 2022-2032, USD Million
12.2.5. By Function- Market Insights and Forecast 2022-2032, USD Million
12.2.6. By End User- Market Insights and Forecast 2022-2032, USD Million
12.2.7. By Prescription Type- Market Insights and Forecast 2022-2032, USD Million
12.2.8. By Sales Channel- Market Insights and Forecast 2022-2032, USD Million
13. Brazil Tonics Herbal/Traditional Products Market Statistics, 2022-2032
13.1. Market Size & Growth Outlook
13.1.1. By Revenues in USD Million
13.2. Market Segmentation & Growth Outlook
13.2.1. By Form- Market Insights and Forecast 2022-2032, USD Million
13.2.2. By Health Benefit - Market Insights and Forecast 2022-2032, USD Million
13.2.3. By Source- Market Insights and Forecast 2022-2032, USD Million
13.2.4. By Ingredient Type- Market Insights and Forecast 2022-2032, USD Million
13.2.5. By Function- Market Insights and Forecast 2022-2032, USD Million
13.2.6. By End User- Market Insights and Forecast 2022-2032, USD Million
13.2.7. By Prescription Type- Market Insights and Forecast 2022-2032, USD Million
13.2.8. By Sales Channel- Market Insights and Forecast 2022-2032, USD Million
14. Competitive Outlook
14.1. Company Profiles
14.1.1. Hypera SA
14.1.1.1. Business Description
14.1.1.2. Product Portfolio
14.1.1.3. Collaborations & Alliances
14.1.1.4. Recent Developments
14.1.1.5. Financial Details
14.1.1.6. Others
14.1.2. Hiramitsu Farmacêutica do Brasil Ltda
14.1.2.1. Business Description
14.1.2.2. Product Portfolio
14.1.2.3. Collaborations & Alliances
14.1.2.4. Recent Developments
14.1.2.5. Financial Details
14.1.2.6. Others
14.1.3. Laboratório Canonne Ltda
14.1.3.1. Business Description
14.1.3.2. Product Portfolio
14.1.3.3. Collaborations & Alliances
14.1.3.4. Recent Developments
14.1.3.5. Financial Details
14.1.3.6. Others
14.1.4. Procter & Gamble do Brasil SA
14.1.4.1. Business Description
14.1.4.2. Product Portfolio
14.1.4.3. Collaborations & Alliances
14.1.4.4. Recent Developments
14.1.4.5. Financial Details
14.1.4.6. Others
14.1.5. Takeda Pharma Ltda
14.1.5.1. Business Description
14.1.5.2. Product Portfolio
14.1.5.3. Collaborations & Alliances
14.1.5.4. Recent Developments
14.1.5.5. Financial Details
14.1.5.6. Others
14.1.6. Neo Vida Comércio e Importação de Produtos Naturais SA
14.1.6.1. Business Description
14.1.6.2. Product Portfolio
14.1.6.3. Collaborations & Alliances
14.1.6.4. Recent Developments
14.1.6.5. Financial Details
14.1.6.6. Others
14.1.7. Catarinense SA, Laboratório
14.1.7.1. Business Description
14.1.7.2. Product Portfolio
14.1.7.3. Collaborations & Alliances
14.1.7.4. Recent Developments
14.1.7.5. Financial Details
14.1.7.6. Others
14.1.8. Herbalife International Do Brasil Ltda
14.1.8.1. Business Description
14.1.8.2. Product Portfolio
14.1.8.3. Collaborations & Alliances
14.1.8.4. Recent Developments
14.1.8.5. Financial Details
14.1.8.6. Others
14.1.9. Natulab Laboratório SA
14.1.9.1. Business Description
14.1.9.2. Product Portfolio
14.1.9.3. Collaborations & Alliances
14.1.9.4. Recent Developments
14.1.9.5. Financial Details
14.1.9.6. Others
14.1.10. Marjan Indústria e Comércio Ltda
14.1.10.1.Business Description
14.1.10.2.Product Portfolio
14.1.10.3.Collaborations & Alliances
14.1.10.4.Recent Developments
14.1.10.5.Financial Details
14.1.10.6.Others
15. Disclaimer
| Segment | Sub-Segment |
|---|---|
| By Category |
|
| By Form |
|
| By Health Benefit |
|
| By Source |
|
| By Ingredient Type |
|
| By Function |
|
| By End User |
|
| By Prescription Type |
|
| By Sales Channel |
|
Research Methodology
This study followed a structured approach comprising four key phases to assess the size and scope of the electro-oxidation market. The process began with thorough secondary research to collect data on the target market, related markets, and broader industry context. These findings, along with preliminary assumptions and estimates, were then validated through extensive primary research involving industry experts from across the value chain. To calculate the overall market size, both top-down and bottom-up methodologies were employed. Finally, market segmentation and data triangulation techniques were applied to refine and validate segment-level estimations.
Secondary Research
The secondary research phase involved gathering data from a wide range of credible and published sources. This step helped in identifying industry trends, defining market segmentation, and understanding the market landscape and value chain.
Sources consulted during this phase included:
- Company annual reports, investor presentations, and press releases
- Industry white papers and certified publications
- Trade directories and market-recognized databases
- Articles from authoritative authors and reputable journals
- Gold and silver standard websites
Secondary research was critical in mapping out the industry's value chain and monetary flow, identifying key market segments, understanding regional variations, and tracking significant industry developments.
Other key sources:
- Financial disclosures
- Industry associations and trade bodies
- News outlets and business magazines
- Academic journals and research studies
- Paid industry databases
Primary Research
To validate secondary data and gain deeper market insights, primary research was conducted with key stakeholders across both the supply and demand sides of the market.
On the demand side, participants included decision-makers and influencers from end-user industries—such as CIOs, CTOs, and CSOs—who provided first-hand perspectives on market needs, product usage, and future expectations.
On the supply side, interviews were conducted with manufacturers, industry associations, and institutional participants to gather insights into current offerings, product pipelines, and market challenges.
Primary interviews provided critical inputs such as:
- Market size and revenue data
- Product and service breakdowns
- Market forecasts
- Regional and application-specific trends
Stakeholders consulted included:
- Leading OEM and solution providers
- Channel and distribution partners
- End users across various applications
- Independent consultants and industry specialists
Market Size Estimation and Data Triangulation
- Identifying Key Market Participants (Secondary Research)
- Goal: To identify the major players or companies in the target market. This typically involves using publicly available data sources such as industry reports, market research publications, and financial statements of companies.
- Tools: Reports from firms like Gartner, Forrester, Euromonitor, Statista, IBISWorld, and others. Public financial statements, news articles, and press releases from top market players.
- Extracting Earnings of Key Market Participants
- Goal: To estimate the earnings generated from the product or service being analyzed. This step helps in understanding the revenue potential of each market player in a specific geography.
- Methods: Earnings data can be gathered from:
- Publicly available financial reports (for listed companies).
- Interviews and primary data sources from professionals, such as Directors, VPs, SVPs, etc. This is especially useful for understanding more nuanced, internal data that isn't publicly disclosed.
- Annual reports and investor presentations of key players.
- Data Collation and Development of a Relevant Data Model
- Goal: To collate inputs from both primary and secondary sources into a structured, data-driven model for market estimation. This model will incorporate key market KPIs and any independent variables relevant to the market.
- Key KPIs: These could include:
- Market size, growth rate, and demand drivers.
- Industry-specific metrics like market share, average revenue per customer (ARPC), or average deal size.
- External variables, such as economic growth rates, inflation rates, or commodity prices, that could affect the market.
- Data Modeling: Based on this data, the market forecasts are developed for the next 5 years. A combination of trend analysis, scenario modeling, and statistical regression might be used to generate projections.
- Scenario Analysis
- Goal: To test different assumptions and validate how sensitive the market is to changes in key variables (e.g., market demand, regulatory changes, technological disruptions).
- Types of Scenarios:
- Base Case: Based on current assumptions and historical data.
- Best-Case Scenario: Assuming favorable market conditions, regulatory environments, and technological advancements.
- Worst-Case Scenario: Accounting for adverse factors, such as economic downturns, stricter regulations, or unexpected disruptions.


