Brazil Contact Lenses and Solutions Market Report: Trends, Growth and Forecast (2026-2032)
By Product Type (Contact Lenses (Standard Vision Correction Lenses, Myopia Control Lenses), Contact Lens Solutions), By Usage (Contact Lenses (Daily Disposable, Bi-Weekly, Monthly, Quarterly/Annual), Contact Lens Solutions (Daily-Use Care Solutions, Weekly/Periodic Deep-Clean Systems, Travel/Mini Packs)), By Material Type (Contact Lenses (Silicone Hydrogel, Hydrogel (Soft), Rigid Gas Permeable (RGP), Hybrid/Scleral/Specialty), Contact Lens Solutions (Multi-Purpose Solutions, Hydrogen Peroxide Systems, Saline Solutions, Enzymatic & Specialty Cleaners)), By Application (Contact Lenses (Spherical (Myopia/Hyperopia), Toric (Astigmatism), Multifocal (Presbyopia), Myopia Control, Cosmetic/Colored, Therapeutic/Medical), Contact Lens Solutions (Soft Lens Care, RGP Lens Care, Sensitive Eye/Preservative-Free Care)), By Sales Channel (Retail Offline (Optical Stores, Hospitals & Clinics, Others (Pharmacies, Beauty Centres, etc.)), Retail Online (Company-owned Portals, E-commerce Platforms)), By Pack Size (Contact Lenses (Trial Packs, Standard Packs, Bulk/Value Packs), Contact Lens Solutions (Up to 120 mL, 121–360 mL, Above 360 mL, Combo/Twin Packs)), By Region (North, Center-West, Northeast, Southeast, South) ... Read more
|
Major Players
|
Brazil Contact Lenses and Solutions Market Statistics and Insights, 2026
- Market Size Statistics
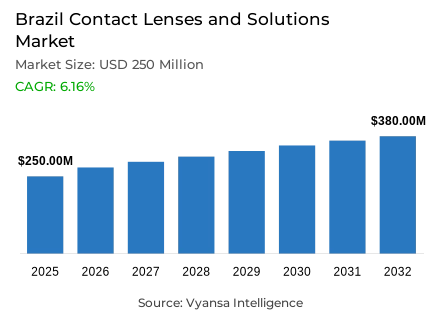
- Contact lenses and solutions market size in Brazil was estimated at USD 250 million in 2025.
- The market size is expected to grow to USD 380 million by 2032.
- Market to register a CAGR of around 6.16% during 2026-32.
- Product Type Shares
- Contact lenses grabbed market share of 85%.
- Competition
- More than 5 companies are actively engaged in producing contact lenses and solutions in Brazil.
- Top 5 companies acquired around 80% of the market share.
- Alcon Laboratorios do Brasil Ltda, Solotica Industria e Comercio Ltda, Bausch & Lomb do Brasil Ltda, Johnson & Johnson do Brasil Industria e Comercio de Produtos para Saude Ltda, CooperVision do Brasil Ltda etc., are few of the top companies.
- Sales Channel
- Retail offline grabbed 90% of the market.
Brazil Contact Lenses and Solutions Market Outlook
Brazil Contact Lenses and Solutions Market was estimated to have a value of $250 million in 2025 and is projected to have a value of $380 million in 2032, which will be a CAGR of about 6.16% in 2026-2032. The expansion of digital lifestyles is a major contributor to growth. The World Health Organization states that 2.2 billion people in the world have vision impairment, and a significant percentage of them is related to uncorrected refractive errors. The increasing dependence on electronic devices in the workplace, educational institutions, and day-to-day activities continues to strain vision health, thus establishing the need for correcting the problem through the use of corrective lenses.
However, this affordability acts as a determinant. According to the World Bank, there is a continued impact on the purchasing power of end users in the emerging economies due to increasing inflationary pressures, which limits the willingness of end users to adopt the lenses.
One of the major trends that would affect the market in 2026 is the digitalization of eye care services. The World Health Organization states that the growing role of digital health tools is significant in helping improve access to early detection and preventive care. The International Telecommunication Union has also confirmed that the development of infrastructure is contributing significantly to the adoption of telehealth. These technologies are helping improve early detection of refractive errors.There is a strong future prospect in childhood vision care. According to UNICEF, school-based health programmes increase access to early diagnosis and treatment. Long-term adoption of corrective solutions among younger populations can be encouraged by the growth of awareness and screening programs.
Contact lenses dominate the market share by 85% by segmentation, which is a testimony to their centrality in correcting vision. Regarding distribution, retail offline channels occupy 90% of the market, which is justified by the need to consult a professional and verify the prescription.

Brazil Contact Lenses and Solutions Market Growth Driver
Rising Digital Lifestyle Increasing Vision Correction Needs
The increasing screen time is fueling the demand of vision-correction solutions in Brazil. According to the World Health Organization, vision impairment affects at least 2.2 billion people in the world, with a significant proportion of them being associated with uncorrected refractive errors.
The ongoing trend of working, studying, and living with the help of digital devices still poses a threat to the visual health and supports the need of corrective measures like contact lenses. Also, the increased involvement in sports and active lifestyles is strengthening the functional value of contact lenses. The International Sports Vision Association emphasizes that contact lenses may enhance peripheral vision compared to spectacles, thus aiding performance and coordination. This practical benefit repositions contact lenses as a lifestyle product and not just a medical need.
Brazil Contact Lenses and Solutions Market Challenge
Cost Sensitivity Limiting Advanced Lens Adoption
The economic pressures, however, remain one of the most important challenges in the adoption of the premium options. As postulated by the World Bank, the inflationary pressures are still negatively impacting household purchasing power in emerging markets, and this affects health spending. It is this environment that continues to dissuade the end users from venturing to adopt more expensive advanced contact lens options.
Furthermore, specialized products such as therapeutic myopia control lenses will require medical intervention and frequent check-ups, which will pose an additional constraint. According to the Pan American Health Organization, the provision of vision care has been inconsistent, which has been an additional barrier for the use of remedies for those with an issue. Such loopholes are hindering the penetration of better remedies.
Unlock Market Intelligence
Explore the market potential with our data-driven report
Brazil Contact Lenses and Solutions Market Trend
AI-Enabled Vision Screening Gaining Momentum
The way forward for vision care in Brazil is being shaped by the digital revolution. This is according to the World Health Organization. The report emphasizes how the relevance of digital health is growing with the aim of improving early detection and prevention. This is leading to a decline in the gap in the availability of specialists.
These technologies help in the faster identification of refractive errors and manage the patients accordingly. On its part, the International Telecommunication Union highlights that emerging markets digital infrastructure development is accelerating the availability of telehealth solutions. Increased awareness and access are seeing digital tools emerge as a major supporting system in delivering vision care.
Brazil Contact Lenses and Solutions Market Opportunity
Early Intervention for Childhood Myopia
Long-term, pediatric eye care presents a huge growth opportunity. According to the World Health Organization, uncorrected refractive errors are one of the most common causes of visual impairment in children across the world. Early intervention and diagnosis help in evading progression and enhancing visual outcomes throughout the lifetime.
UNICEF adds that school-based health programmes improve access to early diagnosis and treatment of children. With an increase in awareness campaigns, along with screenings, corrective solution uptake is expected to rise, particularly in younger populations, which are still underrepresented in the use of lenses.
Unlock Market Intelligence
Explore the market potential with our data-driven report
Brazil Contact Lenses and Solutions Market Segmentation Analysis
By Product Type
- Contact Lenses
- Standard Vision Correction Lenses
- Myopia Control Lenses
- Contact Lens Solutions
The segment has the highest share around segment under the product type is contact lenses, accounting for 85% market share. Contact lenses dominate due to their direct role in correcting refractive errors and supporting daily visual comfort. Their increasing positioning as lifestyle-enhancing products strengthens consistent usage across demographics. The shift toward convenience-focused formats further supports this leadership.
Besides, improvements in lens materials and designs are raising the bar on their oxygen permeability characteristics and capability to retain moisture, thereby enhancing the comfort of long-wear lenses. Even the increased adoption rate of daily disposable lens wear and silicone hydrogel contact lenses will continue to fuel the satisfaction of consumers, thereby extending their usage lifecycle. Moreover, the fact that consumers are looking at options that provide more functionality accompanied by ease of use, especially in the midst of increasingly busy lives, will continue to fuel the preference for the use of contact lenses in lifestyle-driven applications, thereby sustaining their dominant position in the market segment of the product type under consideration.

By Sales Channel
- Retail Offline
- Optical Stores
- Hospitals & Clinics
- Others (Pharmacies, Beauty Centres, etc.)
- Retail Online
- Company-owned Portals
- E-commerce Platforms
The segment has the highest share around segment under the sales channel is retail offline, accounting for 90% of the market. Optical stores and clinics remain essential as they provide professional consultation and prescription verification. Trust in physical retail and medical supervision continues to support offline purchasing behavior, reinforcing its dominant role in product accessibility and adoption.
Moreover, customers are more comfortable receiving in-person guidance when selecting contact lenses. It is worth noting that immediate product availability and support from these channels increase consumer confidence in the long term. In addition, eye tests carried out at these clinics enhance consumption through these channels. In some instances, some contact lenses, like orthokeratology and myopia-related lenses, require professional supervision. This adds to the high degree of confidence in the retail offline, thus enabling it to maintain its leadership in this segment.
List of Companies Covered in Brazil Contact Lenses and Solutions Market
The companies listed below are highly influential in the Brazil contact lenses and solutions market, with a significant market share and a strong impact on industry developments.
- Alcon Laboratorios do Brasil Ltda
- Solotica Industria e Comercio Ltda
- Bausch & Lomb do Brasil Ltda
- Johnson & Johnson do Brasil Industria e Comercio de Produtos para Saude Ltda
- CooperVision do Brasil Ltda
Competitive Landscape
The competitive landscape in Brazil remains concentrated, with innovation and brand positioning shaping leadership. Johnson & Johnson do Brasil Industria e Comercio de Produtos para Saude Ltda leads the market with a 39% share, supported by the strong performance of its Acuvue portfolio, particularly in daily disposable lenses. The company maintains its dominance through continued product innovation, premium positioning, and targeted awareness initiatives that promote comfort, hygiene, and lifestyle compatibility. Meanwhile, CooperVision do Brasil Ltda holds a 17.8% share, strengthening its presence through specialised offerings such as toric and multifocal lenses. Its focus on addressing complex vision needs, alongside professional partnerships and educational initiatives, has helped drive above-average growth. As competition intensifies, both companies continue investing in digital retail, innovation, and segmentation strategies to capture value in the evolving daily disposable and myopia management segments.
Frequently Asked Questions
Related Report
1. Market Segmentation
1.1. Research Scope
1.2. Research Methodology
1.3. Definitions and Assumptions
2. Executive Summary
3. Brazil Contact Lenses and Solution Market Policies, Regulations, and Standards
4. Brazil Contact Lenses and Solution Market Dynamics
4.1. Growth Factors
4.2. Challenges
4.3. Trends
4.4. Opportunities
5. Brazil Contact Lenses and Solution Market Statistics, 2022-2032F
5.1. Market Size & Growth Outlook
5.1.1.By Revenues in USD Million
5.1.2.By Units Sold in Thousand Units
5.2. Market Segmentation & Growth Outlook
5.2.1.By Product Type
5.2.1.1. Contact Lenses- Market Insights and Forecast 2022-2032, USD Million
5.2.1.1.1. Standard Vision Correction Lenses- Market Insights and Forecast 2022-2032, USD Million
5.2.1.1.2. Myopia Control Lenses- Market Insights and Forecast 2022-2032, USD Million
5.2.1.2. Contact Lens Solutions- Market Insights and Forecast 2022-2032, USD Million
5.2.2.By Usage
5.2.2.1. Contact Lenses- Market Insights and Forecast 2022-2032, USD Million
5.2.2.1.1. Daily Disposable- Market Insights and Forecast 2022-2032, USD Million
5.2.2.1.2. Bi-Weekly- Market Insights and Forecast 2022-2032, USD Million
5.2.2.1.3. Monthly- Market Insights and Forecast 2022-2032, USD Million
5.2.2.1.4. Quarterly/Annual- Market Insights and Forecast 2022-2032, USD Million
5.2.2.2. Contact Lens Solutions- Market Insights and Forecast 2022-2032, USD Million
5.2.2.2.1. Daily-Use Care Solutions- Market Insights and Forecast 2022-2032, USD Million
5.2.2.2.2. Weekly/Periodic Deep-Clean Systems- Market Insights and Forecast 2022-2032, USD Million
5.2.2.2.3. Travel/Mini Packs- Market Insights and Forecast 2022-2032, USD Million
5.2.3.By Material Type
5.2.3.1. Contact Lenses- Market Insights and Forecast 2022-2032, USD Million
5.2.3.1.1. Silicone Hydrogel- Market Insights and Forecast 2022-2032, USD Million
5.2.3.1.2. Hydrogel (Soft)- Market Insights and Forecast 2022-2032, USD Million
5.2.3.1.3. Rigid Gas Permeable (RGP)- Market Insights and Forecast 2022-2032, USD Million
5.2.3.1.4. Hybrid/Scleral/Specialty- Market Insights and Forecast 2022-2032, USD Million
5.2.3.2. Contact Lens Solutions- Market Insights and Forecast 2022-2032, USD Million
5.2.3.2.1. Multi-Purpose Solutions- Market Insights and Forecast 2022-2032, USD Million
5.2.3.2.2. Hydrogen Peroxide Systems- Market Insights and Forecast 2022-2032, USD Million
5.2.3.2.3. Saline Solutions- Market Insights and Forecast 2022-2032, USD Million
5.2.3.2.4. Enzymatic & Specialty Cleaners- Market Insights and Forecast 2022-2032, USD Million
5.2.4.By Application
5.2.4.1. Contact Lenses- Market Insights and Forecast 2022-2032, USD Million
5.2.4.1.1. Spherical (Myopia/Hyperopia)- Market Insights and Forecast 2022-2032, USD Million
5.2.4.1.2. Toric (Astigmatism)- Market Insights and Forecast 2022-2032, USD Million
5.2.4.1.3. Multifocal (Presbyopia)- Market Insights and Forecast 2022-2032, USD Million
5.2.4.1.4. Myopia Control- Market Insights and Forecast 2022-2032, USD Million
5.2.4.1.5. Cosmetic/Colored- Market Insights and Forecast 2022-2032, USD Million
5.2.4.1.6. Therapeutic/Medical- Market Insights and Forecast 2022-2032, USD Million
5.2.4.2. Contact Lens Solutions- Market Insights and Forecast 2022-2032, USD Million
5.2.4.2.1. Soft Lens Care- Market Insights and Forecast 2022-2032, USD Million
5.2.4.2.2. RGP Lens Care- Market Insights and Forecast 2022-2032, USD Million
5.2.4.2.3. Sensitive Eye/Preservative-Free Care- Market Insights and Forecast 2022-2032, USD Million
5.2.5.By Sales Channel
5.2.5.1. Retail Offline- Market Insights and Forecast 2022-2032, USD Million
5.2.5.1.1. Optical Stores- Market Insights and Forecast 2022-2032, USD Million
5.2.5.1.2. Hospitals & Clinics- Market Insights and Forecast 2022-2032, USD Million
5.2.5.1.3. Others (Pharmacies, Beauty Centres, etc.)- Market Insights and Forecast 2022-2032, USD Million
5.2.5.2. Retail Online- Market Insights and Forecast 2022-2032, USD Million
5.2.5.2.1. Company-owned Portals- Market Insights and Forecast 2022-2032, USD Million
5.2.5.2.2. E-commerce Platforms- Market Insights and Forecast 2022-2032, USD Million
5.2.6.By Pack Size
5.2.6.1. Contact Lenses- Market Insights and Forecast 2022-2032, USD Million
5.2.6.1.1. Trial Packs- Market Insights and Forecast 2022-2032, USD Million
5.2.6.1.2. Standard Packs- Market Insights and Forecast 2022-2032, USD Million
5.2.6.1.3. Bulk/Value Packs- Market Insights and Forecast 2022-2032, USD Million
5.2.6.2. Contact Lens Solutions- Market Insights and Forecast 2022-2032, USD Million
5.2.6.2.1. Up to 120 mL- Market Insights and Forecast 2022-2032, USD Million
5.2.6.2.2. 121–360 mL- Market Insights and Forecast 2022-2032, USD Million
5.2.6.2.3. Above 360 mL- Market Insights and Forecast 2022-2032, USD Million
5.2.6.2.4. Combo/Twin Packs- Market Insights and Forecast 2022-2032, USD Million
5.2.7.By Region
5.2.7.1. North
5.2.7.2. Center-West
5.2.7.3. Northeast
5.2.7.4. Southeast
5.2.7.5. South
5.2.8.By Competitors
5.2.8.1. Competition Characteristics
5.2.8.2. Market Share & Analysis
6. Brazil Contact Lenses Market Statistics, 2022-2032
6.1. Market Size & Growth Outlook
6.1.1.By Revenues in USD Million
6.1.2.By Units Sold in Thousand Units
6.2. Market Segmentation & Growth Outlook
6.2.1.By Usage- Market Insights and Forecast 2022-2032, USD Million
6.2.2.By Material Type- Market Insights and Forecast 2022-2032, USD Million
6.2.3.By Application- Market Insights and Forecast 2022-2032, USD Million
6.2.4.By Sales Channel- Market Insights and Forecast 2022-2032, USD Million
6.2.5.By Pack Size- Market Insights and Forecast 2022-2032, USD Million
6.2.6.By Region- Market Insights and Forecast 2022-2032, USD Million
7. Brazil Contact Lens Solutions Market Statistics, 2022-2032
7.1. Market Size & Growth Outlook
7.1.1.By Revenues in USD Million
7.1.2.By Units Sold in Thousand Units
7.2. Market Segmentation & Growth Outlook
7.2.1.By Usage- Market Insights and Forecast 2022-2032, USD Million
7.2.2.By Material Type- Market Insights and Forecast 2022-2032, USD Million
7.2.3.By Application- Market Insights and Forecast 2022-2032, USD Million
7.2.4.By Sales Channel- Market Insights and Forecast 2022-2032, USD Million
7.2.5.By Pack Size- Market Insights and Forecast 2022-2032, USD Million
7.2.6.By Region- Market Insights and Forecast 2022-2032, USD Million
8. Competitive Outlook
8.1. Company Profiles
8.1.1.Johnson & Johnson do Brasil Indústria e Comércio de Produtos para Saúde Ltda
8.1.1.1. Business Description
8.1.1.2. Product Portfolio
8.1.1.3. Collaborations & Alliances
8.1.1.4. Recent Developments
8.1.1.5. Financial Details
8.1.1.6. Others
8.1.2.CooperVision do Brasil Ltda
8.1.2.1. Business Description
8.1.2.2. Product Portfolio
8.1.2.3. Collaborations & Alliances
8.1.2.4. Recent Developments
8.1.2.5. Financial Details
8.1.2.6. Others
8.1.3.Solótica Indústria e Comércio Ltda
8.1.3.1. Business Description
8.1.3.2. Product Portfolio
8.1.3.3. Collaborations & Alliances
8.1.3.4. Recent Developments
8.1.3.5. Financial Details
8.1.3.6. Others
8.1.4.Alcon Laboratórios do Brasil Ltda
8.1.4.1. Business Description
8.1.4.2. Product Portfolio
8.1.4.3. Collaborations & Alliances
8.1.4.4. Recent Developments
8.1.4.5. Financial Details
8.1.4.6. Others
8.1.5.Bausch & Lomb do Brasil Ltda
8.1.5.1. Business Description
8.1.5.2. Product Portfolio
8.1.5.3. Collaborations & Alliances
8.1.5.4. Recent Developments
8.1.5.5. Financial Details
8.1.5.6. Others
9. Disclaimer
| Segment | Sub-Segment |
|---|---|
| By Product Type |
|
| By Usage |
|
| By Material Type |
|
| By Application |
|
| By Sales Channel |
|
| By Pack Size |
|
| By Region |
|
Research Methodology
This study followed a structured approach comprising four key phases to assess the size and scope of the electro-oxidation market. The process began with thorough secondary research to collect data on the target market, related markets, and broader industry context. These findings, along with preliminary assumptions and estimates, were then validated through extensive primary research involving industry experts from across the value chain. To calculate the overall market size, both top-down and bottom-up methodologies were employed. Finally, market segmentation and data triangulation techniques were applied to refine and validate segment-level estimations.
Secondary Research
The secondary research phase involved gathering data from a wide range of credible and published sources. This step helped in identifying industry trends, defining market segmentation, and understanding the market landscape and value chain.
Sources consulted during this phase included:
- Company annual reports, investor presentations, and press releases
- Industry white papers and certified publications
- Trade directories and market-recognized databases
- Articles from authoritative authors and reputable journals
- Gold and silver standard websites
Secondary research was critical in mapping out the industry's value chain and monetary flow, identifying key market segments, understanding regional variations, and tracking significant industry developments.
Other key sources:
- Financial disclosures
- Industry associations and trade bodies
- News outlets and business magazines
- Academic journals and research studies
- Paid industry databases
Primary Research
To validate secondary data and gain deeper market insights, primary research was conducted with key stakeholders across both the supply and demand sides of the market.
On the demand side, participants included decision-makers and influencers from end-user industries—such as CIOs, CTOs, and CSOs—who provided first-hand perspectives on market needs, product usage, and future expectations.
On the supply side, interviews were conducted with manufacturers, industry associations, and institutional participants to gather insights into current offerings, product pipelines, and market challenges.
Primary interviews provided critical inputs such as:
- Market size and revenue data
- Product and service breakdowns
- Market forecasts
- Regional and application-specific trends
Stakeholders consulted included:
- Leading OEM and solution providers
- Channel and distribution partners
- End users across various applications
- Independent consultants and industry specialists
Market Size Estimation and Data Triangulation
- Identifying Key Market Participants (Secondary Research)
- Goal: To identify the major players or companies in the target market. This typically involves using publicly available data sources such as industry reports, market research publications, and financial statements of companies.
- Tools: Reports from firms like Gartner, Forrester, Euromonitor, Statista, IBISWorld, and others. Public financial statements, news articles, and press releases from top market players.
- Extracting Earnings of Key Market Participants
- Goal: To estimate the earnings generated from the product or service being analyzed. This step helps in understanding the revenue potential of each market player in a specific geography.
- Methods: Earnings data can be gathered from:
- Publicly available financial reports (for listed companies).
- Interviews and primary data sources from professionals, such as Directors, VPs, SVPs, etc. This is especially useful for understanding more nuanced, internal data that isn't publicly disclosed.
- Annual reports and investor presentations of key players.
- Data Collation and Development of a Relevant Data Model
- Goal: To collate inputs from both primary and secondary sources into a structured, data-driven model for market estimation. This model will incorporate key market KPIs and any independent variables relevant to the market.
- Key KPIs: These could include:
- Market size, growth rate, and demand drivers.
- Industry-specific metrics like market share, average revenue per customer (ARPC), or average deal size.
- External variables, such as economic growth rates, inflation rates, or commodity prices, that could affect the market.
- Data Modeling: Based on this data, the market forecasts are developed for the next 5 years. A combination of trend analysis, scenario modeling, and statistical regression might be used to generate projections.
- Scenario Analysis
- Goal: To test different assumptions and validate how sensitive the market is to changes in key variables (e.g., market demand, regulatory changes, technological disruptions).
- Types of Scenarios:
- Base Case: Based on current assumptions and historical data.
- Best-Case Scenario: Assuming favorable market conditions, regulatory environments, and technological advancements.
- Worst-Case Scenario: Accounting for adverse factors, such as economic downturns, stricter regulations, or unexpected disruptions.


