Australia Contact Lenses and Solutions Market Report: Trends, Growth and Forecast (2026-2032)
By Product Type (Contact Lenses (Standard Vision Correction Lenses, Myopia Control Lenses), Contact Lens Solutions), By Usage (Contact Lenses (Daily Disposable, Bi-Weekly, Monthly, Quarterly/Annual), Contact Lens Solutions (Daily-Use Care Solutions, Weekly/Periodic Deep-Clean Systems, Travel/Mini Packs)), By Material Type (Contact Lenses (Silicone Hydrogel, Hydrogel (Soft), Rigid Gas Permeable (RGP), Hybrid/Scleral/Specialty), Contact Lens Solutions (Multi-Purpose Solutions, Hydrogen Peroxide Systems, Saline Solutions, Enzymatic & Specialty Cleaners)), By Application (Contact Lenses (Spherical (Myopia/Hyperopia), Toric (Astigmatism), Multifocal (Presbyopia), Myopia Control, Cosmetic/Colored, Therapeutic/Medical), Contact Lens Solutions (Soft Lens Care, RGP Lens Care, Sensitive Eye/Preservative-Free Care)), By Sales Channel (Retail Offline (Optical Stores, Hospitals & Clinics, Others (Pharmacies, Beauty Centres, etc.)), Retail Online (Company-owned Portals, E-commerce Platforms)), By Pack Size (Contact Lenses (Trial Packs, Standard Packs, Bulk/Value Packs), Contact Lens Solutions (Up to 120 mL, 121–360 mL, Above 360 mL, Combo/Twin Packs)), By Region (Queensland, New South Wales, Victoria, South Australia, Others) ... Read more
|
Major Players
|
Australia Contact Lenses and Solutions Market Statistics and Insights, 2026
- Market Size Statistics
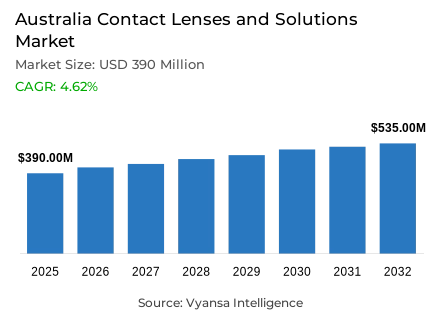
- Contact lenses and solutions market size in Australia was estimated at USD 390 million in 2025.
- The market size is expected to grow to USD 535 million by 2032.
- Market to register a CAGR of around 4.62% during 2026-32.
- Product Type Shares
- Contact lenses grabbed market share of 95%.
- Competition
- More than 5 companies are actively engaged in producing contact lenses and solutions in Australia.
- Top 5 companies acquired around 75% of the market share.
- Coopervision Contact Lens Pty Ltd, Bausch & Lomb (Australia) Pty Ltd, Benra Pty Ltd, Alcon Laboratories (Aust) Pty Ltd, Johnson & Johnson Vision Care (Australia) etc., are few of the top companies.
- Sales Channel
- Retail offline grabbed 55% of the market.
Australia Contact Lenses and Solutions Market Outlook
The contact lenses and solutions market in Australia was estimated to be $390 million in 2025 and $535 million by 2032, which is a CAGR of about 4.62% increase over the next 6 years, from 2026 to 2032. However, the increase is backed by growing awareness of myopia management and the development of a system of systematical vision care. According to the Australia and New Zealand Child Myopia Report, about 30% of children have never visited an optometrist. This shows a lack of early detection and diagnosis. Moreover, according to the Australian Institute of Health and Welfare, vision disorders are still among the most common long-term health conditions and will continue to exact the need to find corrective measures. However, the regulation of contact lenses used cosmetically is still ad hoc.
The Therapeutic Goods Administration noted that differences exist in the regulation of non-prescription cosmetic contact lenses sold in each state, which has resulted in safety concerns. At the same time, the digital buying is transforming the market environment, with the Australian Bureau of Statistics reporting that 79% of households made online purchases in 2024, thus increasing the rate of subscription-based purchasing behaviour.
Sustainability efforts are also on the rise, especially with Australia producing 75.8 million tonnes of waste in 2022-23 as stated by Department of Climate Change, which has triggered the adoption of recycling programmes.
Contact lenses dominate 95% of the market by segmentation, which demonstrates a strong preference of daily disposable forms. In terms of sales channels, offline retail represents 55% since end users continue to use professional optometrists to get fittings and prescriptions.

Australia Contact Lenses and Solutions Market Growth Driver
Rising Myopia Burden Strengthens Need for Vision Correction
The rising incidence of myopia in Australia is a major growth engine. According to the Australia and New Zealand Child Myopia Report, it is estimated that about 30% of children have never had an eye test with an optometrist, which exposes a significant gap in early detection and intervention. Moreover, according to the Australian Institute of Health and Welfare (AIHW), vision disorders are one of the most prevalent long-term health issues impacting Australians, thus increasing the need to find corrective solutions.
With the increased awareness, parents and healthcare professionals are now more concerned with early and effective vision correction. Structured myopia control as a standard of care is supported by government-supported programs and professional standards, such as the position statement on Myopia Management by Optometry Australia, which continues to drive the demand of contact lenses and other solutions.
Australia Contact Lenses and Solutions Market Challenge
Regulatory Gaps in Cosmetic Lenses Raise Safety Concerns
There is a major challenge of fragmented regulation of cosmetic contact lenses. The Therapeutic Goods Administration states that the regulation of non-prescription cosmetic lenses differs in various states, thus providing inconsistency in enforcement. Optometry Australia emphasizes the current issues with the inappropriate use and the lack of prescription in some areas.
The absence of standardized national laws increases the chances of unsafe procurement, especially via the Internet. Health officials are still warning that the lack of proper lens hygiene and unregulated sales are increasing the risk of infections and complications. Such regulatory discrepancies hinder organized market growth and subject well-established brands to reputational risks.
Unlock Market Intelligence
Explore the market potential with our data-driven report
Australia Contact Lenses and Solutions Market Trend
Digital Subscription Models Reshape Purchasing Behaviour
Digital transformation is becoming a significant trend. According to the Australian Bureau of Statistics (ABS, 2025), 79% of Australian households purchased online in 2024, indicating a strong use of e-commerce platforms. This change in behaviour has a direct impact on repeat-purchase items like contact lenses. Retailers are incorporating subscription-based strategies to improve convenience and customer retention.
As an example, in 2025, large optical retailers launched organized subscription programmes, where they provided discounted recurring deliveries. With the growing digital adoption, online personalisation and repeated delivery services will be at the centre of customer loyalty and brand differentiation.
Australia Contact Lenses and Solutions Market Opportunity
Sustainability Initiatives Create Competitive Differentiation
The opportunity of environmental sustainability is interesting. According to the Australian Department of Climate Change, Energy, the Environment and Water (2024), in 2022-23, Australia produced 75.8 million tonnes of waste, of which plastic waste is a major issue. Contact lens blister packs and cases add to the small-format plastic waste that is difficult to recycle using traditional systems. This gap is directly filled by industry-led recycling programs, including in-store collection and prepaid return programmes launched in collaboration with large optical chains.
With the increasing environmental consciousness, brands that correspond to the principles of the circular-economy strengthen end user trust and long-term interaction. Sustainability, therefore, becomes a differentiating strategic opportunity.
Unlock Market Intelligence
Explore the market potential with our data-driven report
Australia Contact Lenses and Solutions Market Segmentation Analysis
By Product Type
- Contact Lenses
- Standard Vision Correction Lenses
- Myopia Control Lenses
- Contact Lens Solutions
The segment has the highest share around segment under the product type is contact lenses, which grabbed a market share of 95%. Within this category, daily disposable lenses dominate due to strong consumer preference for hygiene, convenience, and comfort. These products align with modern lifestyle demands and reduce the need for cleaning solutions, driving consistent adoption.
Growing awareness of eye health and structured myopia management further strengthens the dominance of contact lenses over solutions. Innovations in toric and multifocal designs also expand usability among older end users and individuals with complex prescriptions, reinforcing the category’s leadership position.

By Sales Channel
- Retail Offline
- Optical Stores
- Hospitals & Clinics
- Others (Pharmacies, Beauty Centres, etc.)
- Retail Online
- Company-owned Portals
- E-commerce Platforms
The segment has the highest share around segment under the sales channel is retail offline, accounting for 55% of the market. end users continue to rely on optometrists and physical optical stores for eye examinations, fittings, and professional guidance, especially for first-time users transitioning from spectacles.
Offline channels build trust through personalised consultation and clinical assurance. While online purchasing is expanding, professional eye care services remain central to initial prescriptions and product recommendations, maintaining the leadership of retail offline sales in the distribution landscape.
List of Companies Covered in Australia Contact Lenses and Solutions Market
The companies listed below are highly influential in the Australia contact lenses and solutions market, with a significant market share and a strong impact on industry developments.
- Coopervision Contact Lens Pty Ltd
- Bausch & Lomb (Australia) Pty Ltd
- Benra Pty Ltd
- Alcon Laboratories (Aust) Pty Ltd
- Johnson & Johnson Vision Care (Australia)
- Capricornia Contact Lens Pty Ltd
- Contact Lens Centre Australia Ltd
Competitive Landscape
The contact lenses and solutions market in Australia in 2025 is led by Alcon Laboratories (Aust) Pty Ltd, which holds a market share of 26.9%, supported by its strong positioning in the mid-to-premium segment. The company benefits from the continued success of its Dailies portfolio and the growing acceptance of Precision1 as a more affordable daily disposable option. Its launch of Total30 reusable lenses further strengthens its innovation-led strategy, helping it maintain leadership through a balanced offering across comfort, performance, and product variety.Following closely is Johnson & Johnson Vision Care, accounting for 23.8% of the market. The company leverages its strong brand reputation and wide product portfolio to sustain competitive momentum. Its focus on comfort-driven solutions and ongoing professional engagement with optometrists supports consistent consumer loyalty. The presence of both players highlights a competitive environment shaped by innovation, premium positioning, and long-term brand trust.
Frequently Asked Questions
Related Report
1. Market Segmentation
1.1. Research Scope
1.2. Research Methodology
1.3. Definitions and Assumptions
2. Executive Summary
3. Australia Contact Lenses and Solution Market Policies, Regulations, and Standards
4. Australia Contact Lenses and Solution Market Dynamics
4.1. Growth Factors
4.2. Challenges
4.3. Trends
4.4. Opportunities
5. Australia Contact Lenses and Solution Market Statistics, 2022-2032F
5.1. Market Size & Growth Outlook
5.1.1.By Revenues in USD Million
5.1.2.By Units Sold in Thousand Units
5.2. Market Segmentation & Growth Outlook
5.2.1.By Product Type
5.2.1.1. Contact Lenses- Market Insights and Forecast 2022-2032, USD Million
5.2.1.1.1. Standard Vision Correction Lenses- Market Insights and Forecast 2022-2032, USD Million
5.2.1.1.2. Myopia Control Lenses- Market Insights and Forecast 2022-2032, USD Million
5.2.1.2. Contact Lens Solutions- Market Insights and Forecast 2022-2032, USD Million
5.2.2.By Usage
5.2.2.1. Contact Lenses- Market Insights and Forecast 2022-2032, USD Million
5.2.2.1.1. Daily Disposable- Market Insights and Forecast 2022-2032, USD Million
5.2.2.1.2. Bi-Weekly- Market Insights and Forecast 2022-2032, USD Million
5.2.2.1.3. Monthly- Market Insights and Forecast 2022-2032, USD Million
5.2.2.1.4. Quarterly/Annual- Market Insights and Forecast 2022-2032, USD Million
5.2.2.2. Contact Lens Solutions- Market Insights and Forecast 2022-2032, USD Million
5.2.2.2.1. Daily-Use Care Solutions- Market Insights and Forecast 2022-2032, USD Million
5.2.2.2.2. Weekly/Periodic Deep-Clean Systems- Market Insights and Forecast 2022-2032, USD Million
5.2.2.2.3. Travel/Mini Packs- Market Insights and Forecast 2022-2032, USD Million
5.2.3.By Material Type
5.2.3.1. Contact Lenses- Market Insights and Forecast 2022-2032, USD Million
5.2.3.1.1. Silicone Hydrogel- Market Insights and Forecast 2022-2032, USD Million
5.2.3.1.2. Hydrogel (Soft)- Market Insights and Forecast 2022-2032, USD Million
5.2.3.1.3. Rigid Gas Permeable (RGP)- Market Insights and Forecast 2022-2032, USD Million
5.2.3.1.4. Hybrid/Scleral/Specialty- Market Insights and Forecast 2022-2032, USD Million
5.2.3.2. Contact Lens Solutions- Market Insights and Forecast 2022-2032, USD Million
5.2.3.2.1. Multi-Purpose Solutions- Market Insights and Forecast 2022-2032, USD Million
5.2.3.2.2. Hydrogen Peroxide Systems- Market Insights and Forecast 2022-2032, USD Million
5.2.3.2.3. Saline Solutions- Market Insights and Forecast 2022-2032, USD Million
5.2.3.2.4. Enzymatic & Specialty Cleaners- Market Insights and Forecast 2022-2032, USD Million
5.2.4.By Application
5.2.4.1. Contact Lenses- Market Insights and Forecast 2022-2032, USD Million
5.2.4.1.1. Spherical (Myopia/Hyperopia)- Market Insights and Forecast 2022-2032, USD Million
5.2.4.1.2. Toric (Astigmatism)- Market Insights and Forecast 2022-2032, USD Million
5.2.4.1.3. Multifocal (Presbyopia)- Market Insights and Forecast 2022-2032, USD Million
5.2.4.1.4. Myopia Control- Market Insights and Forecast 2022-2032, USD Million
5.2.4.1.5. Cosmetic/Colored- Market Insights and Forecast 2022-2032, USD Million
5.2.4.1.6. Therapeutic/Medical- Market Insights and Forecast 2022-2032, USD Million
5.2.4.2. Contact Lens Solutions- Market Insights and Forecast 2022-2032, USD Million
5.2.4.2.1. Soft Lens Care- Market Insights and Forecast 2022-2032, USD Million
5.2.4.2.2. RGP Lens Care- Market Insights and Forecast 2022-2032, USD Million
5.2.4.2.3. Sensitive Eye/Preservative-Free Care- Market Insights and Forecast 2022-2032, USD Million
5.2.5.By Sales Channel
5.2.5.1. Retail Offline- Market Insights and Forecast 2022-2032, USD Million
5.2.5.1.1. Optical Stores- Market Insights and Forecast 2022-2032, USD Million
5.2.5.1.2. Hospitals & Clinics- Market Insights and Forecast 2022-2032, USD Million
5.2.5.1.3. Others (Pharmacies, Beauty Centres, etc.)- Market Insights and Forecast 2022-2032, USD Million
5.2.5.2. Retail Online- Market Insights and Forecast 2022-2032, USD Million
5.2.5.2.1. Company-owned Portals- Market Insights and Forecast 2022-2032, USD Million
5.2.5.2.2. E-commerce Platforms- Market Insights and Forecast 2022-2032, USD Million
5.2.6.By Pack Size
5.2.6.1. Contact Lenses- Market Insights and Forecast 2022-2032, USD Million
5.2.6.1.1. Trial Packs- Market Insights and Forecast 2022-2032, USD Million
5.2.6.1.2. Standard Packs- Market Insights and Forecast 2022-2032, USD Million
5.2.6.1.3. Bulk/Value Packs- Market Insights and Forecast 2022-2032, USD Million
5.2.6.2. Contact Lens Solutions- Market Insights and Forecast 2022-2032, USD Million
5.2.6.2.1. Up to 120 mL- Market Insights and Forecast 2022-2032, USD Million
5.2.6.2.2. 121–360 mL- Market Insights and Forecast 2022-2032, USD Million
5.2.6.2.3. Above 360 mL- Market Insights and Forecast 2022-2032, USD Million
5.2.6.2.4. Combo/Twin Packs- Market Insights and Forecast 2022-2032, USD Million
5.2.7.By Region
5.2.7.1. Queensland
5.2.7.2. New South Wales
5.2.7.3. Victoria
5.2.7.4. South Australia
5.2.7.5. Others
5.2.8.By Competitors
5.2.8.1. Competition Characteristics
5.2.8.2. Market Share & Analysis
6. Australia Contact Lenses Market Statistics, 2022-2032
6.1. Market Size & Growth Outlook
6.1.1.By Revenues in USD Million
6.1.2.By Units Sold in Thousand Units
6.2. Market Segmentation & Growth Outlook
6.2.1.By Usage- Market Insights and Forecast 2022-2032, USD Million
6.2.2.By Material Type- Market Insights and Forecast 2022-2032, USD Million
6.2.3.By Application- Market Insights and Forecast 2022-2032, USD Million
6.2.4.By Sales Channel- Market Insights and Forecast 2022-2032, USD Million
6.2.5.By Pack Size- Market Insights and Forecast 2022-2032, USD Million
6.2.6.By Region- Market Insights and Forecast 2022-2032, USD Million
7. Australia Contact Lens Solutions Market Statistics, 2022-2032
7.1. Market Size & Growth Outlook
7.1.1.By Revenues in USD Million
7.1.2.By Units Sold in Thousand Units
7.2. Market Segmentation & Growth Outlook
7.2.1.By Usage- Market Insights and Forecast 2022-2032, USD Million
7.2.2.By Material Type- Market Insights and Forecast 2022-2032, USD Million
7.2.3.By Application- Market Insights and Forecast 2022-2032, USD Million
7.2.4.By Sales Channel- Market Insights and Forecast 2022-2032, USD Million
7.2.5.By Pack Size- Market Insights and Forecast 2022-2032, USD Million
7.2.6.By Region- Market Insights and Forecast 2022-2032, USD Million
8. Competitive Outlook
8.1. Company Profiles
8.1.1.Alcon Laboratories (Aust) Pty Ltd
8.1.1.1. Business Description
8.1.1.2. Product Portfolio
8.1.1.3. Collaborations & Alliances
8.1.1.4. Recent Developments
8.1.1.5. Financial Details
8.1.1.6. Others
8.1.2.Johnson & Johnson Vision Care (Australia)
8.1.2.1. Business Description
8.1.2.2. Product Portfolio
8.1.2.3. Collaborations & Alliances
8.1.2.4. Recent Developments
8.1.2.5. Financial Details
8.1.2.6. Others
8.1.3.Coopervision Contact Lens Pty Ltd
8.1.3.1. Business Description
8.1.3.2. Product Portfolio
8.1.3.3. Collaborations & Alliances
8.1.3.4. Recent Developments
8.1.3.5. Financial Details
8.1.3.6. Others
8.1.4.Bausch & Lomb (Australia) Pty Ltd
8.1.4.1. Business Description
8.1.4.2. Product Portfolio
8.1.4.3. Collaborations & Alliances
8.1.4.4. Recent Developments
8.1.4.5. Financial Details
8.1.4.6. Others
8.1.5.Benra Pty Ltd
8.1.5.1. Business Description
8.1.5.2. Product Portfolio
8.1.5.3. Collaborations & Alliances
8.1.5.4. Recent Developments
8.1.5.5. Financial Details
8.1.5.6. Others
8.1.6.Capricornia Contact Lens Pty Ltd
8.1.6.1. Business Description
8.1.6.2. Product Portfolio
8.1.6.3. Collaborations & Alliances
8.1.6.4. Recent Developments
8.1.6.5. Financial Details
8.1.6.6. Others
8.1.7.Contact Lens Centre Australia Ltd
8.1.7.1. Business Description
8.1.7.2. Product Portfolio
8.1.7.3. Collaborations & Alliances
8.1.7.4. Recent Developments
8.1.7.5. Financial Details
8.1.7.6. Others
9. Disclaimer
| Segment | Sub-Segment |
|---|---|
| By Product Type |
|
| By Usage |
|
| By Material Type |
|
| By Application |
|
| By Sales Channel |
|
| By Pack Size |
|
| By Region |
|
Research Methodology
This study followed a structured approach comprising four key phases to assess the size and scope of the electro-oxidation market. The process began with thorough secondary research to collect data on the target market, related markets, and broader industry context. These findings, along with preliminary assumptions and estimates, were then validated through extensive primary research involving industry experts from across the value chain. To calculate the overall market size, both top-down and bottom-up methodologies were employed. Finally, market segmentation and data triangulation techniques were applied to refine and validate segment-level estimations.
Secondary Research
The secondary research phase involved gathering data from a wide range of credible and published sources. This step helped in identifying industry trends, defining market segmentation, and understanding the market landscape and value chain.
Sources consulted during this phase included:
- Company annual reports, investor presentations, and press releases
- Industry white papers and certified publications
- Trade directories and market-recognized databases
- Articles from authoritative authors and reputable journals
- Gold and silver standard websites
Secondary research was critical in mapping out the industry's value chain and monetary flow, identifying key market segments, understanding regional variations, and tracking significant industry developments.
Other key sources:
- Financial disclosures
- Industry associations and trade bodies
- News outlets and business magazines
- Academic journals and research studies
- Paid industry databases
Primary Research
To validate secondary data and gain deeper market insights, primary research was conducted with key stakeholders across both the supply and demand sides of the market.
On the demand side, participants included decision-makers and influencers from end-user industries—such as CIOs, CTOs, and CSOs—who provided first-hand perspectives on market needs, product usage, and future expectations.
On the supply side, interviews were conducted with manufacturers, industry associations, and institutional participants to gather insights into current offerings, product pipelines, and market challenges.
Primary interviews provided critical inputs such as:
- Market size and revenue data
- Product and service breakdowns
- Market forecasts
- Regional and application-specific trends
Stakeholders consulted included:
- Leading OEM and solution providers
- Channel and distribution partners
- End users across various applications
- Independent consultants and industry specialists
Market Size Estimation and Data Triangulation
- Identifying Key Market Participants (Secondary Research)
- Goal: To identify the major players or companies in the target market. This typically involves using publicly available data sources such as industry reports, market research publications, and financial statements of companies.
- Tools: Reports from firms like Gartner, Forrester, Euromonitor, Statista, IBISWorld, and others. Public financial statements, news articles, and press releases from top market players.
- Extracting Earnings of Key Market Participants
- Goal: To estimate the earnings generated from the product or service being analyzed. This step helps in understanding the revenue potential of each market player in a specific geography.
- Methods: Earnings data can be gathered from:
- Publicly available financial reports (for listed companies).
- Interviews and primary data sources from professionals, such as Directors, VPs, SVPs, etc. This is especially useful for understanding more nuanced, internal data that isn't publicly disclosed.
- Annual reports and investor presentations of key players.
- Data Collation and Development of a Relevant Data Model
- Goal: To collate inputs from both primary and secondary sources into a structured, data-driven model for market estimation. This model will incorporate key market KPIs and any independent variables relevant to the market.
- Key KPIs: These could include:
- Market size, growth rate, and demand drivers.
- Industry-specific metrics like market share, average revenue per customer (ARPC), or average deal size.
- External variables, such as economic growth rates, inflation rates, or commodity prices, that could affect the market.
- Data Modeling: Based on this data, the market forecasts are developed for the next 5 years. A combination of trend analysis, scenario modeling, and statistical regression might be used to generate projections.
- Scenario Analysis
- Goal: To test different assumptions and validate how sensitive the market is to changes in key variables (e.g., market demand, regulatory changes, technological disruptions).
- Types of Scenarios:
- Base Case: Based on current assumptions and historical data.
- Best-Case Scenario: Assuming favorable market conditions, regulatory environments, and technological advancements.
- Worst-Case Scenario: Accounting for adverse factors, such as economic downturns, stricter regulations, or unexpected disruptions.


