Argentina Contact Lenses and Solutions Market Report: Trends, Growth and Forecast (2026-2032)
By Product Type (Contact Lenses (Standard Vision Correction Lenses, Myopia Control Lenses), Contact Lens Solutions), By Usage (Contact Lenses (Daily Disposable, Bi-Weekly, Monthly, Quarterly/Annual), Contact Lens Solutions (Daily-Use Care Solutions, Weekly/Periodic Deep-Clean Systems, Travel/Mini Packs)), By Material Type (Contact Lenses (Silicone Hydrogel, Hydrogel (Soft), Rigid Gas Permeable (RGP), Hybrid/Scleral/Specialty), Contact Lens Solutions (Multi-Purpose Solutions, Hydrogen Peroxide Systems, Saline Solutions, Enzymatic & Specialty Cleaners)), By Application (Contact Lenses (Spherical (Myopia/Hyperopia), Toric (Astigmatism), Multifocal (Presbyopia), Myopia Control, Cosmetic/Colored, Therapeutic/Medical), Contact Lens Solutions (Soft Lens Care, RGP Lens Care, Sensitive Eye/Preservative-Free Care)), By Sales Channel (Retail Offline (Optical Stores, Hospitals & Clinics, Others (Pharmacies, Beauty Centres, etc.)), Retail Online (Company-owned Portals, E-commerce Platforms)), By Pack Size (Contact Lenses (Trial Packs, Standard Packs, Bulk/Value Packs), Contact Lens Solutions (Up to 120 mL, 121–360 mL, Above 360 mL, Combo/Twin Packs)) ... Read more
|
Major Players
|
Argentina Contact Lenses and Solutions Market Statistics and Insights, 2026
- Market Size Statistics
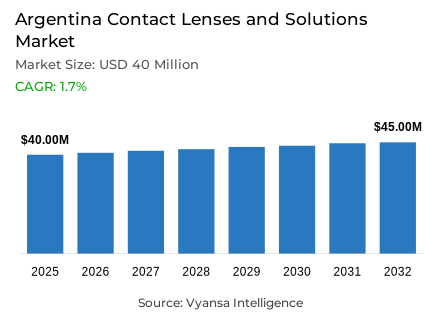
- Contact lenses and solutions market size in Argentina was estimated at USD 40 million in 2025.
- The market size is expected to grow to USD 45 million by 2032.
- Market to register a CAGR of around 1.7% during 2026-32.
- Product Type Shares
- Contact lenses grabbed market share of 75%.
- Competition
- More than 5 companies are actively engaged in producing contact lenses and solutions in Argentina.
- Top 4 companies acquired around 95% of the market share.
- Alcon Laboratorios Argentina SA, Laboratorio Pfortner Cornealent Sacif, Johnson & Johnson de Argentina SAC, Bausch & Lomb Argentina SRL etc., are few of the top companies.
- Sales Channel
- Retail offline grabbed 95% of the market.
Argentina Contact Lenses and Solutions Market Outlook
The Argentina Contact Lenses and Solutions Market was estimated to be USD 40 million in 2025 and is expected to be USD 45 million in 2032, with a CAGR of about 1.7% in 2026-32. The market is characterized by slow and consistent development, which is backed by the fact that end user buying conditions are improving, and the demand in the vision-correction products is stable. end user spending recovery and improved affordability are some of the factors that have led to the long-term performance of the category.
Consumer behaviour is being affected by increasing awareness of ocular health conditions like dry eye disease. 2022 cross-sectional, nationwide study in Argentina (published in 2024) that surveyed 10,812 people aged 12–94 using an electronic questionnaire,found out that they had symptomatic dry eye disease, highlighting the need to take care of their eyes and use products. The need to have corrective lenses and other solutions is further enhanced by the increased screen exposure and lifestyle modifications as people desire to be comfortable and have a clear view of things in their day to day activities.
Contact lenses represent 75% of the market share by product type, indicating that corrective lenses are highly preferred over ancillary solutions. Affordability and practicality are the main concerns of end users, especially in formats that need to be replaced regularly.
Through sales channel, retail offline takes 95% of the market, with end users still depending on optical stores and pharmacies to provide professional advice, fitting services and direct access to products.

Argentina Contact Lenses and Solutions Market Growth Driver
High prevalence of ocular surface conditions highlights eye health needs
Visual health issues in Argentina encompass a high prevalence of dry eye disease (DED) that impacts ocular comfort and may affect the demand of eye care services. A recent study of 10,812 Argentine adults found that 42.1 % of the participants had symptomatic DED, which is associated with screen use and contact lens wear, which require continuous visual care attention.
Due to the prevalence of symptoms like irritation, dryness, and discomfort, eye care professionals are becoming more active in informing patients about the importance of eye hygiene and lens-care practices. This climate favors contact lens and optical solution demand, with patients requiring products and expert advice to address eye comfort in addition to refractive correction.
Argentina Contact Lenses and Solutions Market Challenge
Lack of local adoption of advanced corrective options
A major obstacle in Argentina is the low local supply of high-tech vision-correction devices like myopia-control lenses. Though these products are sold in other Latin American countries, they are not sold locally, and specialists in Argentina claim that there is little exposure and low recommendation rates of such products.
This is a weakness to wider use of specialised lenses, especially in pediatric or progressive vision requirements. The lack of increased clinical exposure and training on these products can mean that patients still stick to the old corrective modalities, thus delaying the diversification of contact-lens products.
Unlock Market Intelligence
Explore the market potential with our data-driven report
Argentina Contact Lenses and Solutions Market Trend
Digital lifestyle and eye strain influence visual care behavior
Vision-health trends in Argentina and the world are being influenced by changes in lifestyle and more time at a digital screen. In investigations of eye diseases, more than six hours of digital screen time per day is linked to increased likelihood of symptomatic dry eye, which is linked to more general visual discomfort problems in contact-lens wearers.
This behavioral trend promotes increased contact with eye-care providers and can motivate end users to consider contact lenses or lens-care solutions that will be comfortable when performing extended visual activities. Screen-related eye strain is becoming a part of the eye-care advice and product selection.
Argentina Contact Lenses and Solutions Market Opportunity
Growing public awareness of eye health risk factors
It is possible to increase education on modifiable ocular-health risk factors, including excessive screen time and inadequate eye-care practices. In Argentina, researchers have associated lifestyle habits, including the use of digital devices, with the increased occurrence of visual surface diseases, such as dry eye.
This awareness can be used by eye-care professionals and brands to encourage preventive behaviours, lens hygiene, and regular eye check-ups and position contact lenses and solutions as a component of an overall eye-health routine. This education may assist in increasing the number of informed users who want to get corrective options.
Unlock Market Intelligence
Explore the market potential with our data-driven report
Argentina Contact Lenses and Solutions Market Segmentation Analysis
By Product Type
- Contact Lenses
- Standard Vision Correction Lenses
- Myopia Control Lenses
- Contact Lens Solutions
The segment has the largest share in the product type, with contact lenses controlling the value environment at 75 % of the market. This indicates that the majority of end users are more interested in corrective lenses than in ancillary eye-care products, due to the constant necessity of vision correction and the daily routine of using lenses to perform visual activities.
Daily-use and frequent replacement lenses continue to be at the center of the refractive requirements of end users, especially in situations where cost and convenience are the most important factors. With end users seeking comfort, performance, and routine correction, this type of product remains the primary source of value and highlights the key role of contact lenses in the vision-care ecosystem in Argentina.

By Sales Channel
- Retail Offline
- Optical Stores
- Hospitals & Clinics
- Others (Pharmacies, Beauty Centres, etc.)
- Retail Online
- Company-owned Portals
- E-commerce Platforms
The segment has the largest share in the sales channel, where retail offline has 95% of the market, i.e. majority of the end users buy contact lenses and solutions in physical optical stores, pharmacies and clinics. The necessity of professional fitting, personalised advice, and instant access to products affects this preference.
Eye tests, consultations and customized recommendations are also offered through off-line channels, which many contact-lens purchasers appreciate when choosing corrective products. The high significance of retail stores highlights the fact that face-to-face interaction remains significant in contact-lens buying behaviour.
List of Companies Covered in Argentina Contact Lenses and Solutions Market
The companies listed below are highly influential in the Argentina contact lenses and solutions market, with a significant market share and a strong impact on industry developments.
- Alcon Laboratorios Argentina SA
- Laboratorio Pfortner Cornealent Sacif
- Johnson & Johnson de Argentina SAC
- Bausch & Lomb Argentina SRL
Competitive Landscape
The competitive landscape in 2025 remains highly concentrated, with Johnson & Johnson de Argentina SAC leading the market with a 66.6% value share. The company maintains a dominant position through its Acuvue portfolio across daily disposable and frequent replacement lenses. Strong brand recognition, continuous promotional offers, and extensive engagement with optical professionals reinforce its leadership. The company’s scale, distribution strength, and consistent investment in in-store education further strengthen its competitive advantage in the Argentina's market.
Frequently Asked Questions
Related Report
1. Market Segmentation
1.1. Research Scope
1.2. Research Methodology
1.3. Definitions and Assumptions
2. Executive Summary
3. Argentina Contact Lenses and Solution Market Policies, Regulations, and Standards
4. Argentina Contact Lenses and Solution Market Dynamics
4.1. Growth Factors
4.2. Challenges
4.3. Trends
4.4. Opportunities
5. Argentina Contact Lenses and Solution Market Statistics, 2022-2032F
5.1. Market Size & Growth Outlook
5.1.1.By Revenues in USD Million
5.1.2.By Units Sold in Thousand Units
5.2. Market Segmentation & Growth Outlook
5.2.1.By Product Type
5.2.1.1. Contact Lenses- Market Insights and Forecast 2022-2032, USD Million
5.2.1.1.1. Standard Vision Correction Lenses- Market Insights and Forecast 2022-2032, USD Million
5.2.1.1.2. Myopia Control Lenses- Market Insights and Forecast 2022-2032, USD Million
5.2.1.2. Contact Lens Solutions- Market Insights and Forecast 2022-2032, USD Million
5.2.2.By Usage
5.2.2.1. Contact Lenses- Market Insights and Forecast 2022-2032, USD Million
5.2.2.1.1. Daily Disposable- Market Insights and Forecast 2022-2032, USD Million
5.2.2.1.2. Bi-Weekly- Market Insights and Forecast 2022-2032, USD Million
5.2.2.1.3. Monthly- Market Insights and Forecast 2022-2032, USD Million
5.2.2.1.4. Quarterly/Annual- Market Insights and Forecast 2022-2032, USD Million
5.2.2.2. Contact Lens Solutions- Market Insights and Forecast 2022-2032, USD Million
5.2.2.2.1. Daily-Use Care Solutions- Market Insights and Forecast 2022-2032, USD Million
5.2.2.2.2. Weekly/Periodic Deep-Clean Systems- Market Insights and Forecast 2022-2032, USD Million
5.2.2.2.3. Travel/Mini Packs- Market Insights and Forecast 2022-2032, USD Million
5.2.3.By Material Type
5.2.3.1. Contact Lenses- Market Insights and Forecast 2022-2032, USD Million
5.2.3.1.1. Silicone Hydrogel- Market Insights and Forecast 2022-2032, USD Million
5.2.3.1.2. Hydrogel (Soft)- Market Insights and Forecast 2022-2032, USD Million
5.2.3.1.3. Rigid Gas Permeable (RGP)- Market Insights and Forecast 2022-2032, USD Million
5.2.3.1.4. Hybrid/Scleral/Specialty- Market Insights and Forecast 2022-2032, USD Million
5.2.3.2. Contact Lens Solutions- Market Insights and Forecast 2022-2032, USD Million
5.2.3.2.1. Multi-Purpose Solutions- Market Insights and Forecast 2022-2032, USD Million
5.2.3.2.2. Hydrogen Peroxide Systems- Market Insights and Forecast 2022-2032, USD Million
5.2.3.2.3. Saline Solutions- Market Insights and Forecast 2022-2032, USD Million
5.2.3.2.4. Enzymatic & Specialty Cleaners- Market Insights and Forecast 2022-2032, USD Million
5.2.4.By Application
5.2.4.1. Contact Lenses- Market Insights and Forecast 2022-2032, USD Million
5.2.4.1.1. Spherical (Myopia/Hyperopia)- Market Insights and Forecast 2022-2032, USD Million
5.2.4.1.2. Toric (Astigmatism)- Market Insights and Forecast 2022-2032, USD Million
5.2.4.1.3. Multifocal (Presbyopia)- Market Insights and Forecast 2022-2032, USD Million
5.2.4.1.4. Myopia Control- Market Insights and Forecast 2022-2032, USD Million
5.2.4.1.5. Cosmetic/Colored- Market Insights and Forecast 2022-2032, USD Million
5.2.4.1.6. Therapeutic/Medical- Market Insights and Forecast 2022-2032, USD Million
5.2.4.2. Contact Lens Solutions- Market Insights and Forecast 2022-2032, USD Million
5.2.4.2.1. Soft Lens Care- Market Insights and Forecast 2022-2032, USD Million
5.2.4.2.2. RGP Lens Care- Market Insights and Forecast 2022-2032, USD Million
5.2.4.2.3. Sensitive Eye/Preservative-Free Care- Market Insights and Forecast 2022-2032, USD Million
5.2.5.By Sales Channel
5.2.5.1. Retail Offline- Market Insights and Forecast 2022-2032, USD Million
5.2.5.1.1. Optical Stores- Market Insights and Forecast 2022-2032, USD Million
5.2.5.1.2. Hospitals & Clinics- Market Insights and Forecast 2022-2032, USD Million
5.2.5.1.3. Others (Pharmacies, Beauty Centres, etc.)- Market Insights and Forecast 2022-2032, USD Million
5.2.5.2. Retail Online- Market Insights and Forecast 2022-2032, USD Million
5.2.5.2.1. Company-owned Portals- Market Insights and Forecast 2022-2032, USD Million
5.2.5.2.2. E-commerce Platforms- Market Insights and Forecast 2022-2032, USD Million
5.2.6.By Pack Size
5.2.6.1. Contact Lenses- Market Insights and Forecast 2022-2032, USD Million
5.2.6.1.1. Trial Packs- Market Insights and Forecast 2022-2032, USD Million
5.2.6.1.2. Standard Packs- Market Insights and Forecast 2022-2032, USD Million
5.2.6.1.3. Bulk/Value Packs- Market Insights and Forecast 2022-2032, USD Million
5.2.6.2. Contact Lens Solutions- Market Insights and Forecast 2022-2032, USD Million
5.2.6.2.1. Up to 120 mL- Market Insights and Forecast 2022-2032, USD Million
5.2.6.2.2. 121–360 mL- Market Insights and Forecast 2022-2032, USD Million
5.2.6.2.3. Above 360 mL- Market Insights and Forecast 2022-2032, USD Million
5.2.6.2.4. Combo/Twin Packs- Market Insights and Forecast 2022-2032, USD Million
5.2.7.By Competitors
5.2.7.1. Competition Characteristics
5.2.7.2. Market Share & Analysis
6. Argentina Contact Lenses Market Statistics, 2022-2032
6.1. Market Size & Growth Outlook
6.1.1.By Revenues in USD Million
6.1.2.By Units Sold in Thousand Units
6.2. Market Segmentation & Growth Outlook
6.2.1.By Usage- Market Insights and Forecast 2022-2032, USD Million
6.2.2.By Material Type- Market Insights and Forecast 2022-2032, USD Million
6.2.3.By Application- Market Insights and Forecast 2022-2032, USD Million
6.2.4.By Sales Channel- Market Insights and Forecast 2022-2032, USD Million
6.2.5.By Pack Size- Market Insights and Forecast 2022-2032, USD Million
7. Argentina Contact Lens Solutions Market Statistics, 2022-2032
7.1. Market Size & Growth Outlook
7.1.1.By Revenues in USD Million
7.1.2.By Units Sold in Thousand Units
7.2. Market Segmentation & Growth Outlook
7.2.1.By Usage- Market Insights and Forecast 2022-2032, USD Million
7.2.2.By Material Type- Market Insights and Forecast 2022-2032, USD Million
7.2.3.By Application- Market Insights and Forecast 2022-2032, USD Million
7.2.4.By Sales Channel- Market Insights and Forecast 2022-2032, USD Million
7.2.5.By Pack Size- Market Insights and Forecast 2022-2032, USD Million
8. Competitive Outlook
8.1. Company Profiles
8.1.1.Johnson & Johnson de Argentina SAC
8.1.1.1. Business Description
8.1.1.2. Product Portfolio
8.1.1.3. Collaborations & Alliances
8.1.1.4. Recent Developments
8.1.1.5. Financial Details
8.1.1.6. Others
8.1.2.Alcon Laboratorios Argentina SA
8.1.2.1. Business Description
8.1.2.2. Product Portfolio
8.1.2.3. Collaborations & Alliances
8.1.2.4. Recent Developments
8.1.2.5. Financial Details
8.1.2.6. Others
8.1.3.Bausch & Lomb Argentina SRL
8.1.3.1. Business Description
8.1.3.2. Product Portfolio
8.1.3.3. Collaborations & Alliances
8.1.3.4. Recent Developments
8.1.3.5. Financial Details
8.1.3.6. Others
8.1.4.Laboratorio Pfortner Cornealent Sacif
8.1.4.1. Business Description
8.1.4.2. Product Portfolio
8.1.4.3. Collaborations & Alliances
8.1.4.4. Recent Developments
8.1.4.5. Financial Details
8.1.4.6. Others
8.1.5.Augusto Express Visión Lens SA
8.1.5.1. Business Description
8.1.5.2. Product Portfolio
8.1.5.3. Collaborations & Alliances
8.1.5.4. Recent Developments
8.1.5.5. Financial Details
8.1.5.6. Others
9. Disclaimer
| Segment | Sub-Segment |
|---|---|
| By Product Type |
|
| By Usage |
|
| By Material Type |
|
| By Application |
|
| By Sales Channel |
|
| By Pack Size |
|
Research Methodology
This study followed a structured approach comprising four key phases to assess the size and scope of the electro-oxidation market. The process began with thorough secondary research to collect data on the target market, related markets, and broader industry context. These findings, along with preliminary assumptions and estimates, were then validated through extensive primary research involving industry experts from across the value chain. To calculate the overall market size, both top-down and bottom-up methodologies were employed. Finally, market segmentation and data triangulation techniques were applied to refine and validate segment-level estimations.
Secondary Research
The secondary research phase involved gathering data from a wide range of credible and published sources. This step helped in identifying industry trends, defining market segmentation, and understanding the market landscape and value chain.
Sources consulted during this phase included:
- Company annual reports, investor presentations, and press releases
- Industry white papers and certified publications
- Trade directories and market-recognized databases
- Articles from authoritative authors and reputable journals
- Gold and silver standard websites
Secondary research was critical in mapping out the industry's value chain and monetary flow, identifying key market segments, understanding regional variations, and tracking significant industry developments.
Other key sources:
- Financial disclosures
- Industry associations and trade bodies
- News outlets and business magazines
- Academic journals and research studies
- Paid industry databases
Primary Research
To validate secondary data and gain deeper market insights, primary research was conducted with key stakeholders across both the supply and demand sides of the market.
On the demand side, participants included decision-makers and influencers from end-user industries—such as CIOs, CTOs, and CSOs—who provided first-hand perspectives on market needs, product usage, and future expectations.
On the supply side, interviews were conducted with manufacturers, industry associations, and institutional participants to gather insights into current offerings, product pipelines, and market challenges.
Primary interviews provided critical inputs such as:
- Market size and revenue data
- Product and service breakdowns
- Market forecasts
- Regional and application-specific trends
Stakeholders consulted included:
- Leading OEM and solution providers
- Channel and distribution partners
- End users across various applications
- Independent consultants and industry specialists
Market Size Estimation and Data Triangulation
- Identifying Key Market Participants (Secondary Research)
- Goal: To identify the major players or companies in the target market. This typically involves using publicly available data sources such as industry reports, market research publications, and financial statements of companies.
- Tools: Reports from firms like Gartner, Forrester, Euromonitor, Statista, IBISWorld, and others. Public financial statements, news articles, and press releases from top market players.
- Extracting Earnings of Key Market Participants
- Goal: To estimate the earnings generated from the product or service being analyzed. This step helps in understanding the revenue potential of each market player in a specific geography.
- Methods: Earnings data can be gathered from:
- Publicly available financial reports (for listed companies).
- Interviews and primary data sources from professionals, such as Directors, VPs, SVPs, etc. This is especially useful for understanding more nuanced, internal data that isn't publicly disclosed.
- Annual reports and investor presentations of key players.
- Data Collation and Development of a Relevant Data Model
- Goal: To collate inputs from both primary and secondary sources into a structured, data-driven model for market estimation. This model will incorporate key market KPIs and any independent variables relevant to the market.
- Key KPIs: These could include:
- Market size, growth rate, and demand drivers.
- Industry-specific metrics like market share, average revenue per customer (ARPC), or average deal size.
- External variables, such as economic growth rates, inflation rates, or commodity prices, that could affect the market.
- Data Modeling: Based on this data, the market forecasts are developed for the next 5 years. A combination of trend analysis, scenario modeling, and statistical regression might be used to generate projections.
- Scenario Analysis
- Goal: To test different assumptions and validate how sensitive the market is to changes in key variables (e.g., market demand, regulatory changes, technological disruptions).
- Types of Scenarios:
- Base Case: Based on current assumptions and historical data.
- Best-Case Scenario: Assuming favorable market conditions, regulatory environments, and technological advancements.
- Worst-Case Scenario: Accounting for adverse factors, such as economic downturns, stricter regulations, or unexpected disruptions.


