Global Agricultural Chelates Market Report: Trends, Growth and Forecast (2026-2032)
By Chelating Agent (EDTA, EDDHA, DTPA, IDHA, Others), By Micronutrient Type (Iron, Zinc, Manganese, Copper, Others), By Application Mode (Soil Application, Foliar Sprays, Fertigation, Hydroponics, Seed Dressing, Others), By Crop Type (Cereals and Grains, Fruits and Vegetables, Oilseeds and Pulses, Turf and Ornamentals, Others), By Form (Dry, Liquid), By Region (North America, South America, Europe, Middle East and Africa, Asia Pacific) ... Read more
|
Major Players
|
Global Agricultural Chelates Market Statistics and Insights, 2026
- Market Size Statistics
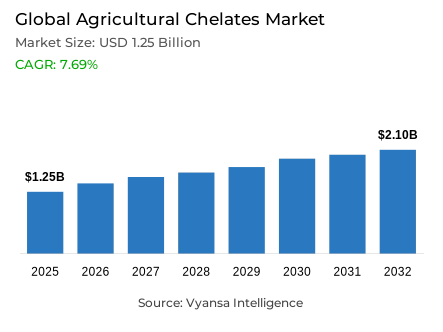
- Agricultural Chelates market size was valued at USD 1.25 billion in 2025 and is estimated at USD 1.41 billion in 2026.
- The market size is expected to grow to USD 2.1 billion by 2032.
- Market to register a CAGR of around 7.69% during 2026-32.
- Chelating Agent Shares
- Edta grabbed market share of 40%.
- Competition
- Global agricultural chelates market is currently being catered to by more than 25 companies.
- Top 5 companies acquired around 35% of the market share.
- Syngenta Biologicals, Haifa Group, COMPO EXPERT GmbH, Nouryon Chemicals Holding B.V., BASF SE etc., are few of the top companies.
- Application Mode
- Soil application grabbed 40% of the market.
- Region
- Asia Pacific leads with a 40% share of the global market.
Global Agricultural Chelates Market Outlook
Global agricultural chelates market covers chelated micronutrient inputs that keep iron, zinc, manganese, copper, calcium, and other trace elements available for crop uptake across soil, foliar, and fertigation systems. The market is valued at USD 1.25 billion in 2025 and USD 1.41 billion in 2026, reaching USD 2.10 billion by 2032 at a CAGR of 7.69%. global agricultural chelates industry demand is anchored in specialty fertilizers, commercial farming, horticulture, and controlled-environment crop nutrition programs worldwide.
Crop nutrient bioavailability is becoming a procurement priority as growers manage high-pH soils, micronutrient lock-up, and yield pressure with more targeted inputs. global agricultural chelates market adoption is strengthened by intensive agriculture, precision crop nutrition, and higher use of water-soluble fertilizers in drip irrigation and foliar nutrition programs. OECD and FAO project global agricultural and fish production to increase 14% over the next decade, mainly through productivity growth, reinforcing demand for efficient nutrient delivery systems.
The economic impact is concentrated in fertilizer formulation, crop-input distribution, and agronomic advisory models that convert micronutrient deficiency correction into higher input efficiency. global agricultural chelates industry suppliers benefit when growers shift from bulk nutrient application toward trace element chelates that support measurable uptake, crop quality, and input stewardship. Stronger nutrient-use discipline also improves procurement visibility for distributors, enabling better SKU planning across chelated fertilizers, liquid blends, and application-specific specialty inputs across seasons.
The 2026 trajectory is defined by formulation efficiency, chelating-agent selection, and regional expansion across high-output farming systems. global agricultural chelates market suppliers are expected to prioritize EDTA chelates, DTPA chelates, EDDHA chelates, biodegradable chelates, and water-soluble agricultural chelates aligned with residue-conscious crop nutrition. global agricultural chelates industry participants that combine product stability, application guidance, and distribution depth are better positioned to capture demand from commercial farms, greenhouse growers, and specialty fertilizer companies.

Global Agricultural Chelates Market Growth Driver
Precision Crop Nutrition is Raising Chelated Micronutrient Adoption
Precision nutrient management is increasing demand for chelated micronutrient fertilizers as growers seek more predictable uptake under intensive cropping, alkaline soils, and fertigation programs. global agricultural chelates market expansion is supported by the need to convert trace element inputs into usable plant nutrition without excessive application rates. global agricultural chelates industry demand therefore moves with agronomic advisory adoption, soil testing, and specialty fertilizer procurement across commercial farms and high-value horticulture worldwide today at scale globally.
OECD and FAO project global cereal production to grow 1.1% annually to 3.2 billion tonnes by 2034, with yield growth of 0.9% annually supported by technology and optimized input use. This productivity pathway strengthens demand for chelated micronutrients because balanced trace element delivery improves crop nutrient bioavailability, reduces deficiency-related yield drag, and supports procurement of water-soluble chelates within broader precision crop nutrition programs and farm-input planning cycles across major producing regions during 2026 procurement planning.
Global Agricultural Chelates Market Challenge
Synthetic Chelate Persistence is Raising Compliance Pressure
Synthetic chelate persistence is tightening scrutiny around legacy EDTA-based formulations, especially where distributors must satisfy crop performance expectations and environmental stewardship requirements at the same time. global agricultural chelates market growth can face procurement friction when buyers weigh strong micronutrient stability against questions on soil mobility, residue management, and compatibility with sustainability-led fertilizer programs. This pressure encourages reformulation, supplier documentation, and clearer use guidance for commercial application across regulated import channels and tenders now.
AICIS reported in 2025 that EDTA chemicals are used in fertilisers, can be released to soils through direct application, and are categorised as persistent in environmental waters and soils. That finding does not remove EDTA demand, but it increases compliance attention for manufacturers and importers, influencing registration reviews, safety documentation, customer training, and the shift toward biodegradable chelates where buyers prioritize lower environmental persistence and stronger market access assurance in specialty fertilizers procurement decisions.
Unlock Market Intelligence
Explore the market potential with our data-driven report
Global Agricultural Chelates Market Trend
Granular Chelated Blends are Reshaping Product Differentiation
Granular and liquid chelated micronutrient blends are shifting supplier competition from single-nutrient correction toward application-ready nutrient efficiency platforms. global agricultural chelates market trends increasingly reflect demand for blends that can be integrated with starter fertilizers, fertigation chelates, and precision crop nutrition schedules. global agricultural chelates industry suppliers are using formulation stability, nutrient compatibility, package convenience, and agronomic service support to differentiate products in distributor-led programs for large farms and intensive horticulture operations worldwide today at scale.
CHS introduced Trivar EZ in August 2024 as a granular ortho-ortho EDDHA chelated micronutrient blend, with Levesol helping micronutrients remain more available to crops and preventing phosphorus from bonding with soil micronutrients. This development signals stronger competitive focus on chelate-enabled nutrient release, supporting adoption where growers want easier handling, measurable availability, fewer compatibility constraints, and stronger performance claims in fertilizer programs across row crops and specialty crops in 2026 purchasing cycles.
Global Agricultural Chelates Market Opportunity
High-Value Crop Nutrition Offers Untapped Demand Capture
High-value horticulture and protected cultivation create an underpenetrated opportunity for suppliers that can bundle micronutrient diagnostics, chelated plant nutrition products, and application guidance. global agricultural chelates market opportunity is strongest where growers face iron chlorosis, zinc deficiency management, poor nutrient mobility, and high pH soil conditions. Specialty fertilizer companies can improve demand capture by offering water-soluble chelates, crop-specific blends, distributor training, and technical support tied to soil testing, tissue analysis, and seasonal crop programs annually.
UF IFAS stated in its 2025 vegetable fertilizer guidance that when soil tests are low or known deficiencies exist, per-acre applications may include 5 lb manganese, 2 lb zinc, 4 lb iron, and 3 lb copper, and it advises chelated iron where ferrous sulfate rapidly oxidizes. This supports targeted chelated micronutrient procurement for vegetable producers managing deficiency correction, crop nutrient bioavailability, input efficiency, and quality-focused production schedules across intensive farming systems worldwide.
Global Agricultural Chelates Market Regional Analysis

By Region
- North America
- South America
- Europe
- Middle East and Africa
- Asia Pacific
Asia Pacific holds 50% share, supported by large crop acreage, intensive rice and horticulture systems, fertilizer distribution density, and persistent micronutrient management needs across China, India, Southeast Asia, Japan, and Australia. global agricultural chelates market demand in the region is strengthened by high-output farming, protected cultivation, and expanding precision crop nutrition. global agricultural chelates industry suppliers also benefit from local blending, import networks, and specialty fertilizer retail channels across diverse farm systems and cropping calendars.
OECD and FAO state that Asian countries will account for 54% of the projected global cereal demand increase, while Asia accounts for 69% of the projected increase in rice consumption. This concentration supports regional demand for agricultural micronutrient chelates because large cereal and rice systems require scalable deficiency correction, soil fertility improvement, and procurement programs that can supply EDTA chelates, iron chelates for agriculture, and zinc chelated fertilizers through established distribution networks.
Unlock Market Intelligence
Explore the market potential with our data-driven report
Global Agricultural Chelates Market Segmentation Analysis
By Chelating Agent
- EDTA
- EDDHA
- DTPA
- IDHA
- Others
EDTA leads under chelating agent with 40% share, supported by broad formulation familiarity, strong metal ion binding, and use across iron, zinc, manganese, and copper micronutrient products. global agricultural chelates market procurement favors EDTA where buyers need stable, water-soluble agricultural chelates for foliar chelated fertilizers and soil-applied micronutrient correction. global agricultural chelates industry suppliers also benefit from established quality specifications, formulation infrastructure, and scalable production know-how across fertilizer supply chains and distributor portfolios worldwide now.
FAO fertilizer specifications list chelated zinc as Zn-EDTA with minimum 12% zinc content and chelated iron as Fe-EDTA with minimum 12% iron content, giving purchasers a clear quality benchmark for EDTA chelated micronutrients. These specifications support product comparability, import documentation, distributor confidence, batch-level testing, and procurement discipline, strengthening EDTA demand where crop input buyers prioritize recognized chelating agents, consistent nutrient guarantees, and reliable technical labeling in commercial tenders and import approvals.

By Application Mode
- Soil Application
- Foliar Sprays
- Fertigation
- Hydroponics
- Seed Dressing
- Others
Soil application holds 40% share under application mode, backed by its fit with deficiency correction programs, basal nutrient placement, and field-scale compatibility across cereals, pulses, vegetables, and orchards. global agricultural chelates market demand for soil application is supported by growers seeking longer contact between chelated micronutrients and the root zone. This mode also aligns with soil testing, starter fertilizer programs, crop residue management, and distributor-led agronomic recommendations across large farm networks and fertilizer dealers globally.
A 2025 rice-based study published in the International Journal of Plant and Soil Science found that combined Fe and Zn application through basal, nutripriming, and biopriming produced the highest DTPA-Fe and DTPA-Zn concentrations across tillering, flowering, and post-harvest stages. That outcome supports soil-linked chelated micronutrient adoption because root-zone availability remains central to crop nutrient bioavailability, deficiency management, and supply planning for field crops in intensive production systems worldwide in 2026 procurement cycles.
Market Players in Global Agricultural Chelates Market
These market players maintain a significant presence in the Global agricultural chelates market and contribute to its ongoing evolution.
- Syngenta Biologicals
- Haifa Group
- COMPO EXPERT GmbH
- Nouryon Chemicals Holding B.V.
- BASF SE
- Dow Inc.
- Yara International ASA
- ICL Group Ltd. (ICL Growing Solutions)
- Van Iperen International B.V.
- Aries Agro Limited
- ROVENSA S.A. (Rovensa Next)
- Deretil Agronutritional S.L.U.
- BMS Micro-Nutrients N.V.
- ATP Nutrition Ltd.
- The Andersons Inc.
Market News & Updates
- Nouryon Chemicals Holding B.V., 2025:
Nouryon achieved ISCC PLUS certification in January 2025 at its Herkenbosch, Netherlands green chelates manufacturing site. The certification covers biobased and bio-circular feedstocks used to produce biodegradable chelates with up to 100% renewable carbon index. The update strengthens Nouryon’s sustainable chelating-agent platform for agriculture and specialty chemical applications.
- Van Iperen International B.V., 2025:
Van Iperen relaunched its latest water-soluble NPK fertilizer catalogue in October 2025, detailing formulas and applications for crop nutrition programs. The company also offers chelated and non-chelated micronutrients in solid and liquid forms. The update supports distributor and grower access to application-ready micronutrient and fertigation solutions.
Frequently Asked Questions
Related Report
- Market Segmentation
- Research Scope
- Research Methodology
- Definitions and Assumptions
- Executive Summary
- Global Agricultural Chelates Market Policies, Regulations, and Standards
- Global Agricultural Chelates Market Dynamics
- Growth Factors
- Challenges
- Trends
- Opportunities
- Global Agricultural Chelates Market Statistics, 2022-2032F
- Market Size & Growth Outlook
- By Revenues in USD Million
- Market Segmentation & Growth Outlook
- By Chelating Agent
- EDTA- Market Insights and Forecast 2022-2032, USD Million
- EDDHA- Market Insights and Forecast 2022-2032, USD Million
- DTPA- Market Insights and Forecast 2022-2032, USD Million
- IDHA- Market Insights and Forecast 2022-2032, USD Million
- Others- Market Insights and Forecast 2022-2032, USD Million
- By Micronutrient Type
- Iron- Market Insights and Forecast 2022-2032, USD Million
- Zinc- Market Insights and Forecast 2022-2032, USD Million
- Manganese- Market Insights and Forecast 2022-2032, USD Million
- Copper- Market Insights and Forecast 2022-2032, USD Million
- Others- Market Insights and Forecast 2022-2032, USD Million
- By Application Mode
- Soil Application- Market Insights and Forecast 2022-2032, USD Million
- Foliar Sprays- Market Insights and Forecast 2022-2032, USD Million
- Fertigation- Market Insights and Forecast 2022-2032, USD Million
- Hydroponics- Market Insights and Forecast 2022-2032, USD Million
- Seed Dressing- Market Insights and Forecast 2022-2032, USD Million
- Others- Market Insights and Forecast 2022-2032, USD Million
- By Crop Type
- Cereals and Grains- Market Insights and Forecast 2022-2032, USD Million
- Fruits and Vegetables- Market Insights and Forecast 2022-2032, USD Million
- Oilseeds and Pulses- Market Insights and Forecast 2022-2032, USD Million
- Turf and Ornamentals- Market Insights and Forecast 2022-2032, USD Million
- Others- Market Insights and Forecast 2022-2032, USD Million
- By Form
- Dry- Market Insights and Forecast 2022-2032, USD Million
- Liquid- Market Insights and Forecast 2022-2032, USD Million
- By Region
- North America
- South America
- Europe
- Middle East and Africa
- Asia Pacific
- By Competitors
- Competition Characteristics
- Market Share & Analysis
- By Chelating Agent
- Market Size & Growth Outlook
- North America Agricultural Chelates Market Statistics, 2022-2032F
- Market Size & Growth Outlook
- By Revenues in USD Million
- Market Segmentation & Growth Outlook
- By Chelating Agent- Market Insights and Forecast 2022-2032, USD Million
- By Micronutrient Type- Market Insights and Forecast 2022-2032, USD Million
- By Application Mode- Market Insights and Forecast 2022-2032, USD Million
- By Crop Type- Market Insights and Forecast 2022-2032, USD Million
- By Form- Market Insights and Forecast 2022-2032, USD Million
- By Country
- The US
- Canada
- Mexico
- Rest of North America
- The US Agricultural Chelates Market Statistics, 2022-2032F
- Market Size & Growth Outlook
- By Revenues in USD Million
- Market Segmentation & Growth Outlook
- By Chelating Agent- Market Insights and Forecast 2022-2032, USD Million
- By Micronutrient Type- Market Insights and Forecast 2022-2032, USD Million
- By Application Mode- Market Insights and Forecast 2022-2032, USD Million
- By Crop Type- Market Insights and Forecast 2022-2032, USD Million
- By Form- Market Insights and Forecast 2022-2032, USD Million
- Market Size & Growth Outlook
- Canada Agricultural Chelates Market Statistics, 2022-2032F
- Market Size & Growth Outlook
- By Revenues in USD Million
- Market Segmentation & Growth Outlook
- By Chelating Agent- Market Insights and Forecast 2022-2032, USD Million
- By Micronutrient Type- Market Insights and Forecast 2022-2032, USD Million
- By Application Mode- Market Insights and Forecast 2022-2032, USD Million
- By Crop Type- Market Insights and Forecast 2022-2032, USD Million
- By Form- Market Insights and Forecast 2022-2032, USD Million
- Market Size & Growth Outlook
- Mexico Agricultural Chelates Market Statistics, 2022-2032F
- Market Size & Growth Outlook
- By Revenues in USD Million
- Market Segmentation & Growth Outlook
- By Chelating Agent- Market Insights and Forecast 2022-2032, USD Million
- By Micronutrient Type- Market Insights and Forecast 2022-2032, USD Million
- By Application Mode- Market Insights and Forecast 2022-2032, USD Million
- By Crop Type- Market Insights and Forecast 2022-2032, USD Million
- By Form- Market Insights and Forecast 2022-2032, USD Million
- Market Size & Growth Outlook
- Market Size & Growth Outlook
- South America Agricultural Chelates Market Statistics, 2022-2032F
- Market Size & Growth Outlook
- By Revenues in USD Million
- Market Segmentation & Growth Outlook
- By Chelating Agent- Market Insights and Forecast 2022-2032, USD Million
- By Micronutrient Type- Market Insights and Forecast 2022-2032, USD Million
- By Application Mode- Market Insights and Forecast 2022-2032, USD Million
- By Crop Type- Market Insights and Forecast 2022-2032, USD Million
- By Form- Market Insights and Forecast 2022-2032, USD Million
- By Country
- Brazil
- Argentina
- Chile
- Rest of South America
- Brazil Agricultural Chelates Market Statistics, 2022-2032F
- Market Size & Growth Outlook
- By Revenues in USD Million
- Market Segmentation & Growth Outlook
- By Chelating Agent- Market Insights and Forecast 2022-2032, USD Million
- By Micronutrient Type- Market Insights and Forecast 2022-2032, USD Million
- By Application Mode- Market Insights and Forecast 2022-2032, USD Million
- By Crop Type- Market Insights and Forecast 2022-2032, USD Million
- By Form- Market Insights and Forecast 2022-2032, USD Million
- Market Size & Growth Outlook
- Argentina Agricultural Chelates Market Statistics, 2022-2032F
- Market Size & Growth Outlook
- By Revenues in USD Million
- Market Segmentation & Growth Outlook
- By Chelating Agent- Market Insights and Forecast 2022-2032, USD Million
- By Micronutrient Type- Market Insights and Forecast 2022-2032, USD Million
- By Application Mode- Market Insights and Forecast 2022-2032, USD Million
- By Crop Type- Market Insights and Forecast 2022-2032, USD Million
- By Form- Market Insights and Forecast 2022-2032, USD Million
- Market Size & Growth Outlook
- Chile Agricultural Chelates Market Statistics, 2022-2032F
- Market Size & Growth Outlook
- By Revenues in USD Million
- Market Segmentation & Growth Outlook
- By Chelating Agent- Market Insights and Forecast 2022-2032, USD Million
- By Micronutrient Type- Market Insights and Forecast 2022-2032, USD Million
- By Application Mode- Market Insights and Forecast 2022-2032, USD Million
- By Crop Type- Market Insights and Forecast 2022-2032, USD Million
- By Form- Market Insights and Forecast 2022-2032, USD Million
- Market Size & Growth Outlook
- Market Size & Growth Outlook
- Europe Agricultural Chelates Market Statistics, 2022-2032F
- Market Size & Growth Outlook
- By Revenues in USD Million
- Market Segmentation & Growth Outlook
- By Chelating Agent- Market Insights and Forecast 2022-2032, USD Million
- By Micronutrient Type- Market Insights and Forecast 2022-2032, USD Million
- By Application Mode- Market Insights and Forecast 2022-2032, USD Million
- By Crop Type- Market Insights and Forecast 2022-2032, USD Million
- By Form- Market Insights and Forecast 2022-2032, USD Million
- By Country
- Germany
- France
- The UK
- Italy
- Spain
- Netherlands
- Russia
- Rest of Europe
- Germany Agricultural Chelates Market Statistics, 2022-2032F
- Market Size & Growth Outlook
- By Revenues in USD Million
- Market Segmentation & Growth Outlook
- By Chelating Agent- Market Insights and Forecast 2022-2032, USD Million
- By Micronutrient Type- Market Insights and Forecast 2022-2032, USD Million
- By Application Mode- Market Insights and Forecast 2022-2032, USD Million
- By Crop Type- Market Insights and Forecast 2022-2032, USD Million
- By Form- Market Insights and Forecast 2022-2032, USD Million
- Market Size & Growth Outlook
- France Agricultural Chelates Market Statistics, 2022-2032F
- Market Size & Growth Outlook
- By Revenues in USD Million
- Market Segmentation & Growth Outlook
- By Chelating Agent- Market Insights and Forecast 2022-2032, USD Million
- By Micronutrient Type- Market Insights and Forecast 2022-2032, USD Million
- By Application Mode- Market Insights and Forecast 2022-2032, USD Million
- By Crop Type- Market Insights and Forecast 2022-2032, USD Million
- By Form- Market Insights and Forecast 2022-2032, USD Million
- Market Size & Growth Outlook
- The UK Agricultural Chelates Market Statistics, 2022-2032F
- Market Size & Growth Outlook
- By Revenues in USD Million
- Market Segmentation & Growth Outlook
- By Chelating Agent- Market Insights and Forecast 2022-2032, USD Million
- By Micronutrient Type- Market Insights and Forecast 2022-2032, USD Million
- By Application Mode- Market Insights and Forecast 2022-2032, USD Million
- By Crop Type- Market Insights and Forecast 2022-2032, USD Million
- By Form- Market Insights and Forecast 2022-2032, USD Million
- Market Size & Growth Outlook
- Italy Agricultural Chelates Market Statistics, 2022-2032F
- Market Size & Growth Outlook
- By Revenues in USD Million
- Market Segmentation & Growth Outlook
- By Chelating Agent- Market Insights and Forecast 2022-2032, USD Million
- By Micronutrient Type- Market Insights and Forecast 2022-2032, USD Million
- By Application Mode- Market Insights and Forecast 2022-2032, USD Million
- By Crop Type- Market Insights and Forecast 2022-2032, USD Million
- By Form- Market Insights and Forecast 2022-2032, USD Million
- Market Size & Growth Outlook
- Spain Agricultural Chelates Market Statistics, 2022-2032F
- Market Size & Growth Outlook
- By Revenues in USD Million
- Market Segmentation & Growth Outlook
- By Chelating Agent- Market Insights and Forecast 2022-2032, USD Million
- By Micronutrient Type- Market Insights and Forecast 2022-2032, USD Million
- By Application Mode- Market Insights and Forecast 2022-2032, USD Million
- By Crop Type- Market Insights and Forecast 2022-2032, USD Million
- By Form- Market Insights and Forecast 2022-2032, USD Million
- Market Size & Growth Outlook
- Netherlands Agricultural Chelates Market Statistics, 2022-2032F
- Market Size & Growth Outlook
- By Revenues in USD Million
- Market Segmentation & Growth Outlook
- By Chelating Agent- Market Insights and Forecast 2022-2032, USD Million
- By Micronutrient Type- Market Insights and Forecast 2022-2032, USD Million
- By Application Mode- Market Insights and Forecast 2022-2032, USD Million
- By Crop Type- Market Insights and Forecast 2022-2032, USD Million
- By Form- Market Insights and Forecast 2022-2032, USD Million
- Market Size & Growth Outlook
- Russia Agricultural Chelates Market Statistics, 2022-2032F
- Market Size & Growth Outlook
- By Revenues in USD Million
- Market Segmentation & Growth Outlook
- By Chelating Agent- Market Insights and Forecast 2022-2032, USD Million
- By Micronutrient Type- Market Insights and Forecast 2022-2032, USD Million
- By Application Mode- Market Insights and Forecast 2022-2032, USD Million
- By Crop Type- Market Insights and Forecast 2022-2032, USD Million
- By Form- Market Insights and Forecast 2022-2032, USD Million
- Market Size & Growth Outlook
- Market Size & Growth Outlook
- Middle East and Africa Agricultural Chelates Market Statistics, 2022-2032F
- Market Size & Growth Outlook
- By Revenues in USD Million
- Market Segmentation & Growth Outlook
- By Chelating Agent- Market Insights and Forecast 2022-2032, USD Million
- By Micronutrient Type- Market Insights and Forecast 2022-2032, USD Million
- By Application Mode- Market Insights and Forecast 2022-2032, USD Million
- By Crop Type- Market Insights and Forecast 2022-2032, USD Million
- By Form- Market Insights and Forecast 2022-2032, USD Million
- By Country
- Saudi Arabia
- The UAE
- South Africa
- Egypt
- Rest of Middle East and Africa
- Saudi Arabia Agricultural Chelates Market Statistics, 2022-2032F
- Market Size & Growth Outlook
- By Revenues in USD Million
- Market Segmentation & Growth Outlook
- By Chelating Agent- Market Insights and Forecast 2022-2032, USD Million
- By Micronutrient Type- Market Insights and Forecast 2022-2032, USD Million
- By Application Mode- Market Insights and Forecast 2022-2032, USD Million
- By Crop Type- Market Insights and Forecast 2022-2032, USD Million
- By Form- Market Insights and Forecast 2022-2032, USD Million
- Market Size & Growth Outlook
- The UAE Agricultural Chelates Market Statistics, 2022-2032F
- Market Size & Growth Outlook
- By Revenues in USD Million
- Market Segmentation & Growth Outlook
- By Chelating Agent- Market Insights and Forecast 2022-2032, USD Million
- By Micronutrient Type- Market Insights and Forecast 2022-2032, USD Million
- By Application Mode- Market Insights and Forecast 2022-2032, USD Million
- By Crop Type- Market Insights and Forecast 2022-2032, USD Million
- By Form- Market Insights and Forecast 2022-2032, USD Million
- Market Size & Growth Outlook
- South Africa Agricultural Chelates Market Statistics, 2022-2032F
- Market Size & Growth Outlook
- By Revenues in USD Million
- Market Segmentation & Growth Outlook
- By Chelating Agent- Market Insights and Forecast 2022-2032, USD Million
- By Micronutrient Type- Market Insights and Forecast 2022-2032, USD Million
- By Application Mode- Market Insights and Forecast 2022-2032, USD Million
- By Crop Type- Market Insights and Forecast 2022-2032, USD Million
- By Form- Market Insights and Forecast 2022-2032, USD Million
- Market Size & Growth Outlook
- Egypt Agricultural Chelates Market Statistics, 2022-2032F
- Market Size & Growth Outlook
- By Revenues in USD Million
- Market Segmentation & Growth Outlook
- By Chelating Agent- Market Insights and Forecast 2022-2032, USD Million
- By Micronutrient Type- Market Insights and Forecast 2022-2032, USD Million
- By Application Mode- Market Insights and Forecast 2022-2032, USD Million
- By Crop Type- Market Insights and Forecast 2022-2032, USD Million
- By Form- Market Insights and Forecast 2022-2032, USD Million
- Market Size & Growth Outlook
- Market Size & Growth Outlook
- Asia Pacific Agricultural Chelates Market Statistics, 2022-2032F
- Market Size & Growth Outlook
- By Revenues in USD Million
- Market Segmentation & Growth Outlook
- By Chelating Agent- Market Insights and Forecast 2022-2032, USD Million
- By Micronutrient Type- Market Insights and Forecast 2022-2032, USD Million
- By Application Mode- Market Insights and Forecast 2022-2032, USD Million
- By Crop Type- Market Insights and Forecast 2022-2032, USD Million
- By Form- Market Insights and Forecast 2022-2032, USD Million
- By Country
- China
- India
- Japan
- South Korea
- Australia
- Thailand
- Rest of Asia Pacific
- China Agricultural Chelates Market Statistics, 2022-2032F
- Market Size & Growth Outlook
- By Revenues in USD Million
- Market Segmentation & Growth Outlook
- By Chelating Agent- Market Insights and Forecast 2022-2032, USD Million
- By Micronutrient Type- Market Insights and Forecast 2022-2032, USD Million
- By Application Mode- Market Insights and Forecast 2022-2032, USD Million
- By Crop Type- Market Insights and Forecast 2022-2032, USD Million
- By Form- Market Insights and Forecast 2022-2032, USD Million
- Market Size & Growth Outlook
- India Agricultural Chelates Market Statistics, 2022-2032F
- Market Size & Growth Outlook
- By Revenues in USD Million
- Market Segmentation & Growth Outlook
- By Chelating Agent- Market Insights and Forecast 2022-2032, USD Million
- By Micronutrient Type- Market Insights and Forecast 2022-2032, USD Million
- By Application Mode- Market Insights and Forecast 2022-2032, USD Million
- By Crop Type- Market Insights and Forecast 2022-2032, USD Million
- By Form- Market Insights and Forecast 2022-2032, USD Million
- Market Size & Growth Outlook
- Japan Agricultural Chelates Market Statistics, 2022-2032F
- Market Size & Growth Outlook
- By Revenues in USD Million
- Market Segmentation & Growth Outlook
- By Chelating Agent- Market Insights and Forecast 2022-2032, USD Million
- By Micronutrient Type- Market Insights and Forecast 2022-2032, USD Million
- By Application Mode- Market Insights and Forecast 2022-2032, USD Million
- By Crop Type- Market Insights and Forecast 2022-2032, USD Million
- By Form- Market Insights and Forecast 2022-2032, USD Million
- Market Size & Growth Outlook
- South Korea Agricultural Chelates Market Statistics, 2022-2032F
- Market Size & Growth Outlook
- By Revenues in USD Million
- Market Segmentation & Growth Outlook
- By Chelating Agent- Market Insights and Forecast 2022-2032, USD Million
- By Micronutrient Type- Market Insights and Forecast 2022-2032, USD Million
- By Application Mode- Market Insights and Forecast 2022-2032, USD Million
- By Crop Type- Market Insights and Forecast 2022-2032, USD Million
- By Form- Market Insights and Forecast 2022-2032, USD Million
- Market Size & Growth Outlook
- Australia Agricultural Chelates Market Statistics, 2022-2032F
- Market Size & Growth Outlook
- By Revenues in USD Million
- Market Segmentation & Growth Outlook
- By Chelating Agent- Market Insights and Forecast 2022-2032, USD Million
- By Micronutrient Type- Market Insights and Forecast 2022-2032, USD Million
- By Application Mode- Market Insights and Forecast 2022-2032, USD Million
- By Crop Type- Market Insights and Forecast 2022-2032, USD Million
- By Form- Market Insights and Forecast 2022-2032, USD Million
- Market Size & Growth Outlook
- Thailand Agricultural Chelates Market Statistics, 2022-2032F
- Market Size & Growth Outlook
- By Revenues in USD Million
- Market Segmentation & Growth Outlook
- By Chelating Agent- Market Insights and Forecast 2022-2032, USD Million
- By Micronutrient Type- Market Insights and Forecast 2022-2032, USD Million
- By Application Mode- Market Insights and Forecast 2022-2032, USD Million
- By Crop Type- Market Insights and Forecast 2022-2032, USD Million
- By Form- Market Insights and Forecast 2022-2032, USD Million
- Market Size & Growth Outlook
- Market Size & Growth Outlook
- Competitive Outlook
- Company Profiles
- Nouryon Chemicals Holding B.V.
- Business Description
- Product Portfolio
- Collaborations & Alliances
- Recent Developments
- Financial Details
- Others
- BASF SE
- Business Description
- Product Portfolio
- Collaborations & Alliances
- Recent Developments
- Financial Details
- Others
- Dow Inc.
- Business Description
- Product Portfolio
- Collaborations & Alliances
- Recent Developments
- Financial Details
- Others
- Yara International ASA
- Business Description
- Product Portfolio
- Collaborations & Alliances
- Recent Developments
- Financial Details
- Others
- ICL Group Ltd. (ICL Growing Solutions)
- Business Description
- Product Portfolio
- Collaborations & Alliances
- Recent Developments
- Financial Details
- Others
- Syngenta Biologicals
- Business Description
- Product Portfolio
- Collaborations & Alliances
- Recent Developments
- Financial Details
- Others
- Haifa Group
- Business Description
- Product Portfolio
- Collaborations & Alliances
- Recent Developments
- Financial Details
- Others
- COMPO EXPERT GmbH
- Business Description
- Product Portfolio
- Collaborations & Alliances
- Recent Developments
- Financial Details
- Others
- Van Iperen International B.V.
- Business Description
- Product Portfolio
- Collaborations & Alliances
- Recent Developments
- Financial Details
- Others
- Aries Agro Limited
- Business Description
- Product Portfolio
- Collaborations & Alliances
- Recent Developments
- Financial Details
- Others
- ROVENSA S.A. (Rovensa Next)
- Business Description
- Product Portfolio
- Collaborations & Alliances
- Recent Developments
- Financial Details
- Others
- Deretil Agronutritional S.L.U.
- Business Description
- Product Portfolio
- Collaborations & Alliances
- Recent Developments
- Financial Details
- Others
- BMS Micro-Nutrients N.V.
- Business Description
- Product Portfolio
- Collaborations & Alliances
- Recent Developments
- Financial Details
- Others
- ATP Nutrition Ltd.
- Business Description
- Product Portfolio
- Collaborations & Alliances
- Recent Developments
- Financial Details
- Others
- The Andersons Inc.
- Business Description
- Product Portfolio
- Collaborations & Alliances
- Recent Developments
- Financial Details
- Others
- Nouryon Chemicals Holding B.V.
- Company Profiles
- Disclaimer
| Segment | Sub-Segment |
|---|---|
| By Chelating Agent |
|
| By Micronutrient Type |
|
| By Application Mode |
|
| By Crop Type |
|
| By Form |
|
| By Region |
|
Research Methodology
This study followed a structured approach comprising four key phases to assess the size and scope of the electro-oxidation market. The process began with thorough secondary research to collect data on the target market, related markets, and broader industry context. These findings, along with preliminary assumptions and estimates, were then validated through extensive primary research involving industry experts from across the value chain. To calculate the overall market size, both top-down and bottom-up methodologies were employed. Finally, market segmentation and data triangulation techniques were applied to refine and validate segment-level estimations.
Secondary Research
The secondary research phase involved gathering data from a wide range of credible and published sources. This step helped in identifying industry trends, defining market segmentation, and understanding the market landscape and value chain.
Sources consulted during this phase included:
- Company annual reports, investor presentations, and press releases
- Industry white papers and certified publications
- Trade directories and market-recognized databases
- Articles from authoritative authors and reputable journals
- Gold and silver standard websites
Secondary research was critical in mapping out the industry's value chain and monetary flow, identifying key market segments, understanding regional variations, and tracking significant industry developments.
Other key sources:
- Financial disclosures
- Industry associations and trade bodies
- News outlets and business magazines
- Academic journals and research studies
- Paid industry databases
Primary Research
To validate secondary data and gain deeper market insights, primary research was conducted with key stakeholders across both the supply and demand sides of the market.
On the demand side, participants included decision-makers and influencers from end-user industries—such as CIOs, CTOs, and CSOs—who provided first-hand perspectives on market needs, product usage, and future expectations.
On the supply side, interviews were conducted with manufacturers, industry associations, and institutional participants to gather insights into current offerings, product pipelines, and market challenges.
Primary interviews provided critical inputs such as:
- Market size and revenue data
- Product and service breakdowns
- Market forecasts
- Regional and application-specific trends
Stakeholders consulted included:
- Leading OEM and solution providers
- Channel and distribution partners
- End users across various applications
- Independent consultants and industry specialists
Market Size Estimation and Data Triangulation
- Identifying Key Market Participants (Secondary Research)
- Goal: To identify the major players or companies in the target market. This typically involves using publicly available data sources such as industry reports, market research publications, and financial statements of companies.
- Tools: Reports from firms like Gartner, Forrester, Euromonitor, Statista, IBISWorld, and others. Public financial statements, news articles, and press releases from top market players.
- Extracting Earnings of Key Market Participants
- Goal: To estimate the earnings generated from the product or service being analyzed. This step helps in understanding the revenue potential of each market player in a specific geography.
- Methods: Earnings data can be gathered from:
- Publicly available financial reports (for listed companies).
- Interviews and primary data sources from professionals, such as Directors, VPs, SVPs, etc. This is especially useful for understanding more nuanced, internal data that isn't publicly disclosed.
- Annual reports and investor presentations of key players.
- Data Collation and Development of a Relevant Data Model
- Goal: To collate inputs from both primary and secondary sources into a structured, data-driven model for market estimation. This model will incorporate key market KPIs and any independent variables relevant to the market.
- Key KPIs: These could include:
- Market size, growth rate, and demand drivers.
- Industry-specific metrics like market share, average revenue per customer (ARPC), or average deal size.
- External variables, such as economic growth rates, inflation rates, or commodity prices, that could affect the market.
- Data Modeling: Based on this data, the market forecasts are developed for the next 5 years. A combination of trend analysis, scenario modeling, and statistical regression might be used to generate projections.
- Scenario Analysis
- Goal: To test different assumptions and validate how sensitive the market is to changes in key variables (e.g., market demand, regulatory changes, technological disruptions).
- Types of Scenarios:
- Base Case: Based on current assumptions and historical data.
- Best-Case Scenario: Assuming favorable market conditions, regulatory environments, and technological advancements.
- Worst-Case Scenario: Accounting for adverse factors, such as economic downturns, stricter regulations, or unexpected disruptions.


