Global ADAS Simulation Market Report: Trends, Growth and Forecast (2026-2032)
By Simulation Type (Software-in-the-Loop (SiL), Hardware-in-the-Loop (HiL), Driver-in-the-Loop (DiL), Model-in-the-Loop (MiL)), By Offering (Software, Services), By Vehicle Type (Passenger Cars, Commercial Vehicles, Autonomous Vehicles), By Level of Autonomy (Level 1, Level 2/2+, Level 3, Level 4 & 5), By Application (Autonomous Emergency Braking (AEB), Adaptive Cruise Control (ACC), Lane Departure Warning (LDW) & Lane Keeping Assist (LKA), Traffic Sign Recognition (TSR), Blind Spot Detection (BSD), Parking Assistance, Automated Parking Assist, Other Advanced Safety Functions), By End-User (Automotive OEMs, Tier-1 Suppliers, R&D Institutes/Startups, Others), By Region (North America, South America, Europe, Middle East & Africa, Asia Pacific) ... Read more
|
Major Players
|
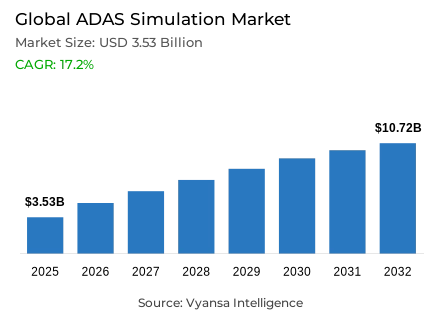
Global ADAS Simulation Market Statistics and Insights, 2026
- Market Size Statistics
- ADAS Simulation market size was valued at USD 3.53 billion in 2025 and is estimated at USD 4.76 billion in 2026.
- The market size is expected to grow to USD 10.72 billion by 2032.
- Market to register a CAGR of around 17.2% during 2026-32.
- Offering Shares
- Software grabbed market share of 70%.
- Competition
- Global adas simulation market is currently being catered to by more than 25 companies.
- Top 5 companies acquired around 35% of the market share.
- Applied Intuition Inc., The MathWorks Inc., Vector Informatik GmbH, Siemens AG, ANSYS Inc. etc., are few of the top companies.
- Vehicle Type
- Passenger cars grabbed 65% of the market.
- Region
- Asia Pacific leads with a 40% share of the global market.
Global ADAS Simulation Market Outlook
The ADAS simulation market is valued at USD 3.53 billion in 2025 and is projected to reach USD 10.72 billion by 2032, increasing from USD 4.76 billion in 2026 at a CAGR of 17.2% during 2026-2032. It covers virtual validation, scenario generation, sensor fusion simulation, hardware-in-the-loop simulation, software-in-the-loop simulation, and digital twin simulation used by OEMs, Tier 1 suppliers, testing labs, and autonomous mobility developers. The Global ADAS Simulation Industry supports safety engineering by reducing dependence on physical prototypes.
Regulatory pressure, software-defined vehicle architectures, and rising ADAS content are shifting validation from track-heavy testing toward repeatable virtual ADAS testing. According to NHTSA, the updated 5-Star Safety Ratings program incorporates new advanced driver assistance technologies and a 10-year roadmap, while Euro NCAP’s 2026 approach increases attention to driver monitoring reliability and real-time behaviour assessment. These rules expand regulatory ADAS testing requirements and strengthen demand for traceable simulation workflows across programs.
The ADAS simulation market improves development economics by compressing validation cycles, increasing scenario coverage, and enabling earlier defect detection before hardware release. Automotive simulation software also supports procurement visibility because platforms can be evaluated against sensor realism, scenario library depth, coverage metrics, and integration readiness. For Global ADAS Simulation Industry participants, this shifts competition toward model fidelity, automated test generation, compliance documentation, and scalable cloud-based simulation capacity across global engineering centers.
The 2026 trajectory is shaped by simulation-first validation, synthetic data pipelines, and standardised scenario languages. ASAM released OpenSCENARIO DSL 2.2.0 in March 2026 for simulation, X-in-the-loop, and proving-ground workflows, strengthening interoperability across ADAS validation software ecosystems. As OEMs increase software release frequency, the ADAS simulation market forecast increasingly depends on platform openness, sensor model accuracy, automated scenario generation, and supplier ability to support multi-region homologation programs. This keeps investment focused on validation depth, workflow automation, and scalable engineering productivity.

Global ADAS Simulation Market Growth Driver
Safety Mandates Push Virtual Validation into Core Engineering
Mandatory active-safety performance is expanding validation workloads as OEMs must prove ADAS behavior across higher speeds, pedestrian scenarios, night conditions, and mixed traffic interactions. This strengthens the ADAS simulation market by making scenario-based ADAS testing a core engineering requirement rather than an optional development aid. The Global ADAS Simulation Industry gains from demand for repeatable edge-case libraries, virtual proving grounds, and automated regression testing across software updates.
NHTSA reported that FMVSS No. 127 will require AEB and pedestrian AEB as standard on all passenger cars and light trucks by September 2029, with the rule projected to save at least 360 lives and prevent at least 24,000 injuries annually. That compliance pathway supports procurement of ADAS validation software, sensor models, and closed-loop simulation platforms capable of documenting system performance before certification and launch. It also raises demand for auditable test coverage across OEM and Tier 1 engineering teams worldwide.
Global ADAS Simulation Market Challenge
Sensor Fidelity and Toolchain Integration Slow Procurement
Sensor realism and simulation-to-reality transfer remain major bottlenecks as radar, camera, LiDAR, vehicle dynamics, weather, lighting, and traffic behavior must align with physical performance. The ADAS simulation market faces procurement scrutiny when virtual outputs cannot be trusted for safety sign-off. The Global ADAS Simulation Industry must therefore invest in validated sensor models, calibrated datasets, and traceable toolchains that reduce certification risk. These limits can delay platform standardization across global engineering teams and regional test programs.
dSPACE reported in March 2025 that NXP India uses a Compact 3D radar test bench for multi-target, multi-angle ADAS testing, including up to 20 radar objects in real time and support for 24-, 60-, and 77-GHz radar devices. This level of hardware and calibration complexity increases implementation cost, integration workload, and specialist skill requirements for simulation buyers. Vendors that cannot provide reproducible evidence across laboratory and virtual environments risk slower qualification in safety-critical procurement cycles.
Unlock Market Intelligence
Explore the market potential with our data-driven report
Global ADAS Simulation Market Trend
World Models and Synthetic Scenes Redefine Validation Workflows
Synthetic data generation is reshaping virtual validation as software-defined vehicles require broader corner-case coverage than road testing can economically deliver. The ADAS simulation market is moving toward physically based world models, neural reconstruction, and automated scenario expansion. This changes market trends substantially by raising buyer interest in scalable pipelines that link recorded driving data, simulation assets, and perception-stack validation. The sector is consequently becoming more data-intensive, model-centric, and platform-led across engineering delivery teams.
NVIDIA stated in June 2025 that Cosmos world foundation models can be adapted for autonomous vehicle workflows, with Cosmos Transfer generating driving videos from HD maps, LiDAR depth, and prompts. Its AV simulator materials also describe NuRec and Cosmos Transfer integration with CARLA for scalable synthetic data generation. This strengthens competitive positioning for suppliers offering autonomous vehicle simulation with high-fidelity, reusable scene variation. Open tool integration further improves validation reuse across distributed automotive engineering organizations and teams.
Global ADAS Simulation Market Opportunity
Scenario Standardisation Opens Scalable Platform Demand
Standardised scenario libraries create an underpenetrated opportunity for vendors that can combine regulatory templates, ODD coverage, and reusable test assets. The ADAS simulation market can capture higher value when platforms support scenario-based ADAS testing across software releases, proving grounds, and X-in-the-loop environments. The Global ADAS Simulation Industry also benefits from demand for interoperable formats that lower switching friction for OEMs and Tier suppliers. This improves repeatability and reduces duplicated validation effort across teams.
ASAM lists OpenSCENARIO DSL 2.2.0, released on 19 March 2026, with application areas covering simulation, X-in-the-loop, and proving grounds, and describes the standard as designed for large-scale verification and validation of ADAS and automated driving. This gives automotive simulation software providers scope to build certified scenario packages, conversion tools, and compliance-ready workflows for multi-region engineering programs. Suppliers with strong standards expertise can improve demand capture by helping clients move from fragmented project testing toward governed validation libraries.
Global ADAS Simulation Market Regional Analysis

By Region
- North America
- South America
- Europe
- Middle East & Africa
- Asia Pacific
Asia Pacific leads regionally with 40% share, supported by concentrated vehicle production, fast EV adoption, and dense OEM software development activity in China, Japan, South Korea, and India. The ADAS simulation market benefits from this scale because suppliers can serve large engineering programs requiring localised traffic scenarios, NCAP alignment, perception tuning, and rapid software release validation across multiple vehicle platforms. This also strengthens simulation-sector outlook globally by concentrating procurement near sensor, ECU, and software engineering hubs globally.
ACEA reported that China held a 35.4% share of global car production in 2024, while its car sales reached nearly 23 million units and accounted for 31% of global car sales. This manufacturing and demand base strengthens the Global ADAS Simulation Industry by increasing regional need for scenario libraries, local road-data modelling, and validation support for intelligent electric vehicles. Local deployment intensity also improves supplier visibility and partner access across regional validation programs.
Unlock Market Intelligence
Explore the market potential with our data-driven report
Global ADAS Simulation Market Segmentation Analysis
By Offering
- Software
- Services
Software leads by offering because validation value is concentrated in scenario generation, virtual proving grounds, sensor models, analytics dashboards, and automated regression workflows. Software holds 70% share, supported by OEM preference for scalable licenses that can be deployed across distributed engineering teams. The ADAS simulation market gains from software-led buying because updates, model libraries, and cloud execution capacity can be expanded faster than physical test infrastructure. This supports simulation-led market growth through modular upgrades and recurring validation demand across vehicle programs worldwide today.
NVIDIA’s autonomous vehicle simulation platform describes virtual environments, synthetic data generation, Cosmos world foundation models, Omniverse NuRec, Asset Harvester, and AlpaSim as tools for building and validating autonomous vehicle systems. That software stack illustrates how ADAS validation software suppliers can bundle scene creation, replay, scoring, and closed-loop testing. It strengthens the industry for global launch programs by shifting procurement toward integrated toolchains rather than isolated simulators.

By Vehicle Type
- Passenger Cars
- Commercial Vehicles
- Autonomous Vehicles
Passenger cars dominate by vehicle type because ADAS functions are increasingly integrated into high-volume private mobility platforms before expanding across commercial fleets. Passenger Cars hold 65% share, reflecting stronger fit with lane keeping, adaptive cruise control, AEB, parking assist, and driver monitoring requirements. The ADAS simulation market benefits as OEMs validate model-year updates across diverse passenger platforms, trims, sensor packages, and regional safety protocols. This supports simulation demand across firms for scalable test orchestration across cameras, radars, driver monitoring, and control logic integration.
Volkswagen Group reported in April 2025 that a quarter of all newly registered vehicles in China already use a Level 2 highway driving system. This passenger-vehicle adoption base increases demand for simulation-based validation because each software release must be tested across highway, urban, camera, radar, and map-dependent operating conditions. The Global ADAS Simulation Industry therefore gains stronger demand from high-volume vehicle programs with recurring software validation needs.
Market Players in Global ADAS Simulation Market
These market players maintain a significant presence in the Global adas simulation market and contribute to its ongoing evolution.
- Applied Intuition Inc.
- The MathWorks Inc.
- Vector Informatik GmbH
- Siemens AG
- ANSYS Inc.
- NVIDIA Corporation
- dSPACE GmbH
- IPG Automotive GmbH
- Keysight Technologies
- Dassault Systèmes SE
- rFpro Ltd.
- ESI Group
- Foretellix Ltd.
- AVL List GmbH
- Cognata Ltd.
Market News & Updates
- Applied Intuition Inc., 2026:
Applied Intuition detailed how its Development Platform connects data, simulation, and triage for active safety development. The platform supports KPI tracking, scenario analysis, simulation workflows, and safety-development feedback loops. The update expands Applied Intuition’s ADAS simulation and validation support for OEM and Tier-1 active safety programs.
- Foretellix Ltd., 2025:
Foretellix and Inverted AI announced a scenario-based testing integration. The combined workflow adds realistic AI-driven agent behaviors to Foretellix’s validation environment for scalable simulation of automated driving systems. The update expands ADAS and automated-driving simulation capability around targeted scenario generation, behavior modelling, and validation coverage.
Frequently Asked Questions
Related Report
- Market Segmentation
- Research Scope
- Research Methodology
- Definitions and Assumptions
- Executive Summary
- Global ADAS Simulation Market Policies, Regulations, and Standards
- Global ADAS Simulation Market Dynamics
- Growth Factors
- Challenges
- Trends
- Opportunities
- Global ADAS Simulation Market Statistics, 2022-2032F
- Market Size & Growth Outlook
- By Revenues in USD Million
- Market Segmentation & Growth Outlook
- By Simulation Type
- Software-in-the-Loop (SiL)- Market Insights and Forecast 2022-2032, USD Million
- Hardware-in-the-Loop (HiL)- Market Insights and Forecast 2022-2032, USD Million
- Driver-in-the-Loop (DiL)- Market Insights and Forecast 2022-2032, USD Million
- Model-in-the-Loop (MiL)- Market Insights and Forecast 2022-2032, USD Million
- By Offering
- Software- Market Insights and Forecast 2022-2032, USD Million
- Services- Market Insights and Forecast 2022-2032, USD Million
- By Vehicle Type
- Passenger Cars- Market Insights and Forecast 2022-2032, USD Million
- Commercial Vehicles- Market Insights and Forecast 2022-2032, USD Million
- Autonomous Vehicles- Market Insights and Forecast 2022-2032, USD Million
- By Level of Autonomy
- Level 1- Market Insights and Forecast 2022-2032, USD Million
- Level 2/2+- Market Insights and Forecast 2022-2032, USD Million
- Level 3- Market Insights and Forecast 2022-2032, USD Million
- Level 4 & 5- Market Insights and Forecast 2022-2032, USD Million
- By Application
- Autonomous Emergency Braking (AEB)- Market Insights and Forecast 2022-2032, USD Million
- Adaptive Cruise Control (ACC)- Market Insights and Forecast 2022-2032, USD Million
- Lane Departure Warning (LDW) & Lane Keeping Assist (LKA)- Market Insights and Forecast 2022-2032, USD Million
- Traffic Sign Recognition (TSR)- Market Insights and Forecast 2022-2032, USD Million
- Blind Spot Detection (BSD)- Market Insights and Forecast 2022-2032, USD Million
- Parking Assistance- Market Insights and Forecast 2022-2032, USD Million
- Automated Parking Assist- Market Insights and Forecast 2022-2032, USD Million
- Other Advanced Safety Functions- Market Insights and Forecast 2022-2032, USD Million
- By End-User
- Automotive OEMs- Market Insights and Forecast 2022-2032, USD Million
- Tier-1 Suppliers- Market Insights and Forecast 2022-2032, USD Million
- R&D Institutes/Startups- Market Insights and Forecast 2022-2032, USD Million
- Others- Market Insights and Forecast 2022-2032, USD Million
- By Region
- North America
- South America
- Europe
- Middle East & Africa
- Asia Pacific
- By Competitors
- Competition Characteristics
- Market Share & Analysis
- By Simulation Type
- Market Size & Growth Outlook
- North America ADAS Simulation Market Statistics, 2022-2032F
- Market Size & Growth Outlook
- By Revenues in USD Million
- Market Segmentation & Growth Outlook
- By Simulation Type- Market Insights and Forecast 2022-2032, USD Million
- By Offering- Market Insights and Forecast 2022-2032, USD Million
- By Vehicle Type- Market Insights and Forecast 2022-2032, USD Million
- By Level of Autonomy- Market Insights and Forecast 2022-2032, USD Million
- By Application- Market Insights and Forecast 2022-2032, USD Million
- By End-User- Market Insights and Forecast 2022-2032, USD Million
- By Country
- The US
- Canada
- Mexico
- Rest of North America
- The US ADAS Simulation Market Statistics, 2022-2032F
- Market Size & Growth Outlook
- By Revenues in USD Million
- Market Segmentation & Growth Outlook
- By Simulation Type- Market Insights and Forecast 2022-2032, USD Million
- By Offering- Market Insights and Forecast 2022-2032, USD Million
- By Vehicle Type- Market Insights and Forecast 2022-2032, USD Million
- By Level of Autonomy- Market Insights and Forecast 2022-2032, USD Million
- By Application- Market Insights and Forecast 2022-2032, USD Million
- By End-User- Market Insights and Forecast 2022-2032, USD Million
- Market Size & Growth Outlook
- Canada ADAS Simulation Market Statistics, 2022-2032F
- Market Size & Growth Outlook
- By Revenues in USD Million
- Market Segmentation & Growth Outlook
- By Simulation Type- Market Insights and Forecast 2022-2032, USD Million
- By Offering- Market Insights and Forecast 2022-2032, USD Million
- By Vehicle Type- Market Insights and Forecast 2022-2032, USD Million
- By Level of Autonomy- Market Insights and Forecast 2022-2032, USD Million
- By Application- Market Insights and Forecast 2022-2032, USD Million
- By End-User- Market Insights and Forecast 2022-2032, USD Million
- Market Size & Growth Outlook
- Mexico ADAS Simulation Market Statistics, 2022-2032F
- Market Size & Growth Outlook
- By Revenues in USD Million
- Market Segmentation & Growth Outlook
- By Simulation Type- Market Insights and Forecast 2022-2032, USD Million
- By Offering- Market Insights and Forecast 2022-2032, USD Million
- By Vehicle Type- Market Insights and Forecast 2022-2032, USD Million
- By Level of Autonomy- Market Insights and Forecast 2022-2032, USD Million
- By Application- Market Insights and Forecast 2022-2032, USD Million
- By End-User- Market Insights and Forecast 2022-2032, USD Million
- Market Size & Growth Outlook
- Market Size & Growth Outlook
- South America ADAS Simulation Market Statistics, 2022-2032F
- Market Size & Growth Outlook
- By Revenues in USD Million
- Market Segmentation & Growth Outlook
- By Simulation Type- Market Insights and Forecast 2022-2032, USD Million
- By Offering- Market Insights and Forecast 2022-2032, USD Million
- By Vehicle Type- Market Insights and Forecast 2022-2032, USD Million
- By Level of Autonomy- Market Insights and Forecast 2022-2032, USD Million
- By Application- Market Insights and Forecast 2022-2032, USD Million
- By End-User- Market Insights and Forecast 2022-2032, USD Million
- By Country
- Brazil
- Argentina
- Rest of South America
- Brazil ADAS Simulation Market Statistics, 2022-2032F
- Market Size & Growth Outlook
- By Revenues in USD Million
- Market Segmentation & Growth Outlook
- By Simulation Type- Market Insights and Forecast 2022-2032, USD Million
- By Offering- Market Insights and Forecast 2022-2032, USD Million
- By Vehicle Type- Market Insights and Forecast 2022-2032, USD Million
- By Level of Autonomy- Market Insights and Forecast 2022-2032, USD Million
- By Application- Market Insights and Forecast 2022-2032, USD Million
- By End-User- Market Insights and Forecast 2022-2032, USD Million
- Market Size & Growth Outlook
- Argentina ADAS Simulation Market Statistics, 2022-2032F
- Market Size & Growth Outlook
- By Revenues in USD Million
- Market Segmentation & Growth Outlook
- By Simulation Type- Market Insights and Forecast 2022-2032, USD Million
- By Offering- Market Insights and Forecast 2022-2032, USD Million
- By Vehicle Type- Market Insights and Forecast 2022-2032, USD Million
- By Level of Autonomy- Market Insights and Forecast 2022-2032, USD Million
- By Application- Market Insights and Forecast 2022-2032, USD Million
- By End-User- Market Insights and Forecast 2022-2032, USD Million
- Market Size & Growth Outlook
- Market Size & Growth Outlook
- Europe ADAS Simulation Market Statistics, 2022-2032F
- Market Size & Growth Outlook
- By Revenues in USD Million
- Market Segmentation & Growth Outlook
- By Simulation Type- Market Insights and Forecast 2022-2032, USD Million
- By Offering- Market Insights and Forecast 2022-2032, USD Million
- By Vehicle Type- Market Insights and Forecast 2022-2032, USD Million
- By Level of Autonomy- Market Insights and Forecast 2022-2032, USD Million
- By Application- Market Insights and Forecast 2022-2032, USD Million
- By End-User- Market Insights and Forecast 2022-2032, USD Million
- By Country
- The UK
- Italy
- Germany
- France
- Spain
- Benelux
- Rest of Europe
- The UK ADAS Simulation Market Statistics, 2022-2032F
- Market Size & Growth Outlook
- By Revenues in USD Million
- Market Segmentation & Growth Outlook
- By Simulation Type- Market Insights and Forecast 2022-2032, USD Million
- By Offering- Market Insights and Forecast 2022-2032, USD Million
- By Vehicle Type- Market Insights and Forecast 2022-2032, USD Million
- By Level of Autonomy- Market Insights and Forecast 2022-2032, USD Million
- By Application- Market Insights and Forecast 2022-2032, USD Million
- By End-User- Market Insights and Forecast 2022-2032, USD Million
- Market Size & Growth Outlook
- Italy ADAS Simulation Market Statistics, 2022-2032F
- Market Size & Growth Outlook
- By Revenues in USD Million
- Market Segmentation & Growth Outlook
- By Simulation Type- Market Insights and Forecast 2022-2032, USD Million
- By Offering- Market Insights and Forecast 2022-2032, USD Million
- By Vehicle Type- Market Insights and Forecast 2022-2032, USD Million
- By Level of Autonomy- Market Insights and Forecast 2022-2032, USD Million
- By Application- Market Insights and Forecast 2022-2032, USD Million
- By End-User- Market Insights and Forecast 2022-2032, USD Million
- Market Size & Growth Outlook
- Germany ADAS Simulation Market Statistics, 2022-2032F
- Market Size & Growth Outlook
- By Revenues in USD Million
- Market Segmentation & Growth Outlook
- By Simulation Type- Market Insights and Forecast 2022-2032, USD Million
- By Offering- Market Insights and Forecast 2022-2032, USD Million
- By Vehicle Type- Market Insights and Forecast 2022-2032, USD Million
- By Level of Autonomy- Market Insights and Forecast 2022-2032, USD Million
- By Application- Market Insights and Forecast 2022-2032, USD Million
- By End-User- Market Insights and Forecast 2022-2032, USD Million
- Market Size & Growth Outlook
- France ADAS Simulation Market Statistics, 2022-2032F
- Market Size & Growth Outlook
- By Revenues in USD Million
- Market Segmentation & Growth Outlook
- By Simulation Type- Market Insights and Forecast 2022-2032, USD Million
- By Offering- Market Insights and Forecast 2022-2032, USD Million
- By Vehicle Type- Market Insights and Forecast 2022-2032, USD Million
- By Level of Autonomy- Market Insights and Forecast 2022-2032, USD Million
- By Application- Market Insights and Forecast 2022-2032, USD Million
- By End-User- Market Insights and Forecast 2022-2032, USD Million
- Market Size & Growth Outlook
- Spain ADAS Simulation Market Statistics, 2022-2032F
- Market Size & Growth Outlook
- By Revenues in USD Million
- Market Segmentation & Growth Outlook
- By Simulation Type- Market Insights and Forecast 2022-2032, USD Million
- By Offering- Market Insights and Forecast 2022-2032, USD Million
- By Vehicle Type- Market Insights and Forecast 2022-2032, USD Million
- By Level of Autonomy- Market Insights and Forecast 2022-2032, USD Million
- By Application- Market Insights and Forecast 2022-2032, USD Million
- By End-User- Market Insights and Forecast 2022-2032, USD Million
- Market Size & Growth Outlook
- Benelux ADAS Simulation Market Statistics, 2022-2032F
- Market Size & Growth Outlook
- By Revenues in USD Million
- Market Segmentation & Growth Outlook
- By Simulation Type- Market Insights and Forecast 2022-2032, USD Million
- By Offering- Market Insights and Forecast 2022-2032, USD Million
- By Vehicle Type- Market Insights and Forecast 2022-2032, USD Million
- By Level of Autonomy- Market Insights and Forecast 2022-2032, USD Million
- By Application- Market Insights and Forecast 2022-2032, USD Million
- By End-User- Market Insights and Forecast 2022-2032, USD Million
- Market Size & Growth Outlook
- Market Size & Growth Outlook
- Middle East & Africa ADAS Simulation Market Statistics, 2022-2032F
- Market Size & Growth Outlook
- By Revenues in USD Million
- Market Segmentation & Growth Outlook
- By Simulation Type- Market Insights and Forecast 2022-2032, USD Million
- By Offering- Market Insights and Forecast 2022-2032, USD Million
- By Vehicle Type- Market Insights and Forecast 2022-2032, USD Million
- By Level of Autonomy- Market Insights and Forecast 2022-2032, USD Million
- By Application- Market Insights and Forecast 2022-2032, USD Million
- By End-User- Market Insights and Forecast 2022-2032, USD Million
- By Country
- Saudi Arabia
- The UAE
- South Africa
- Bahrain
- Rest of Middle East & Africa
- Saudi Arabia ADAS Simulation Market Statistics, 2022-2032F
- Market Size & Growth Outlook
- By Revenues in USD Million
- Market Segmentation & Growth Outlook
- By Simulation Type- Market Insights and Forecast 2022-2032, USD Million
- By Offering- Market Insights and Forecast 2022-2032, USD Million
- By Vehicle Type- Market Insights and Forecast 2022-2032, USD Million
- By Level of Autonomy- Market Insights and Forecast 2022-2032, USD Million
- By Application- Market Insights and Forecast 2022-2032, USD Million
- By End-User- Market Insights and Forecast 2022-2032, USD Million
- Market Size & Growth Outlook
- The UAE ADAS Simulation Market Statistics, 2022-2032F
- Market Size & Growth Outlook
- By Revenues in USD Million
- Market Segmentation & Growth Outlook
- By Simulation Type- Market Insights and Forecast 2022-2032, USD Million
- By Offering- Market Insights and Forecast 2022-2032, USD Million
- By Vehicle Type- Market Insights and Forecast 2022-2032, USD Million
- By Level of Autonomy- Market Insights and Forecast 2022-2032, USD Million
- By Application- Market Insights and Forecast 2022-2032, USD Million
- By End-User- Market Insights and Forecast 2022-2032, USD Million
- Market Size & Growth Outlook
- South Africa ADAS Simulation Market Statistics, 2022-2032F
- Market Size & Growth Outlook
- By Revenues in USD Million
- Market Segmentation & Growth Outlook
- By Simulation Type- Market Insights and Forecast 2022-2032, USD Million
- By Offering- Market Insights and Forecast 2022-2032, USD Million
- By Vehicle Type- Market Insights and Forecast 2022-2032, USD Million
- By Level of Autonomy- Market Insights and Forecast 2022-2032, USD Million
- By Application- Market Insights and Forecast 2022-2032, USD Million
- By End-User- Market Insights and Forecast 2022-2032, USD Million
- Market Size & Growth Outlook
- Bahrain ADAS Simulation Market Statistics, 2022-2032F
- Market Size & Growth Outlook
- By Revenues in USD Million
- Market Segmentation & Growth Outlook
- By Simulation Type- Market Insights and Forecast 2022-2032, USD Million
- By Offering- Market Insights and Forecast 2022-2032, USD Million
- By Vehicle Type- Market Insights and Forecast 2022-2032, USD Million
- By Level of Autonomy- Market Insights and Forecast 2022-2032, USD Million
- By Application- Market Insights and Forecast 2022-2032, USD Million
- By End-User- Market Insights and Forecast 2022-2032, USD Million
- Market Size & Growth Outlook
- Market Size & Growth Outlook
- Asia Pacific ADAS Simulation Market Statistics, 2022-2032F
- Market Size & Growth Outlook
- By Revenues in USD Million
- Market Segmentation & Growth Outlook
- By Simulation Type- Market Insights and Forecast 2022-2032, USD Million
- By Offering- Market Insights and Forecast 2022-2032, USD Million
- By Vehicle Type- Market Insights and Forecast 2022-2032, USD Million
- By Level of Autonomy- Market Insights and Forecast 2022-2032, USD Million
- By Application- Market Insights and Forecast 2022-2032, USD Million
- By End-User- Market Insights and Forecast 2022-2032, USD Million
- By Country
- China
- Japan
- India
- South Korea
- Indonesia
- Rest of Asia Pacific
- China ADAS Simulation Market Statistics, 2022-2032F
- Market Size & Growth Outlook
- By Revenues in USD Million
- Market Segmentation & Growth Outlook
- By Simulation Type- Market Insights and Forecast 2022-2032, USD Million
- By Offering- Market Insights and Forecast 2022-2032, USD Million
- By Vehicle Type- Market Insights and Forecast 2022-2032, USD Million
- By Level of Autonomy- Market Insights and Forecast 2022-2032, USD Million
- By Application- Market Insights and Forecast 2022-2032, USD Million
- By End-User- Market Insights and Forecast 2022-2032, USD Million
- Market Size & Growth Outlook
- Japan ADAS Simulation Market Statistics, 2022-2032F
- Market Size & Growth Outlook
- By Revenues in USD Million
- Market Segmentation & Growth Outlook
- By Simulation Type- Market Insights and Forecast 2022-2032, USD Million
- By Offering- Market Insights and Forecast 2022-2032, USD Million
- By Vehicle Type- Market Insights and Forecast 2022-2032, USD Million
- By Level of Autonomy- Market Insights and Forecast 2022-2032, USD Million
- By Application- Market Insights and Forecast 2022-2032, USD Million
- By End-User- Market Insights and Forecast 2022-2032, USD Million
- Market Size & Growth Outlook
- India ADAS Simulation Market Statistics, 2022-2032F
- Market Size & Growth Outlook
- By Revenues in USD Million
- Market Segmentation & Growth Outlook
- By Simulation Type- Market Insights and Forecast 2022-2032, USD Million
- By Offering- Market Insights and Forecast 2022-2032, USD Million
- By Vehicle Type- Market Insights and Forecast 2022-2032, USD Million
- By Level of Autonomy- Market Insights and Forecast 2022-2032, USD Million
- By Application- Market Insights and Forecast 2022-2032, USD Million
- By End-User- Market Insights and Forecast 2022-2032, USD Million
- Market Size & Growth Outlook
- South Korea ADAS Simulation Market Statistics, 2022-2032F
- Market Size & Growth Outlook
- By Revenues in USD Million
- Market Segmentation & Growth Outlook
- By Simulation Type- Market Insights and Forecast 2022-2032, USD Million
- By Offering- Market Insights and Forecast 2022-2032, USD Million
- By Vehicle Type- Market Insights and Forecast 2022-2032, USD Million
- By Level of Autonomy- Market Insights and Forecast 2022-2032, USD Million
- By Application- Market Insights and Forecast 2022-2032, USD Million
- By End-User- Market Insights and Forecast 2022-2032, USD Million
- Market Size & Growth Outlook
- Indonesia ADAS Simulation Market Statistics, 2022-2032F
- Market Size & Growth Outlook
- By Revenues in USD Million
- Market Segmentation & Growth Outlook
- By Simulation Type- Market Insights and Forecast 2022-2032, USD Million
- By Offering- Market Insights and Forecast 2022-2032, USD Million
- By Vehicle Type- Market Insights and Forecast 2022-2032, USD Million
- By Level of Autonomy- Market Insights and Forecast 2022-2032, USD Million
- By Application- Market Insights and Forecast 2022-2032, USD Million
- By End-User- Market Insights and Forecast 2022-2032, USD Million
- Market Size & Growth Outlook
- Market Size & Growth Outlook
- Competitive Outlook
- Company Profiles
- Siemens AG
- Business Description
- Product Portfolio
- Collaborations & Alliances
- Recent Developments
- Financial Details
- Others
- ANSYS Inc.
- Business Description
- Product Portfolio
- Collaborations & Alliances
- Recent Developments
- Financial Details
- Others
- NVIDIA Corporation
- Business Description
- Product Portfolio
- Collaborations & Alliances
- Recent Developments
- Financial Details
- Others
- dSPACE GmbH
- Business Description
- Product Portfolio
- Collaborations & Alliances
- Recent Developments
- Financial Details
- Others
- IPG Automotive GmbH
- Business Description
- Product Portfolio
- Collaborations & Alliances
- Recent Developments
- Financial Details
- Others
- Applied Intuition Inc.
- Business Description
- Product Portfolio
- Collaborations & Alliances
- Recent Developments
- Financial Details
- Others
- The MathWorks Inc.
- Business Description
- Product Portfolio
- Collaborations & Alliances
- Recent Developments
- Financial Details
- Others
- Vector Informatik GmbH
- Business Description
- Product Portfolio
- Collaborations & Alliances
- Recent Developments
- Financial Details
- Others
- Keysight Technologies
- Business Description
- Product Portfolio
- Collaborations & Alliances
- Recent Developments
- Financial Details
- Others
- Dassault Systèmes SE
- Business Description
- Product Portfolio
- Collaborations & Alliances
- Recent Developments
- Financial Details
- Others
- rFpro Ltd.
- Business Description
- Product Portfolio
- Collaborations & Alliances
- Recent Developments
- Financial Details
- Others
- ESI Group
- Business Description
- Product Portfolio
- Collaborations & Alliances
- Recent Developments
- Financial Details
- Others
- Foretellix Ltd.
- Business Description
- Product Portfolio
- Collaborations & Alliances
- Recent Developments
- Financial Details
- Others
- AVL List GmbH
- Business Description
- Product Portfolio
- Collaborations & Alliances
- Recent Developments
- Financial Details
- Others
- Cognata Ltd.
- Business Description
- Product Portfolio
- Collaborations & Alliances
- Recent Developments
- Financial Details
- Others
- Hexagon AB
- Business Description
- Product Portfolio
- Collaborations & Alliances
- Recent Developments
- Financial Details
- Others
- Siemens AG
- Company Profiles
- Disclaimer
| Segment | Sub-Segment |
|---|---|
| By Simulation Type |
|
| By Offering |
|
| By Vehicle Type |
|
| By Level of Autonomy |
|
| By Application |
|
| By End-User |
|
| By Region |
|
Research Methodology
This study followed a structured approach comprising four key phases to assess the size and scope of the electro-oxidation market. The process began with thorough secondary research to collect data on the target market, related markets, and broader industry context. These findings, along with preliminary assumptions and estimates, were then validated through extensive primary research involving industry experts from across the value chain. To calculate the overall market size, both top-down and bottom-up methodologies were employed. Finally, market segmentation and data triangulation techniques were applied to refine and validate segment-level estimations.
Secondary Research
The secondary research phase involved gathering data from a wide range of credible and published sources. This step helped in identifying industry trends, defining market segmentation, and understanding the market landscape and value chain.
Sources consulted during this phase included:
- Company annual reports, investor presentations, and press releases
- Industry white papers and certified publications
- Trade directories and market-recognized databases
- Articles from authoritative authors and reputable journals
- Gold and silver standard websites
Secondary research was critical in mapping out the industry's value chain and monetary flow, identifying key market segments, understanding regional variations, and tracking significant industry developments.
Other key sources:
- Financial disclosures
- Industry associations and trade bodies
- News outlets and business magazines
- Academic journals and research studies
- Paid industry databases
Primary Research
To validate secondary data and gain deeper market insights, primary research was conducted with key stakeholders across both the supply and demand sides of the market.
On the demand side, participants included decision-makers and influencers from end-user industries—such as CIOs, CTOs, and CSOs—who provided first-hand perspectives on market needs, product usage, and future expectations.
On the supply side, interviews were conducted with manufacturers, industry associations, and institutional participants to gather insights into current offerings, product pipelines, and market challenges.
Primary interviews provided critical inputs such as:
- Market size and revenue data
- Product and service breakdowns
- Market forecasts
- Regional and application-specific trends
Stakeholders consulted included:
- Leading OEM and solution providers
- Channel and distribution partners
- End users across various applications
- Independent consultants and industry specialists
Market Size Estimation and Data Triangulation
- Identifying Key Market Participants (Secondary Research)
- Goal: To identify the major players or companies in the target market. This typically involves using publicly available data sources such as industry reports, market research publications, and financial statements of companies.
- Tools: Reports from firms like Gartner, Forrester, Euromonitor, Statista, IBISWorld, and others. Public financial statements, news articles, and press releases from top market players.
- Extracting Earnings of Key Market Participants
- Goal: To estimate the earnings generated from the product or service being analyzed. This step helps in understanding the revenue potential of each market player in a specific geography.
- Methods: Earnings data can be gathered from:
- Publicly available financial reports (for listed companies).
- Interviews and primary data sources from professionals, such as Directors, VPs, SVPs, etc. This is especially useful for understanding more nuanced, internal data that isn't publicly disclosed.
- Annual reports and investor presentations of key players.
- Data Collation and Development of a Relevant Data Model
- Goal: To collate inputs from both primary and secondary sources into a structured, data-driven model for market estimation. This model will incorporate key market KPIs and any independent variables relevant to the market.
- Key KPIs: These could include:
- Market size, growth rate, and demand drivers.
- Industry-specific metrics like market share, average revenue per customer (ARPC), or average deal size.
- External variables, such as economic growth rates, inflation rates, or commodity prices, that could affect the market.
- Data Modeling: Based on this data, the market forecasts are developed for the next 5 years. A combination of trend analysis, scenario modeling, and statistical regression might be used to generate projections.
- Scenario Analysis
- Goal: To test different assumptions and validate how sensitive the market is to changes in key variables (e.g., market demand, regulatory changes, technological disruptions).
- Types of Scenarios:
- Base Case: Based on current assumptions and historical data.
- Best-Case Scenario: Assuming favorable market conditions, regulatory environments, and technological advancements.
- Worst-Case Scenario: Accounting for adverse factors, such as economic downturns, stricter regulations, or unexpected disruptions.


