Global Vanadium Pentoxide Market Report: Trends, Growth and Forecast (2026-2032)
By Grade (Technical Grade, Battery Grade), By Application (Steel Alloys, Catalysts, Battery Materials), By Type (Dry Vanadium Pentoxide, Wet Vanadium Pentoxide), By Region (North America, South America, Europe, Middle East & Africa, Asia Pacific) ... Read more
|
Major Players
|
Global Vanadium Pentoxide Market Statistics and Insights, 2026
- Market Size Statistics
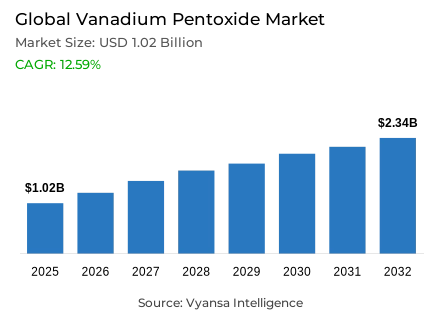
- Vanadium pentoxide market size in Global was estimated at USD 1.02 billion in 2025.
- The market size is expected to grow to USD 2.34 billion by 2032.
- Market to register a CAGR of around 12.59% during 2026-32.
- Grade Shares
- Technical grade grabbed market share of 70%.
- Competition
- Global vanadium pentoxide market is currently being catered to by more than 30 companies.
- Top 5 companies acquired around 50% of the market share.
- China Vanadium, Henan Zhongyuan Vanadium, Shengze Vanadium, AMG Vanadium, Bushveld Minerals etc., are few of the top companies.
- Application
- Steel alloys grabbed 60% of the market.
- Region
- Asia Pacific leads with a 70% share of the global market.
Global Vanadium Pentoxide Market Outlook
The Global Vanadium Pentoxide Market 2026-2032 has the capability to grow significantly as sustained needs driven by demand in the steel industry coupled with emerging energy storage applications continue to rise. Presently, the market is estimated to reach USD 1.02 billion by 2025 and will reach USD 2.34 billion in 2032, representing an approximate 12.59% CAGR from 2026 to 2032. High-strength vanadium-enhanced steel is the largest consumer of vanadium on the global market, representing approximately 60% of the total use of vanadium, with applications being used in rebar, as well as all types of heavy transportation and industrial machinery. Continuing support and growth in both steel production in China and changes to the country’s standards will continue to drive the vanadium market’s growth in terms of construction and industrial applications requiring durable products.
Presently, approximately 70% of the Global Vanadium Pentoxide Market is occupied by technical-grade vanadium, which has widespread uses in metallurgical processes, catalysts, and vanadium redox flow batteries. Technical-grade vanadium generally meets the high degree of purity required for manufacturing the high-strength low-alloy steel and emerging energy storage technologies ensuring consistent performance and meeting global quality standards. Specialty grades of vanadium continue to have a small but growing niche in the chemical synthesis and vanadium redox flow battery electrolyte segments and to provide market diversification.
Asia Pacific currently represents 70% of the global vanadium market, driven by the large vanadium production capability and integrated supply chain in China and are providing significant infrastructure development, renewable energy storage deployment, and continued industrialisation development, particularly in India and Southeast Asia, enhancing overall consumption in the region. North America and Europe represent a lesser role in the vanadium market and remain import dependent from the Asia-Pacific area demonstrating the strategic importance of having a secure supply chain and/or a geographically dominant production supply chain.
While new applications such as vanadium redox flow batteries are emerging as a future growth opportunity, the consumption of vanadium for this application has increased drastically in recent years. The emergence of applying long-duration storage solutions for the purposes of successfully stabilising grids and integrating renewable energy into such grids now increases the importance of vanadium in emerging energy storage applications, particularly when considered with the continuing growth of overall demand for steel and energy storage. Overall, as demand for vanadium continues to grow globally the Global Vanadium Pentoxide Market through 2032 will be dependent upon the ability of each user to develop and provide a reliable supply of technical-grade vanadium for use across multiple sectors.

Global Vanadium Pentoxide Market Growth Driver
Expanding Infrastructure Investment Propels Vanadium Consumption
According to the IEA's World Energy Investment Report (2024), clean energy investment globally is now $2 Trillion (2024) and for the first time has exceeded fossil fuel investment. The continued growth in demand for clean energy supports the increasing use of vanadium-steel in high-strength construction applications. Approximately 90% of global vanadium consumption will occur in the steel sector, with a wide range of uses in rebar, rail and industrial machinery. The new October 2024, Codes for Chinese National Rebar (GB 1499.2-2024) will increase the amount of vanadium needed to manufacture rebar in China, thereby supporting projected annual growth rates of 15% in vanadium/nitrogen consumption to manufacture rebar in China.
The total volume of crude steel produced in 2019 was 1,878 million tons to 1,897 million tons in 2023, which is an example of the continuing strength of the global steel market and the demand for infrastructure based economies. The Asia Pacific region is the dominant player in the steel rebar market, holding 65% of the global market in 2024, with China leading the way. As countries continue to develop with an ever-increasing urbanization and industrialisation rate, there will be continued growth in the use of vanadium across both emerging and developed markets.
Global Vanadium Pentoxide Market Challenge
Supply Concentration and Production Limitations Restrict Market Growth
The geographic concentration of vanadium production remains very high, with approximately 70,000 metric tonnes produced in China, followed by Russia (21,000 metric tonnes), South Africa (8,000 metric tonnes), and Brazil (5,000 metric tonnes) producing the remaining 99% of global output (US Geological Survey 2024). This creates significant supply vulnerability due to geopolitical instability, trade restrictions, and regulatory uncertainty. In addition, the current level of exploration and investment in new vanadium mining capacity continues to limit future supply constraints, which creates further pressure within the market and potential for volatility in pricing.
The growing demand from vanadium redox flow batteries (VRFBers) corresponds with the growing demand for steel, and more competition within the steel sector is occurring due to the increased demand for vanadium. Events in recent history, such as China limiting exports of vanadium and the war in Ukraine, show the vulnerability of the market to supply chain disruptions. Industry analysis indicates the potential of a vanadium supply shortfall.
Unlock Market Intelligence
Explore the market potential with our data-driven report
Global Vanadium Pentoxide Market Trend
Expanding Role of Vanadium in Renewable Energy Storage
The VRFB segment has become the largest growth area for vanadium products, according to Vanitec. Global usage of VRFBers is expected to have more than doubled from 106% in mid-to-late 2020 (i.e., during the second half of the calendar year 2024). Because of their many advantages, including over ten thousand cycles, round-trip efficiencies of 65-75%, and ability to be used with scalable electrical grids, VRFBers are increasingly deployed in renewable energy projects related to managing variability and stabilizing the grid across global marketplaces.
Globally, governments are investing in both renewable energy and VRFBers. Thus, according to the International Energy Agency's projections, these two technologies will need to grow rapidly in order to achieve zero net emissions. Emerging markets, notably California, Japan, and developing countries, are integrating VRFBs into their electrical grids to enhance grid stability, establishing vanadium as a strategic material in the transition to renewable energy and in its historical metallurgical applications. This trend will create opportunities for vanadium to be used in other applications and thus, create demand from end-users looking to purchase VRFB solutions that are technical-grade vanadium meeting the high quality and electrochemical specifications required when producing VRFB electrolytes.
Global Vanadium Pentoxide Market Opportunity
Growing Vanadium Demand in Emerging Industrial Markets
India will see its production capacity of steel increase to 300 million tonnes by 2030-31, up from currently produced 171 million tonnes in 2023. This will create a huge increase in the use of vanadium-enhanced alloys for construction, transportation, and industrial use and at least 190 million tonne of crude steel demand for India in 2030 which represents an 8% compound annual growth rate (CAGR) from 2023.
In addition to steel, vanadium-based catalysts are also used widely to remove sulphur from crude oil used in petroleum refining and more recently have gained increasing popularity within aerospace and specialty chemicals due to their excellent strength, corrosion resistance, and electrochemical stability. As rapidly growing renewable energy storage applications continue to develop, the new sources of vanadium-driven steel will only enhance the need for a consistent and reliable supply of quality vanadium to meet diverse needs of multiple users over multiple end uses on and off the job site.
Global Vanadium Pentoxide Market Regional Analysis

By Region
- North America
- South America
- Europe
- Middle East & Africa
- Asia Pacific
Asia Pacific holds a 70% share of the global vanadium pentoxide market, driven by steel production, infrastructure development, and increasing renewable energy storage deployment. China dominates the region, producing 70,000 metric tons annually, serving as the hub for vanadium processing and downstream applications. The integrated supply chain—from extraction to technical-grade refining—provides cost advantages and supply security for end users across regional and global markets.
Rapid urbanization, government infrastructure initiatives such as the Belt and Road Initiative, and China's carbon neutrality targets for 2060 further accelerate demand for vanadium-enhanced steels and VRFB systems. India’s projected crude steel production growth to 230 million tons by 2030 and Southeast Asian industrialization strengthen regional market prospects. North America and Europe remain secondary markets, reliant on imports from Asia Pacific and other concentrated supply regions, highlighting the strategic importance of regional production dominance.
Unlock Market Intelligence
Explore the market potential with our data-driven report
Global Vanadium Pentoxide Market Segmentation Analysis
By Grade
- Technical Grade
- Battery Grade
Technical grade vanadium pentoxide commands a 70% share of the global market, reflecting its widespread industrial application across steel production, catalysts, and emerging energy storage technologies. High-purity specifications ensure precise elemental composition, which directly impacts metallurgical performance and regulatory compliance. Products in this category meet stringent international standards for impurities such as iron, silicon, and nickel, critical for high-strength low-alloy (HSLA) steel applications.
Specialty grades, including wet vanadium pentoxide and other vanadium compounds, serve niche applications in catalysts, chemical synthesis, and VRFB energy storage. The technical grade segment continues to dominate due to the combined influence of traditional steel demand and the shift toward ultra-high purity requirements for flow battery electrolytes. End users across metallurgical and energy storage applications rely on technical grade vanadium for consistent performance and supply reliability.

By Application
- Steel Alloys
- Catalysts
- Battery Materials
Steel alloy applications account for 60% of the global vanadium pentoxide market, highlighting vanadium’s role as a high-strength metallurgical additive. Its inclusion improves steel durability, corrosion resistance, and structural performance with minimal dosage, making it economically attractive for rebar, rolled plates, seamless tubes, and specialty alloy production. These applications support construction, automotive, aerospace, and industrial sectors requiring stringent material standards.
Secondary applications, including catalytic processes, energy storage, and specialty chemicals, occupy smaller but rapidly growing market shares. The 60% dominance of steel alloy applications reflects established supply chains, regulatory compliance, and mature demand, while emerging battery storage technologies and advanced catalyst development signal a gradual diversification of vanadium consumption for end users seeking high-performance solutions beyond traditional metallurgical uses.
Market Players in Global Vanadium Pentoxide Market
These market players maintain a significant presence in the Global vanadium pentoxide market sector and contribute to its ongoing evolution.
- China Vanadium
- Henan Zhongyuan Vanadium
- Shengze Vanadium
- AMG Vanadium
- Bushveld Minerals
- Energy Fuels
- Largo Resources
- Glencore
- Chongyi Zhangyuan Vanadium
- Xiamen Tungsten
- Qinghai Tianyi
- Yunnan Metallurgical
- Hunan Chenzhou
- Baotou Steel
- Sichuan Vanadium & Titanium
Market News & Updates
- AMG Vanadium, 2025:
Reported Q3 2025 strong performance with revenue of $154 million (2% increase from Q3 2024) driven by increased sales prices in ferrovanadium and chrome metal despite lower ferrovanadium volumes from refinery supplier production issues; adjusted EBITDA surged 81% to $19.5 million in Q3 2025 (from $10.8 million Q3 2024), with the company positioned as world's market leader in recycling vanadium from oil refining residues benefiting from Section 45X production credit for critical materials manufacturing under Inflation Reduction Act.
- Largo Resources, 2025:
Achieved improved Q2 2025 vanadium pentoxide (V₂O₅) production of 2,256 tonnes (5.0 million lbs), representing 74% increase from Q1 2025 though below Q2 2024's 2,689 tonnes; global recovery rate reached 84.9% (14% improvement from Q2 2024's 74.3%), with total material mined increased 32% year-over-year to 4.3 million tonnes, demonstrating operational turnaround advancement with enhanced mine access, mining rates, production and recovery metrics positioning company to meet full-year V₂O₅ production targets.
Frequently Asked Questions
Related Report
1. Market Segmentation
1.1. Research Scope
1.2. Research Methodology
1.3. Definitions and Assumptions
2. Executive Summary
3. Global Vanadium Pentoxide Market Policies, Regulations, and Standards
4. Global Vanadium Pentoxide Market Dynamics
4.1. Growth Factors
4.2. Challenges
4.3. Trends
4.4. Opportunities
5. Global Vanadium Pentoxide Market Statistics, 2022-2032F
5.1. Market Size & Growth Outlook
5.1.1.By Revenues in USD Million
5.2. Market Segmentation & Growth Outlook
5.2.1.By Grade
5.2.1.1. Technical Grade- Market Insights and Forecast 2022-2032, USD Million
5.2.1.2. Battery Grade- Market Insights and Forecast 2022-2032, USD Million
5.2.2.By Application
5.2.2.1. Steel Alloys- Market Insights and Forecast 2022-2032, USD Million
5.2.2.2. Catalysts- Market Insights and Forecast 2022-2032, USD Million
5.2.2.3. Battery Materials- Market Insights and Forecast 2022-2032, USD Million
5.2.3.By Type
5.2.3.1. Dry Vanadium Pentoxide- Market Insights and Forecast 2022-2032, USD Million
5.2.3.2. Wet Vanadium Pentoxide- Market Insights and Forecast 2022-2032, USD Million
5.2.4.By Region
5.2.4.1. North America
5.2.4.2. South America
5.2.4.3. Europe
5.2.4.4. Middle East & Africa
5.2.4.5. Asia Pacific
5.2.5.By Competitors
5.2.5.1. Competition Characteristics
5.2.5.2. Market Share & Analysis
6. North America Vanadium Pentoxide Market Statistics, 2022-2032F
6.1. Market Size & Growth Outlook
6.1.1.By Revenues in USD Million
6.2. Market Segmentation & Growth Outlook
6.2.1.By Grade- Market Insights and Forecast 2022-2032, USD Million
6.2.2.By Application- Market Insights and Forecast 2022-2032, USD Million
6.2.3.By Type- Market Insights and Forecast 2022-2032, USD Million
6.2.4.By Country
6.2.4.1. US
6.2.4.2. Canada
6.2.4.3. Mexico
6.2.4.4. Rest of North America
6.3. US Vanadium Pentoxide Market Statistics, 2022-2032F
6.3.1.Market Size & Growth Outlook
6.3.1.1. By Revenues in USD Million
6.3.2.Market Segmentation & Growth Outlook
6.3.2.1. By Grade- Market Insights and Forecast 2022-2032, USD Million
6.3.2.2. By Application- Market Insights and Forecast 2022-2032, USD Million
6.4. Canada Vanadium Pentoxide Market Statistics, 2022-2032F
6.4.1.Market Size & Growth Outlook
6.4.1.1. By Revenues in USD Million
6.4.2.Market Segmentation & Growth Outlook
6.4.2.1. By Grade- Market Insights and Forecast 2022-2032, USD Million
6.4.2.2. By Application- Market Insights and Forecast 2022-2032, USD Million
6.5. Mexico Vanadium Pentoxide Market Statistics, 2022-2032F
6.5.1.Market Size & Growth Outlook
6.5.1.1. By Revenues in USD Million
6.5.2.Market Segmentation & Growth Outlook
6.5.2.1. By Grade- Market Insights and Forecast 2022-2032, USD Million
6.5.2.2. By Application- Market Insights and Forecast 2022-2032, USD Million
7. South America Vanadium Pentoxide Market Statistics, 2022-2032F
7.1. Market Size & Growth Outlook
7.1.1.By Revenues in USD Million
7.2. Market Segmentation & Growth Outlook
7.2.1.By Grade- Market Insights and Forecast 2022-2032, USD Million
7.2.2.By Application- Market Insights and Forecast 2022-2032, USD Million
7.2.3.By Type- Market Insights and Forecast 2022-2032, USD Million
7.2.4.By Country
7.2.4.1. Brazil
7.2.4.2. Rest of South America
7.3. Brazil Vanadium Pentoxide Market Statistics, 2022-2032F
7.3.1.Market Size & Growth Outlook
7.3.1.1. By Revenues in USD Million
7.3.2.Market Segmentation & Growth Outlook
7.3.2.1. By Grade- Market Insights and Forecast 2022-2032, USD Million
7.3.2.2. By Application- Market Insights and Forecast 2022-2032, USD Million
8. Europe Vanadium Pentoxide Market Statistics, 2022-2032F
8.1. Market Size & Growth Outlook
8.1.1.By Revenues in USD Million
8.2. Market Segmentation & Growth Outlook
8.2.1.By Grade- Market Insights and Forecast 2022-2032, USD Million
8.2.2.By Application- Market Insights and Forecast 2022-2032, USD Million
8.2.3.By Type- Market Insights and Forecast 2022-2032, USD Million
8.2.4.By Country
8.2.4.1. Russia
8.2.4.2. Germany
8.2.4.3. France
8.2.4.4. UK
8.2.4.5. Italy
8.2.4.6. Spain
8.2.4.7. Netherlands
8.2.4.8. Belgium
8.2.4.9. Poland
8.2.4.10. Turkey
8.2.4.11. Rest of Europe
8.3. Russia Vanadium Pentoxide Market Statistics, 2022-2032F
8.3.1.Market Size & Growth Outlook
8.3.1.1. By Revenues in USD Million
8.3.2.Market Segmentation & Growth Outlook
8.3.2.1. By Grade- Market Insights and Forecast 2022-2032, USD Million
8.3.2.2. By Application- Market Insights and Forecast 2022-2032, USD Million
8.4. Germany Vanadium Pentoxide Market Statistics, 2022-2032F
8.4.1.Market Size & Growth Outlook
8.4.1.1. By Revenues in USD Million
8.4.2.Market Segmentation & Growth Outlook
8.4.2.1. By Grade- Market Insights and Forecast 2022-2032, USD Million
8.4.2.2. By Application- Market Insights and Forecast 2022-2032, USD Million
8.5. France Vanadium Pentoxide Market Statistics, 2022-2032F
8.5.1.Market Size & Growth Outlook
8.5.1.1. By Revenues in USD Million
8.5.2.Market Segmentation & Growth Outlook
8.5.2.1. By Grade- Market Insights and Forecast 2022-2032, USD Million
8.5.2.2. By Application- Market Insights and Forecast 2022-2032, USD Million
8.6. UK Vanadium Pentoxide Market Statistics, 2022-2032F
8.6.1.Market Size & Growth Outlook
8.6.1.1. By Revenues in USD Million
8.6.2.Market Segmentation & Growth Outlook
8.6.2.1. By Grade- Market Insights and Forecast 2022-2032, USD Million
8.6.2.2. By Application- Market Insights and Forecast 2022-2032, USD Million
8.7. Italy Vanadium Pentoxide Market Statistics, 2022-2032F
8.7.1.Market Size & Growth Outlook
8.7.1.1. By Revenues in USD Million
8.7.2.Market Segmentation & Growth Outlook
8.7.2.1. By Grade- Market Insights and Forecast 2022-2032, USD Million
8.7.2.2. By Application- Market Insights and Forecast 2022-2032, USD Million
8.8. Spain Vanadium Pentoxide Market Statistics, 2022-2032F
8.8.1.Market Size & Growth Outlook
8.8.1.1. By Revenues in USD Million
8.8.2.Market Segmentation & Growth Outlook
8.8.2.1. By Grade- Market Insights and Forecast 2022-2032, USD Million
8.8.2.2. By Application- Market Insights and Forecast 2022-2032, USD Million
8.9. Netherlands Vanadium Pentoxide Market Statistics, 2022-2032F
8.9.1.Market Size & Growth Outlook
8.9.1.1. By Revenues in USD Million
8.9.2.Market Segmentation & Growth Outlook
8.9.2.1. By Grade- Market Insights and Forecast 2022-2032, USD Million
8.9.2.2. By Application- Market Insights and Forecast 2022-2032, USD Million
8.10. Belgium Vanadium Pentoxide Market Statistics, 2022-2032F
8.10.1. Market Size & Growth Outlook
8.10.1.1. By Revenues in USD Million
8.10.2. Market Segmentation & Growth Outlook
8.10.2.1. By Grade- Market Insights and Forecast 2022-2032, USD Million
8.10.2.2. By Application- Market Insights and Forecast 2022-2032, USD Million
8.11. Poland Vanadium Pentoxide Market Statistics, 2022-2032F
8.11.1. Market Size & Growth Outlook
8.11.1.1. By Revenues in USD Million
8.11.2. Market Segmentation & Growth Outlook
8.11.2.1. By Grade- Market Insights and Forecast 2022-2032, USD Million
8.11.2.2. By Application- Market Insights and Forecast 2022-2032, USD Million
8.12. Turkey Vanadium Pentoxide Market Statistics, 2022-2032F
8.12.1. Market Size & Growth Outlook
8.12.1.1. By Revenues in USD Million
8.12.2. Market Segmentation & Growth Outlook
8.12.2.1. By Grade- Market Insights and Forecast 2022-2032, USD Million
8.12.2.2. By Application- Market Insights and Forecast 2022-2032, USD Million
9. Middle East & Africa Vanadium Pentoxide Market Statistics, 2022-2032F
9.1. Market Size & Growth Outlook
9.1.1.By Revenues in USD Million
9.2. Market Segmentation & Growth Outlook
9.2.1.By Grade- Market Insights and Forecast 2022-2032, USD Million
9.2.2.By Application- Market Insights and Forecast 2022-2032, USD Million
9.2.3.By Type- Market Insights and Forecast 2022-2032, USD Million
9.2.4.By Country
9.2.4.1. South Africa
9.2.4.2. GCC
9.2.4.3. Rest of Middle East & Africa
9.3. South Africa Vanadium Pentoxide Market Statistics, 2022-2032F
9.3.1.Market Size & Growth Outlook
9.3.1.1. By Revenues in USD Million
9.3.2.Market Segmentation & Growth Outlook
9.3.2.1. By Grade- Market Insights and Forecast 2022-2032, USD Million
9.3.2.2. By Application- Market Insights and Forecast 2022-2032, USD Million
9.4. GCC Vanadium Pentoxide Market Statistics, 2022-2032F
9.4.1.Market Size & Growth Outlook
9.4.1.1. By Revenues in USD Million
9.4.2.Market Segmentation & Growth Outlook
9.4.2.1. By Grade- Market Insights and Forecast 2022-2032, USD Million
9.4.2.2. By Application- Market Insights and Forecast 2022-2032, USD Million
10. Asia Pacific Vanadium Pentoxide Market Statistics, 2022-2032F
10.1. Market Size & Growth Outlook
10.1.1. By Revenues in USD Million
10.2. Market Segmentation & Growth Outlook
10.2.1. By Grade- Market Insights and Forecast 2022-2032, USD Million
10.2.2. By Application- Market Insights and Forecast 2022-2032, USD Million
10.2.3. By Type- Market Insights and Forecast 2022-2032, USD Million
10.2.4. By Country
10.2.4.1. China
10.2.4.2. India
10.2.4.3. Japan
10.2.4.4. South Korea
10.2.4.5. Australia
10.2.4.6. Thailand
10.2.4.7. Rest of Asia Pacific
10.3. China Vanadium Pentoxide Market Statistics, 2022-2032F
10.3.1. Market Size & Growth Outlook
10.3.1.1. By Revenues in USD Million
10.3.2. Market Segmentation & Growth Outlook
10.3.2.1. By Grade- Market Insights and Forecast 2022-2032, USD Million
10.3.2.2. By Application- Market Insights and Forecast 2022-2032, USD Million
10.4. India Vanadium Pentoxide Market Statistics, 2022-2032F
10.4.1. Market Size & Growth Outlook
10.4.1.1. By Revenues in USD Million
10.4.2. Market Segmentation & Growth Outlook
10.4.2.1. By Grade- Market Insights and Forecast 2022-2032, USD Million
10.4.2.2. By Application- Market Insights and Forecast 2022-2032, USD Million
10.5. Japan Vanadium Pentoxide Market Statistics, 2022-2032F
10.5.1. Market Size & Growth Outlook
10.5.1.1. By Revenues in USD Million
10.5.2. Market Segmentation & Growth Outlook
10.5.2.1. By Grade- Market Insights and Forecast 2022-2032, USD Million
10.5.2.2. By Application- Market Insights and Forecast 2022-2032, USD Million
10.6. South Korea Vanadium Pentoxide Market Statistics, 2022-2032F
10.6.1. Market Size & Growth Outlook
10.6.1.1. By Revenues in USD Million
10.6.2. Market Segmentation & Growth Outlook
10.6.2.1. By Grade- Market Insights and Forecast 2022-2032, USD Million
10.6.2.2. By Application- Market Insights and Forecast 2022-2032, USD Million
10.7. Australia Vanadium Pentoxide Market Statistics, 2022-2032F
10.7.1. Market Size & Growth Outlook
10.7.1.1. By Revenues in USD Million
10.7.2. Market Segmentation & Growth Outlook
10.7.2.1. By Grade- Market Insights and Forecast 2022-2032, USD Million
10.7.2.2. By Application- Market Insights and Forecast 2022-2032, USD Million
10.8. Thailand Vanadium Pentoxide Market Statistics, 2022-2032F
10.8.1. Market Size & Growth Outlook
10.8.1.1. By Revenues in USD Million
10.8.2. Market Segmentation & Growth Outlook
10.8.2.1. By Grade- Market Insights and Forecast 2022-2032, USD Million
10.8.2.2. By Application- Market Insights and Forecast 2022-2032, USD Million
11. Competitive Outlook
11.1. Company Profiles
11.1.1. AMG Vanadium
11.1.1.1. Business Description
11.1.1.2. Product Portfolio
11.1.1.3. Collaborations & Alliances
11.1.1.4. Recent Developments
11.1.1.5. Financial Details
11.1.1.6. Others
11.1.2. Bushveld Minerals
11.1.2.1. Business Description
11.1.2.2. Product Portfolio
11.1.2.3. Collaborations & Alliances
11.1.2.4. Recent Developments
11.1.2.5. Financial Details
11.1.2.6. Others
11.1.3. Energy Fuels
11.1.3.1. Business Description
11.1.3.2. Product Portfolio
11.1.3.3. Collaborations & Alliances
11.1.3.4. Recent Developments
11.1.3.5. Financial Details
11.1.3.6. Others
11.1.4. Largo Resources
11.1.4.1. Business Description
11.1.4.2. Product Portfolio
11.1.4.3. Collaborations & Alliances
11.1.4.4. Recent Developments
11.1.4.5. Financial Details
11.1.4.6. Others
11.1.5. Glencore
11.1.5.1. Business Description
11.1.5.2. Product Portfolio
11.1.5.3. Collaborations & Alliances
11.1.5.4. Recent Developments
11.1.5.5. Financial Details
11.1.5.6. Others
11.1.6. China Vanadium
11.1.6.1. Business Description
11.1.6.2. Product Portfolio
11.1.6.3. Collaborations & Alliances
11.1.6.4. Recent Developments
11.1.6.5. Financial Details
11.1.6.6. Others
11.1.7. Henan Zhongyuan Vanadium
11.1.7.1. Business Description
11.1.7.2. Product Portfolio
11.1.7.3. Collaborations & Alliances
11.1.7.4. Recent Developments
11.1.7.5. Financial Details
11.1.7.6. Others
11.1.8. Shengze Vanadium
11.1.8.1. Business Description
11.1.8.2. Product Portfolio
11.1.8.3. Collaborations & Alliances
11.1.8.4. Recent Developments
11.1.8.5. Financial Details
11.1.8.6. Others
11.1.9. Chongyi Zhangyuan Vanadium
11.1.9.1. Business Description
11.1.9.2. Product Portfolio
11.1.9.3. Collaborations & Alliances
11.1.9.4. Recent Developments
11.1.9.5. Financial Details
11.1.9.6. Others
11.1.10. Xiamen Tungsten
11.1.10.1.Business Description
11.1.10.2.Product Portfolio
11.1.10.3.Collaborations & Alliances
11.1.10.4.Recent Developments
11.1.10.5.Financial Details
11.1.10.6.Others
11.1.11. Qinghai Tianyi
11.1.11.1.Business Description
11.1.11.2.Product Portfolio
11.1.11.3.Collaborations & Alliances
11.1.11.4.Recent Developments
11.1.11.5.Financial Details
11.1.11.6.Others
11.1.12. Yunnan Metallurgical
11.1.12.1.Business Description
11.1.12.2.Product Portfolio
11.1.12.3.Collaborations & Alliances
11.1.12.4.Recent Developments
11.1.12.5.Financial Details
11.1.12.6.Others
11.1.13. Hunan Chenzhou
11.1.13.1.Business Description
11.1.13.2.Product Portfolio
11.1.13.3.Collaborations & Alliances
11.1.13.4.Recent Developments
11.1.13.5.Financial Details
11.1.13.6.Others
11.1.14. Baotou Steel
11.1.14.1.Business Description
11.1.14.2.Product Portfolio
11.1.14.3.Collaborations & Alliances
11.1.14.4.Recent Developments
11.1.14.5.Financial Details
11.1.14.6.Others
11.1.15. Sichuan Vanadium & Titanium
11.1.15.1.Business Description
11.1.15.2.Product Portfolio
11.1.15.3.Collaborations & Alliances
11.1.15.4.Recent Developments
11.1.15.5.Financial Details
11.1.15.6.Others
12. Disclaimer
| Segment | Sub-Segment |
|---|---|
| By Grade |
|
| By Application |
|
| By Type |
|
| By Region |
|
Research Methodology
This study followed a structured approach comprising four key phases to assess the size and scope of the electro-oxidation market. The process began with thorough secondary research to collect data on the target market, related markets, and broader industry context. These findings, along with preliminary assumptions and estimates, were then validated through extensive primary research involving industry experts from across the value chain. To calculate the overall market size, both top-down and bottom-up methodologies were employed. Finally, market segmentation and data triangulation techniques were applied to refine and validate segment-level estimations.
Secondary Research
The secondary research phase involved gathering data from a wide range of credible and published sources. This step helped in identifying industry trends, defining market segmentation, and understanding the market landscape and value chain.
Sources consulted during this phase included:
- Company annual reports, investor presentations, and press releases
- Industry white papers and certified publications
- Trade directories and market-recognized databases
- Articles from authoritative authors and reputable journals
- Gold and silver standard websites
Secondary research was critical in mapping out the industry's value chain and monetary flow, identifying key market segments, understanding regional variations, and tracking significant industry developments.
Other key sources:
- Financial disclosures
- Industry associations and trade bodies
- News outlets and business magazines
- Academic journals and research studies
- Paid industry databases
Primary Research
To validate secondary data and gain deeper market insights, primary research was conducted with key stakeholders across both the supply and demand sides of the market.
On the demand side, participants included decision-makers and influencers from end-user industries—such as CIOs, CTOs, and CSOs—who provided first-hand perspectives on market needs, product usage, and future expectations.
On the supply side, interviews were conducted with manufacturers, industry associations, and institutional participants to gather insights into current offerings, product pipelines, and market challenges.
Primary interviews provided critical inputs such as:
- Market size and revenue data
- Product and service breakdowns
- Market forecasts
- Regional and application-specific trends
Stakeholders consulted included:
- Leading OEM and solution providers
- Channel and distribution partners
- End users across various applications
- Independent consultants and industry specialists
Market Size Estimation and Data Triangulation
- Identifying Key Market Participants (Secondary Research)
- Goal: To identify the major players or companies in the target market. This typically involves using publicly available data sources such as industry reports, market research publications, and financial statements of companies.
- Tools: Reports from firms like Gartner, Forrester, Euromonitor, Statista, IBISWorld, and others. Public financial statements, news articles, and press releases from top market players.
- Extracting Earnings of Key Market Participants
- Goal: To estimate the earnings generated from the product or service being analyzed. This step helps in understanding the revenue potential of each market player in a specific geography.
- Methods: Earnings data can be gathered from:
- Publicly available financial reports (for listed companies).
- Interviews and primary data sources from professionals, such as Directors, VPs, SVPs, etc. This is especially useful for understanding more nuanced, internal data that isn't publicly disclosed.
- Annual reports and investor presentations of key players.
- Data Collation and Development of a Relevant Data Model
- Goal: To collate inputs from both primary and secondary sources into a structured, data-driven model for market estimation. This model will incorporate key market KPIs and any independent variables relevant to the market.
- Key KPIs: These could include:
- Market size, growth rate, and demand drivers.
- Industry-specific metrics like market share, average revenue per customer (ARPC), or average deal size.
- External variables, such as economic growth rates, inflation rates, or commodity prices, that could affect the market.
- Data Modeling: Based on this data, the market forecasts are developed for the next 5 years. A combination of trend analysis, scenario modeling, and statistical regression might be used to generate projections.
- Scenario Analysis
- Goal: To test different assumptions and validate how sensitive the market is to changes in key variables (e.g., market demand, regulatory changes, technological disruptions).
- Types of Scenarios:
- Base Case: Based on current assumptions and historical data.
- Best-Case Scenario: Assuming favorable market conditions, regulatory environments, and technological advancements.
- Worst-Case Scenario: Accounting for adverse factors, such as economic downturns, stricter regulations, or unexpected disruptions.


