Global Sodium Hydroxide Market Report: Trends, Growth and Forecast (2026-2032)
By Grade (Solid, 50% Aqueous Solution, Others), By Production Process (Membrane Cell, Diaphragm Cell, Others), By Application (Biodiesel, Alumina, Inorganic Chemicals, Organic Chemicals, Food, Pulp & Paper, Soap & Detergent, Textiles, Water Treatment, Others), By Region (North America, South America, Europe, Middle East & Africa, Asia Pacific) ... Read more
|
Major Players
|
Global Sodium Hydroxide Market Statistics and Insights, 2026
- Market Size Statistics
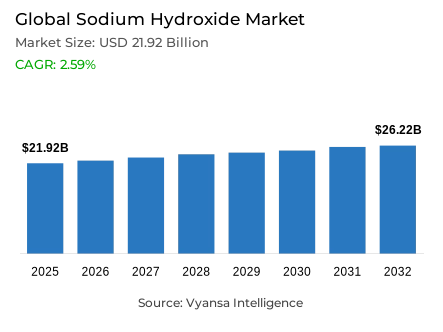
- Sodium hydroxide market size in Global was estimated at USD 21.92 billion in 2025.
- The market size is expected to grow to USD 26.22 billion by 2032.
- Market to register a CAGR of around 2.59% during 2026-32.
- Grade Shares
- 50% aqueous solution grabbed market share of 60%.
- Competition
- More than 25 companies are actively engaged in producing sodium hydroxide.
- Top 5 companies acquired around 40% of the market share.
- BASF SE, Nouryon, Xinjiang Zhongtai Chemical Co. Ltd., Tata Chemicals Ltd., Olin Corporation etc., are few of the top companies.
- Production Process
- Membrane cell grabbed 50% of the market.
- Region
- Asia Pacific leads with a 60% share of the global market.
Global Sodium Hydroxide Market Outlook
The Global sodium hydroxide market is estimated to be worth about USD 21.92 billion in 2025 and is projected to be worth about USD 26.22 billion by 2032 with a compound annual growth rate of about 2.59% between 2026 and 2032. The pulp and paper industry is a significant contributor to the market growth, with the industry contributing approximately 30% of the total consumption. The chemical is part of the kraft pulping process, which helps in breaking down lignin, thus increasing the yield and quality of pulp. This is in line with the new international trend of recyclable and sustainable packaging materials. As a result, a number of nations such as China, India, and the United States are aggressively expanding their pulp manufacturing to achieve packaging and sustainability goals.
Additional factors that promote new production directions include environmental compliance and energy related issues. Stricter emission regulations and higher energy prices encourage manufacturers to use cleaner and more efficient production processes. The shift to membrane cell electrolysis, which supplies about 50% of the global sodium hydroxide production, shows that the industry is dedicated to sustainable production. It is a technology that uses less power and yields high-purity caustic soda with low levels of mercury and tends to be more reliable in its operation.
The 50% aqueous solution grade is the most common in the market, with a 60% market share due to its constant concentration, safety and handling properties, such as compatibility with automated industrial systems. Its extensive use in the pulp, alumina, textile, and chemical industries highlights its feasibility and effectiveness in different industrial environments.
Asia-Pacific region is the largest consumer of sodium hydroxide in the world with an estimated 60% of all sodium hydroxide being used in the region with the aid of the fast industrialisation in China and India. The strong demand of pulp, alumina and water treatment industries, and governmental investments in clean energy and environmental infrastructure further strengthen the dominance of the region in the world sodium hydroxide demand.

Global Sodium Hydroxide Market Growth Driver
Expansion in Pulp and Paper Manufacturing Strengthens Global Demand
Growth in industrial activities within the pulp and paper industry has significantly boosted the use of sodium hydroxide in the world. The most common process is kraft pulping, which uses sodium hydroxide to cut the lignin bonds to increase the yield and quality of pulp. The industry contributes approximately 30% of the world demand, which is further driven by the growth of e-commerce and the increasing demand of recyclable and sustainable packaging materials. The leading consuming countries such as China, India and the United States have gone on to increase their pulp manufacturing capacities to meet this demand.
The use of sodium hydroxide in pulping and bleaching is set to increase even more as the end users embrace sustainable manufacturing methods. Increasing regulatory and environmental demands drive the transition to environmentally friendly packaging, ensuring the pulp and paper industry demand in the long term. All these developments support the role of the chemical in promoting sustainable production in the global manufacturing networks.
Global Sodium Hydroxide Market Challenge
Regulatory Pressures and Supply Chain Complexity Affect Production Stability
Heightened regulatory compliance requirements alongside persistent supply chain volatility are reshaping the production landscape of sodium hydroxide, creating operational and cost-related pressures across the value chain. In 2020, the U.S. chlor-alkali industry used an estimated 94 TWh of electricity and 36 trillion BTU of fuels – a fact that speaks volumes of its high dependency on energy. New environmental laws, including the Environmental Protection Second Amendment Rules of 2025, introduced by the Government of India, have placed new limits on effluents and emissions, forcing manufacturers to invest in state-of-the-art water treatment systems and greener technologies.
These required upgrades are very capital intensive, which raises the cost of operation and in some cases, leads to production shutdowns. All these lead to unstable production as well as fluctuation of energy prices and availability of raw materials. Manufacturers are now being pressured to strike a balance between compliance and cost-effectiveness, leading many to adopt high-tech production systems that minimize environmental impact without compromising profitability and production reliability.
Unlock Market Intelligence
Explore the market potential with our data-driven report
Global Sodium Hydroxide Market Trend
Shift Toward Membrane Cell Electrolysis Enhances Efficiency
The worldwide adoption of membrane cell electrolysis is a characteristic technological change in the production of sodium hydroxide. It uses about 2,500 kWh/ton of energy on average, which is much less than the energy used in diaphragm-related systems, and yields higher-quality caustic soda without mercury contamination; it also encourages cleaner production methods in accordance with modern sustainability and regulatory requirements.
China is the first to adopt the state-of-the-art membrane cell technology, then the United States and India, thus lowering the cost of operation and achieving higher emission standards. This change is one of the major modernization efforts that are required throughout the chlor-alkali industry, which guarantees efficiency, compliance, and minimized environmental risk in the long term. With buyers of these final products becoming more and more concerned with sustainable sourcing, membrane cell plants have become the global standard of reliable, energy-efficient production of sodium hydroxide.
Global Sodium Hydroxide Market Opportunity
Rising Utility in Water Treatment and Renewable Energy Storage
The strategic importance of sodium hydroxide is enhanced by its growing use in fields like water treatment and renewable energy systems. It maintains the optimum pH and alkalinity in wastewater and drinking water treatment and thus allows industries and municipalities to comply with the growing environmental requirements. A number of developing nations such as India and China invest a lot in water infrastructure, thus, sustaining the steady demand of this vital chemical.
In addition to its traditional applications, sodium hydroxide is increasingly being used in the treatment of electrolytes and flow batteries, which are used in storage of renewable energy. These new applications aid grid stability and energy transition goals, especially in markets that invest heavily in clean-energy systems. The end-uses that are diversified strengthen the role of this chemical as a multi-purpose industrial material that can be used in environmental management and technological development.
Global Sodium Hydroxide Market Regional Analysis

By Region
- North America
- South America
- Europe
- Middle East & Africa
- Asia Pacific
The Asia-Pacific region retains its position as the largest regional market, with share of around 60% of the total consumption of sodium hydroxide. The leading growth in industries like pulp, alumina, and chemical processing within the economies of China and India continues to keep the region’s position at the top. China maintains the highest level of consumption globally, followed by the United States and India, due to their huge manufacturing capacities and demand for caustic materials.
These countries heavily depend on sodium hydroxide for pulp, alumina, and chemical processing, which form the backbone of their industrial economies. Moreover, government initiatives to extend renewable energy infrastructure and water treatment facilities will further strengthen demand. Cost advantages, significant export capacity, and broad application diversity make the Asia-Pacific region dominate global consumption of sodium hydroxide for the next decade.
Unlock Market Intelligence
Explore the market potential with our data-driven report
Global Sodium Hydroxide Market Segmentation Analysis
By Grade
- Solid
- 50% Aqueous Solution
- Others
The 50% aqueous solution grade accounts for around 60% of the total sodium hydroxide consumption due to its superior safety, storage convenience, and process reliability. Sectors such as pulp and paper, alumina, textiles, and chemicals find this formulation ideal because it provides the same concentration on a continual basis-a great assurance in terms of efficient dosing with minimum handling risks. Its compatibility with automated operations makes it ideal for large-scale industrial use.
This segment's wide acceptance across China, India, and the U.S. indicates its adaptability and efficiency in varied industrial conditions. It delivers the right balance between performance and operational safety, reducing transportation challenges. As long as the end users continue with their focus on productivity and safety, the 50% aqueous solution will continue to be the most practical and widely adopted form of sodium hydroxide in the world market.

By Production Process
- Membrane Cell
- Diaphragm Cell
- Others
Membrane cell technology is the leading segment, it has a share of about 50% of global sodium hydroxide production, it is recognized as the leading production method because of its high energy efficiency and environmental safety. It produces high-purity caustic soda, free from mercury residues, conforming to worldwide standards of sustainability with reduced energy costs.
These countries are shifting to the method at a very rapid rate, partly because the yield and compliance benefits derived are far superior. The industry's growth in the replacement of mercury and diaphragm cells shows commitment towards cleaner production with lower operation risks. With continuous investment in technologies, membrane cell processes will be at the heart of future expansion and sustainability in the sodium hydroxide industry.
Market Players in Global Sodium Hydroxide Market
These market players maintain a significant presence in the Global sodium hydroxide market sector and contribute to its ongoing evolution.
- BASF SE
- Nouryon
- Xinjiang Zhongtai Chemical Co. Ltd.
- Tata Chemicals Ltd.
- Olin Corporation
- Westlake Corporation
- Occidental Petroleum Corporation
- Dow Inc
- Formosa Plastics Corporation
- Grasim Industries Limited
- Kemira Oyj
- Covestro AG
- Gujarat Alkalies and Chemicals Ltd
- Befar Group Co. Ltd.
- Ineos Group AG
Market News & Updates
- Century Lithium Corp, 2025:
Century Lithium Corp. announced a non-binding memorandum of understanding (MOU) with Orica Specialty Mining Chemicals to establish a potential long-term supply partnership. The agreement outlines the intent to formalize a multi-year offtake arrangement, under which Orica would procure sodium hydroxide (NaOH) from Century Lithium’s wholly owned Angel Island project near Silver Peak, Nevada. This development highlights increasing collaboration between lithium project developers and chemical suppliers to secure critical raw materials and strengthen supply chain integration within the evolving energy and mining ecosystem.
Frequently Asked Questions
Related Report
- Market Segmentation
- Research Scope
- Research Methodology
- Definitions and Assumptions
- Executive Summary
- Global Sodium Hydroxide Market Policies, Regulations, and Standards
- Global Sodium Hydroxide Market Dynamics
- Growth Factors
- Challenges
- Trends
- Opportunities
- Global Sodium Hydroxide Market Statistics, 2022-2032F
- Market Size & Growth Outlook
- By Revenues in USD Million
- Market Segmentation & Growth Outlook
- By Grade
- Solid- Market Insights and Forecast 2022-2032, USD Million
- 50% Aqueous Solution- Market Insights and Forecast 2022-2032, USD Million
- Others- Market Insights and Forecast 2022-2032, USD Million
- By Production Process
- Membrane Cell- Market Insights and Forecast 2022-2032, USD Million
- Diaphragm Cell- Market Insights and Forecast 2022-2032, USD Million
- Others- Market Insights and Forecast 2022-2032, USD Million
- By Application
- Biodiesel- Market Insights and Forecast 2022-2032, USD Million
- Alumina- Market Insights and Forecast 2022-2032, USD Million
- Inorganic Chemicals- Market Insights and Forecast 2022-2032, USD Million
- Organic Chemicals- Market Insights and Forecast 2022-2032, USD Million
- Food- Market Insights and Forecast 2022-2032, USD Million
- Pulp & Paper- Market Insights and Forecast 2022-2032, USD Million
- Soap & Detergent- Market Insights and Forecast 2022-2032, USD Million
- Textiles- Market Insights and Forecast 2022-2032, USD Million
- Water Treatment- Market Insights and Forecast 2022-2032, USD Million
- Others- Market Insights and Forecast 2022-2032, USD Million
- By Region
- North America
- South America
- Europe
- Middle East & Africa
- Asia Pacific
- By Competitors
- Competition Characteristics
- Market Share & Analysis
- By Grade
- Market Size & Growth Outlook
- North America Sodium Hydroxide Market Statistics, 2022-2032F
- Market Size & Growth Outlook
- By Revenues in USD Million
- Market Segmentation & Growth Outlook
- By Grade- Market Insights and Forecast 2022-2032, USD Million
- By Production Process- Market Insights and Forecast 2022-2032, USD Million
- By Application- Market Insights and Forecast 2022-2032, USD Million
- By Country
- US
- Canada
- Mexico
- Rest of North America
- US Sodium Hydroxide Market Statistics, 2022-2032F
- Market Size & Growth Outlook
- By Revenues in USD Million
- Market Segmentation & Growth Outlook
- By Grade- Market Insights and Forecast 2022-2032, USD Million
- By Production Process- Market Insights and Forecast 2022-2032, USD Million
- Market Size & Growth Outlook
- Canada Sodium Hydroxide Market Statistics, 2022-2032F
- Market Size & Growth Outlook
- By Revenues in USD Million
- Market Segmentation & Growth Outlook
- By Grade- Market Insights and Forecast 2022-2032, USD Million
- By Production Process- Market Insights and Forecast 2022-2032, USD Million
- Market Size & Growth Outlook
- Mexico Sodium Hydroxide Market Statistics, 2022-2032F
- Market Size & Growth Outlook
- By Revenues in USD Million
- Market Segmentation & Growth Outlook
- By Grade- Market Insights and Forecast 2022-2032, USD Million
- By Production Process- Market Insights and Forecast 2022-2032, USD Million
- Market Size & Growth Outlook
- Market Size & Growth Outlook
- South America Sodium Hydroxide Market Statistics, 2022-2032F
- Market Size & Growth Outlook
- By Revenues in USD Million
- Market Segmentation & Growth Outlook
- By Grade- Market Insights and Forecast 2022-2032, USD Million
- By Production Process- Market Insights and Forecast 2022-2032, USD Million
- By Application- Market Insights and Forecast 2022-2032, USD Million
- By Country
- Brazil
- Argentina
- Rest of South America
- Brazil Sodium Hydroxide Market Statistics, 2022-2032F
- Market Size & Growth Outlook
- By Revenues in USD Million
- Market Segmentation & Growth Outlook
- By Grade- Market Insights and Forecast 2022-2032, USD Million
- By Production Process- Market Insights and Forecast 2022-2032, USD Million
- Market Size & Growth Outlook
- Argentina Sodium Hydroxide Market Statistics, 2022-2032F
- Market Size & Growth Outlook
- By Revenues in USD Million
- Market Segmentation & Growth Outlook
- By Grade- Market Insights and Forecast 2022-2032, USD Million
- By Production Process- Market Insights and Forecast 2022-2032, USD Million
- Market Size & Growth Outlook
- Market Size & Growth Outlook
- Europe Sodium Hydroxide Market Statistics, 2022-2032F
- Market Size & Growth Outlook
- By Revenues in USD Million
- Market Segmentation & Growth Outlook
- By Grade- Market Insights and Forecast 2022-2032, USD Million
- By Production Process- Market Insights and Forecast 2022-2032, USD Million
- By Application- Market Insights and Forecast 2022-2032, USD Million
- By Country
- Germany
- France
- Italy
- UK
- Spain
- Rest of Europe
- Germany Sodium Hydroxide Market Statistics, 2022-2032F
- Market Size & Growth Outlook
- By Revenues in USD Million
- Market Segmentation & Growth Outlook
- By Grade- Market Insights and Forecast 2022-2032, USD Million
- By Production Process- Market Insights and Forecast 2022-2032, USD Million
- Market Size & Growth Outlook
- France Sodium Hydroxide Market Statistics, 2022-2032F
- Market Size & Growth Outlook
- By Revenues in USD Million
- Market Segmentation & Growth Outlook
- By Grade- Market Insights and Forecast 2022-2032, USD Million
- By Production Process- Market Insights and Forecast 2022-2032, USD Million
- Market Size & Growth Outlook
- Italy Sodium Hydroxide Market Statistics, 2022-2032F
- Market Size & Growth Outlook
- By Revenues in USD Million
- Market Segmentation & Growth Outlook
- By Grade- Market Insights and Forecast 2022-2032, USD Million
- By Production Process- Market Insights and Forecast 2022-2032, USD Million
- Market Size & Growth Outlook
- UK Sodium Hydroxide Market Statistics, 2022-2032F
- Market Size & Growth Outlook
- By Revenues in USD Million
- Market Segmentation & Growth Outlook
- By Grade- Market Insights and Forecast 2022-2032, USD Million
- By Production Process- Market Insights and Forecast 2022-2032, USD Million
- Market Size & Growth Outlook
- Spain Sodium Hydroxide Market Statistics, 2022-2032F
- Market Size & Growth Outlook
- By Revenues in USD Million
- Market Segmentation & Growth Outlook
- By Grade- Market Insights and Forecast 2022-2032, USD Million
- By Production Process- Market Insights and Forecast 2022-2032, USD Million
- Market Size & Growth Outlook
- Market Size & Growth Outlook
- Middle East & Africa Sodium Hydroxide Market Statistics, 2022-2032F
- Market Size & Growth Outlook
- By Revenues in USD Million
- Market Segmentation & Growth Outlook
- By Grade- Market Insights and Forecast 2022-2032, USD Million
- By Production Process- Market Insights and Forecast 2022-2032, USD Million
- By Application- Market Insights and Forecast 2022-2032, USD Million
- By Country
- Saudi Arabia
- Iran
- Rest of Middle East & Africa
- Saudi Arabia Sodium Hydroxide Market Statistics, 2022-2032F
- Market Size & Growth Outlook
- By Revenues in USD Million
- Market Segmentation & Growth Outlook
- By Grade- Market Insights and Forecast 2022-2032, USD Million
- By Production Process- Market Insights and Forecast 2022-2032, USD Million
- Market Size & Growth Outlook
- Iran Sodium Hydroxide Market Statistics, 2022-2032F
- Market Size & Growth Outlook
- By Revenues in USD Million
- Market Segmentation & Growth Outlook
- By Grade- Market Insights and Forecast 2022-2032, USD Million
- By Production Process- Market Insights and Forecast 2022-2032, USD Million
- Market Size & Growth Outlook
- Market Size & Growth Outlook
- Asia Pacific Sodium Hydroxide Market Statistics, 2022-2032F
- Market Size & Growth Outlook
- By Revenues in USD Million
- Market Segmentation & Growth Outlook
- By Grade- Market Insights and Forecast 2022-2032, USD Million
- By Production Process- Market Insights and Forecast 2022-2032, USD Million
- By Application- Market Insights and Forecast 2022-2032, USD Million
- By Country
- China
- Japan
- India
- Indonesia
- Rest of Asia Pacific
- China Sodium Hydroxide Market Statistics, 2022-2032F
- Market Size & Growth Outlook
- By Revenues in USD Million
- Market Segmentation & Growth Outlook
- By Grade- Market Insights and Forecast 2022-2032, USD Million
- By Production Process- Market Insights and Forecast 2022-2032, USD Million
- Market Size & Growth Outlook
- Japan Sodium Hydroxide Market Statistics, 2022-2032F
- Market Size & Growth Outlook
- By Revenues in USD Million
- Market Segmentation & Growth Outlook
- By Grade- Market Insights and Forecast 2022-2032, USD Million
- By Production Process- Market Insights and Forecast 2022-2032, USD Million
- Market Size & Growth Outlook
- India Sodium Hydroxide Market Statistics, 2022-2032F
- Market Size & Growth Outlook
- By Revenues in USD Million
- Market Segmentation & Growth Outlook
- By Grade- Market Insights and Forecast 2022-2032, USD Million
- By Production Process- Market Insights and Forecast 2022-2032, USD Million
- Market Size & Growth Outlook
- Indonesia Sodium Hydroxide Market Statistics, 2022-2032F
- Market Size & Growth Outlook
- By Revenues in USD Million
- Market Segmentation & Growth Outlook
- By Grade- Market Insights and Forecast 2022-2032, USD Million
- By Production Process- Market Insights and Forecast 2022-2032, USD Million
- Market Size & Growth Outlook
- Market Size & Growth Outlook
- Competitive Outlook
- Company Profiles
- Tata Chemicals Ltd.
- Business Description
- Product Portfolio
- Collaborations & Alliances
- Recent Developments
- Financial Details
- Others
- Olin Corporation
- Business Description
- Product Portfolio
- Collaborations & Alliances
- Recent Developments
- Financial Details
- Others
- Westlake Corporation
- Business Description
- Product Portfolio
- Collaborations & Alliances
- Recent Developments
- Financial Details
- Others
- Occidental Petroleum Corporation
- Business Description
- Product Portfolio
- Collaborations & Alliances
- Recent Developments
- Financial Details
- Others
- Dow Inc
- Business Description
- Product Portfolio
- Collaborations & Alliances
- Recent Developments
- Financial Details
- Others
- BASF SE
- Business Description
- Product Portfolio
- Collaborations & Alliances
- Recent Developments
- Financial Details
- Others
- Nouryon
- Business Description
- Product Portfolio
- Collaborations & Alliances
- Recent Developments
- Financial Details
- Others
- Xinjiang Zhongtai Chemical Co. Ltd.
- Business Description
- Product Portfolio
- Collaborations & Alliances
- Recent Developments
- Financial Details
- Others
- Formosa Plastics Corporation
- Business Description
- Product Portfolio
- Collaborations & Alliances
- Recent Developments
- Financial Details
- Others
- Grasim Industries Limited
- Business Description
- Product Portfolio
- Collaborations & Alliances
- Recent Developments
- Financial Details
- Others
- Kemira Oyj
- Business Description
- Product Portfolio
- Collaborations & Alliances
- Recent Developments
- Financial Details
- Others
- Covestro AG
- Business Description
- Product Portfolio
- Collaborations & Alliances
- Recent Developments
- Financial Details
- Others
- Gujarat Alkalies and Chemicals Ltd
- Business Description
- Product Portfolio
- Collaborations & Alliances
- Recent Developments
- Financial Details
- Others
- Befar Group Co. Ltd.
- Business Description
- Product Portfolio
- Collaborations & Alliances
- Recent Developments
- Financial Details
- Others
- Ineos Group AG
- Business Description
- Product Portfolio
- Collaborations & Alliances
- Recent Developments
- Financial Details
- Others
- Tata Chemicals Ltd.
- Company Profiles
- Disclaimer
| Segment | Sub-Segment |
|---|---|
| By Grade |
|
| By Production Process |
|
| By Application |
|
| By Region |
|
Research Methodology
This study followed a structured approach comprising four key phases to assess the size and scope of the electro-oxidation market. The process began with thorough secondary research to collect data on the target market, related markets, and broader industry context. These findings, along with preliminary assumptions and estimates, were then validated through extensive primary research involving industry experts from across the value chain. To calculate the overall market size, both top-down and bottom-up methodologies were employed. Finally, market segmentation and data triangulation techniques were applied to refine and validate segment-level estimations.
Secondary Research
The secondary research phase involved gathering data from a wide range of credible and published sources. This step helped in identifying industry trends, defining market segmentation, and understanding the market landscape and value chain.
Sources consulted during this phase included:
- Company annual reports, investor presentations, and press releases
- Industry white papers and certified publications
- Trade directories and market-recognized databases
- Articles from authoritative authors and reputable journals
- Gold and silver standard websites
Secondary research was critical in mapping out the industry's value chain and monetary flow, identifying key market segments, understanding regional variations, and tracking significant industry developments.
Other key sources:
- Financial disclosures
- Industry associations and trade bodies
- News outlets and business magazines
- Academic journals and research studies
- Paid industry databases
Primary Research
To validate secondary data and gain deeper market insights, primary research was conducted with key stakeholders across both the supply and demand sides of the market.
On the demand side, participants included decision-makers and influencers from end-user industries—such as CIOs, CTOs, and CSOs—who provided first-hand perspectives on market needs, product usage, and future expectations.
On the supply side, interviews were conducted with manufacturers, industry associations, and institutional participants to gather insights into current offerings, product pipelines, and market challenges.
Primary interviews provided critical inputs such as:
- Market size and revenue data
- Product and service breakdowns
- Market forecasts
- Regional and application-specific trends
Stakeholders consulted included:
- Leading OEM and solution providers
- Channel and distribution partners
- End users across various applications
- Independent consultants and industry specialists
Market Size Estimation and Data Triangulation
- Identifying Key Market Participants (Secondary Research)
- Goal: To identify the major players or companies in the target market. This typically involves using publicly available data sources such as industry reports, market research publications, and financial statements of companies.
- Tools: Reports from firms like Gartner, Forrester, Euromonitor, Statista, IBISWorld, and others. Public financial statements, news articles, and press releases from top market players.
- Extracting Earnings of Key Market Participants
- Goal: To estimate the earnings generated from the product or service being analyzed. This step helps in understanding the revenue potential of each market player in a specific geography.
- Methods: Earnings data can be gathered from:
- Publicly available financial reports (for listed companies).
- Interviews and primary data sources from professionals, such as Directors, VPs, SVPs, etc. This is especially useful for understanding more nuanced, internal data that isn't publicly disclosed.
- Annual reports and investor presentations of key players.
- Data Collation and Development of a Relevant Data Model
- Goal: To collate inputs from both primary and secondary sources into a structured, data-driven model for market estimation. This model will incorporate key market KPIs and any independent variables relevant to the market.
- Key KPIs: These could include:
- Market size, growth rate, and demand drivers.
- Industry-specific metrics like market share, average revenue per customer (ARPC), or average deal size.
- External variables, such as economic growth rates, inflation rates, or commodity prices, that could affect the market.
- Data Modeling: Based on this data, the market forecasts are developed for the next 5 years. A combination of trend analysis, scenario modeling, and statistical regression might be used to generate projections.
- Scenario Analysis
- Goal: To test different assumptions and validate how sensitive the market is to changes in key variables (e.g., market demand, regulatory changes, technological disruptions).
- Types of Scenarios:
- Base Case: Based on current assumptions and historical data.
- Best-Case Scenario: Assuming favorable market conditions, regulatory environments, and technological advancements.
- Worst-Case Scenario: Accounting for adverse factors, such as economic downturns, stricter regulations, or unexpected disruptions.


