Global Sodium Carbonate Market Report: Trends, Growth and Forecast (2026-2032)
By Source (Natural Soda Ash, Synthetic Soda Ash), By Product Type (Dense Soda Ash, Light Soda Ash), By Application (Soap & Detergents, Chemicals, Alumina & Mining, Pulp and Paper, Water Treatment, Others), By Purity Grade (Technical Grade, Food Grade, Pharmaceutical Grade, Ultra-High Purity Grade), By End Use Industry (Glass Manufacturing, Chemical Manufacturing, Pharmaceutical Manufacturing, Food & Beverage Processing, Others), By Region (North America, South America, Europe, Middle East & Africa, Asia Pacific) ... Read more
|
Major Players
|
Global Sodium Carbonate Market Statistics and Insights, 2026
- Market Size Statistics
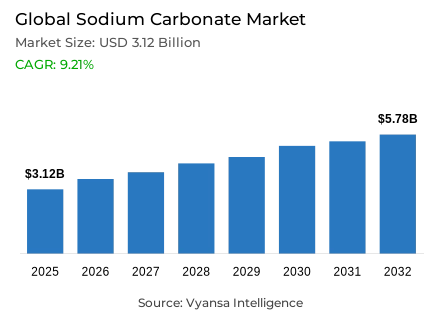
- Sodium carbonate market size in Global was estimated at USD 3.12 billion in 2025.
- The market size is expected to grow to USD 5.78 billion by 2032.
- Market to register a CAGR of around 9.21% during 2026-32.
- Source Shares
- Natural soda ash grabbed market share of 70%.
- Competition
- More than 20 companies are actively engaged in producing sodium carbonate.
- Top 5 companies acquired around 50% of the market share.
- Shandong Haihua; Nirma Limited; Ciner Resources Corporation; Sisecam; WE Soda etc., are few of the top companies.
- End Use Industry
- Glass manufacturing grabbed 50% of the market.
- Region
- Asia Pacific leads with a 60% share of the global market.
Global Sodium Carbonate Market Outlook
The global sodium carbonate market is estimated to grow at a compound growth rate of about 9.21% between 2026 and 2032 to reach USD 5.78 billion by 2032, with an estimated value of USD 3.12 billion in 2025. The glass manufacturing industry is the biggest end-use market, which consumes approximately half of the total demand, due to the use of soda ash in reducing the melting point of silica and improving the clarity of glass.
The construction, packaging, automotive glass, and solar glass are all projected to keep growing and contribute to consumption in the world. The natural soda ash that controls approximately 70% of the market share enjoys a wide trona deposit and low extraction costs in the United States and Turkey. These resources offer long-term supply security and are more in line with the growing sustainability efforts, with many industries moving to carbon-intensive synthetic production.
The governments in North America and Europe promote sustainable production, thus making natural soda ash more popular. The growth of renewable initiatives, the use of solar panels and sodium-ion batteries is expected to open new opportunities in the development of sodium carbonate. Its high purity and chemical stability will also continue to support international demand in the renewable applications, which will support long-term demand projections.
The Asia Pacific market is the most dominant market with almost 60% of the world market share. This growth is fuelled by rapid industrialization and mass production in China, India, and other emerging economies. The continued growth of glass, detergent, and chemical industries, as well as the constant increase in capacity, will keep Asia Pacific as a production and consumption center until 2032.

Global Sodium Carbonate Market Growth Driver
Rising Industrial Utilization in Glass Production
The glass manufacturing industry continues to account for the largest share, accounts for about 45% of the soda ash use in the United States in 2024. The aggregate demand is strong, driven by the increase in the construction, packaging glass, and automotive glass manufacturing, where sodium carbonate improves the clarity and lowers the melting point of silica.
It is estimated that the world will produce 73 million tonnes in 2024, with the largest trona producing nations having large reserves and using the latest processing methods, which will guarantee a stable and affordable supply. New uses in solar glass and sodium-ion battery technologies also add to consumption in clean-energy sectors. The high purity and stability of the material are likely to retain its vital position in advanced technologies.
Global Sodium Carbonate Market Challenge
Sustainability Pressures and Environmental Constraints
The tightening of global environmental regulations and increasingly ambitious emission-reduction targets is creating mounting compliance and operational pressures across production systems. Man-made production pathways are more energy-consuming and carbon-intensive as compared to natural extraction processes. Low-emission manufacturing is being encouraged by governments in North America and Europe, with producers being encouraged to invest in trona-based extraction and other energy-efficient technologies. Other reasons that have led to low demand in the glass industry are the enhanced recycling activities especially in the glass industry which lower the intensity of soda ash without affecting the demand of glass.
Natural trona reserves, including those in the Green River Basin in Wyoming, are estimated to be about 47 billion tonnes, which can be used to produce over a number of decades. Trona is mined annually in excess of 15 million tonnes, producing approximately 8.3 million tonnes of soda ash, with additional reserves at Searles and Owens Lakes (810 million tonnes) ensuring continuity of supply. Natural soda ash is becoming more acceptable in the global market in the face of increased focus on sustainability.
Unlock Market Intelligence
Explore the market potential with our data-driven report
Global Sodium Carbonate Market Trend
Expanding Demand from Renewable and Industrial Applications
The increased attention to clean energy and renewable technology is opening new consumption opportunities of sodium carbonate. In 2024, U.S. exports of soda ash increased by 11% and domestic production increased by 10% in six plants with a combined annual production of 13.9 million tonnes. New industrial demand in energy storage and electric-mobility is being driven by critical applications in sodium-ion batteries, which are cost-effective alternatives to lithium-ion systems.
Other major forces are the increase in the production of solar glasses, in which sodium carbonate enhances the melting of ultra-clear photovoltaic glasses. In 2023, several new plants were commissioned that added 5 million tonnes of capacity per year, highlighting a further move towards energy-linked applications. This reorganization is likely to continue market momentum into the next decade.
Global Sodium Carbonate Market Opportunity
Strategic Growth Prospects Across Global Supply Chains
Expanding production capacities and strengthening logistics integration are expected to reshape the sodium carbonate value chain in the coming years, positioning the U.S. to enhance supply efficiency, cost optimization, and global competitiveness. Production of soda ash was estimated at USD 2.5 billion in 2024, of which over half was exported to meet the high demand in other countries. The industry employment was close to 2,400, which indicates stable operations and a well-developed industrial ecosystem.
To strengthen competitiveness, producers are investing in automation, energy optimization, and export diversification. The market is evolving due to steady industrial development in emerging economies and the harmonization of supply and clean-manufacturing policies. With the high demand in the glass, chemicals and renewable energy industries, global supply chains are re-setting to balance the regional production benefits with end-uses that are sustainability-oriented.
Global Sodium Carbonate Market Regional Analysis

By Region
- North America
- South America
- Europe
- Middle East & Africa
- Asia Pacific
The Asia Pacific is the dominant region in the Global Sodium Carbonate Market, with share of aroud 60%. This is due to large-scale industrialization and its key role in the manufacturing of glass, detergents, and chemicals within the region. China leads global production with 36 million tons in 2024, followed by major capacity expansions of 5 million tons annually since mid-2023. The growing glass industry and renewable infrastructure in India further reinforces regional strength.
In all, China, the United States, and Turkey accounted for 81% of the total soda ash produced in 2024, thus ensuring a fairly stable supply base to meet global demand. Increasing exports from Asia Pacific and capacity additions to support solar and sodium-ion battery applications underline the region's dominance in both consumption and production. Continued investment in cleaner technologies and efficient logistics will sustain Asia Pacific's leadership through 2032.
Unlock Market Intelligence
Explore the market potential with our data-driven report
Global Sodium Carbonate Market Segmentation Analysis
By Source
- Natural Soda Ash
- Synthetic Soda Ash
The highest share under the category Source in 2025 is contributed by Natural Soda Ash with a share of about 70%. Of the 73 million tonnes produced globally in 2024, 24 million tonnes were natural soda ash, which was supported by low extraction costs and reduced energy consumption. The United States, with 12 million tonnes, and Turkey, with 11 million tonnes, are leading producers of natural soda ash, enabled by vast trona reserves and well-developed processing infrastructure.
By contrast, synthetic soda ash comprised 49 million tonnes, regionally concentrated in high volume within Asia. However, with increasing sustainability regulations and expanding carbon-reduction initiatives, the trend is for industries to increasingly turn toward naturally sourced soda ash to reduce environmental footprints and guarantee long-term raw material security.

By End Use Industry
- Glass Manufacturing
- Chemical Manufacturing
- Pharmaceutical Manufacturing
- Food & Beverage Processing
- Others
Glass Manufacturing will have the largest share, about 50%, in the segment of End Use Industry in 2025 due to the fact that soda ash is an essential fluxing agent which improves melting efficiency and enhances the quality of glass. This leadership position continues to be sustained by high consumption levels in construction, automotive, and packaging glass. Demand from solar glass manufacturers has also gone up substantially with the expansion in renewable energy projects.
Other industries consuming sodium carbonate include chemicals at 29%, soaps and detergents at 5%, flue gas desulfurization at 3%, while pulp and paper and water treatment are at 1% each. With the developments of large-scale glass and energy transition projects worldwide, this segment still is the cornerstone of soda ash consumption in industrial applications.
Market Players in Global Sodium Carbonate Market
These market players maintain a significant presence in the Global sodium carbonate market sector and contribute to its ongoing evolution.
- Shandong Haihua
- Nirma Limited
- Ciner Resources Corporation
- Sisecam
- WE Soda
- Solvay
- Tata Chemicals
- Sanyou Chemical
- Ciech
- Hubei Yuhua/Yihua
- Haohua Honghe Chemical
- Bashkir Soda Company
- OCI Chemical Corporation
- Searles Valley Minerals
- GHCL
Frequently Asked Questions
Related Report
1. Market Segmentation
1.1. Research Scope
1.2. Research Methodology
1.3. Definitions and Assumptions
2. Executive Summary
3. Global Sodium Carbonate Market Policies, Regulations, and Standards
4. Global Sodium Carbonate Market Dynamics
4.1. Growth Factors
4.2. Challenges
4.3. Trends
4.4. Opportunities
5. Global Sodium Carbonate Market Statistics, 2022-2032F
5.1. Market Size & Growth Outlook
5.1.1.By Revenues in USD Million
5.2. Market Segmentation & Growth Outlook
5.2.1.By Source
5.2.1.1. Natural Soda Ash- Market Insights and Forecast 2022-2032, USD Million
5.2.1.2. Synthetic Soda Ash- Market Insights and Forecast 2022-2032, USD Million
5.2.2.By Product Type
5.2.2.1. Dense Soda Ash- Market Insights and Forecast 2022-2032, USD Million
5.2.2.2. Light Soda Ash- Market Insights and Forecast 2022-2032, USD Million
5.2.3.By Application
5.2.3.1. Soap & Detergents- Market Insights and Forecast 2022-2032, USD Million
5.2.3.2. Chemicals- Market Insights and Forecast 2022-2032, USD Million
5.2.3.3. Alumina & Mining- Market Insights and Forecast 2022-2032, USD Million
5.2.3.4. Pulp and Paper- Market Insights and Forecast 2022-2032, USD Million
5.2.3.5. Water Treatment- Market Insights and Forecast 2022-2032, USD Million
5.2.3.6. Others- Market Insights and Forecast 2022-2032, USD Million
5.2.4.By Purity Grade
5.2.4.1. Technical Grade- Market Insights and Forecast 2022-2032, USD Million
5.2.4.2. Food Grade- Market Insights and Forecast 2022-2032, USD Million
5.2.4.3. Pharmaceutical Grade- Market Insights and Forecast 2022-2032, USD Million
5.2.4.4. Ultra-High Purity Grade- Market Insights and Forecast 2022-2032, USD Million
5.2.5.By End Use Industry
5.2.5.1. Glass Manufacturing- Market Insights and Forecast 2022-2032, USD Million
5.2.5.2. Chemical Manufacturing- Market Insights and Forecast 2022-2032, USD Million
5.2.5.3. Pharmaceutical Manufacturing- Market Insights and Forecast 2022-2032, USD Million
5.2.5.4. Food & Beverage Processing- Market Insights and Forecast 2022-2032, USD Million
5.2.5.5. Others- Market Insights and Forecast 2022-2032, USD Million
5.2.6.By Region
5.2.6.1. North America
5.2.6.2. South America
5.2.6.3. Europe
5.2.6.4. Middle East & Africa
5.2.6.5. Asia Pacific
5.2.7.By Competitors
5.2.7.1. Competition Characteristics
5.2.7.2. Market Share & Analysis
6. North America Sodium Carbonate Market Statistics, 2022-2032F
6.1. Market Size & Growth Outlook
6.1.1.By Revenues in USD Million
6.2. Market Segmentation & Growth Outlook
6.2.1.By Source- Market Insights and Forecast 2022-2032, USD Million
6.2.2.By Product Type- Market Insights and Forecast 2022-2032, USD Million
6.2.3.By Application- Market Insights and Forecast 2022-2032, USD Million
6.2.4.By Purity Grade- Market Insights and Forecast 2022-2032, USD Million
6.2.5.By End Use Industry- Market Insights and Forecast 2022-2032, USD Million
6.2.6.By Country
6.2.6.1. United States
6.2.6.2. Canada
6.2.6.3. Mexico
6.2.6.4. Rest of North America
6.3. United States Sodium Carbonate Market Statistics, 2022-2032F
6.3.1.Market Size & Growth Outlook
6.3.1.1. By Revenues in USD Million
6.3.2.Market Segmentation & Growth Outlook
6.3.2.1. By Source- Market Insights and Forecast 2022-2032, USD Million
6.3.2.2. By Product Type- Market Insights and Forecast 2022-2032, USD Million
6.4. Canada Sodium Carbonate Market Statistics, 2022-2032F
6.4.1.Market Size & Growth Outlook
6.4.1.1. By Revenues in USD Million
6.4.2.Market Segmentation & Growth Outlook
6.4.2.1. By Source- Market Insights and Forecast 2022-2032, USD Million
6.4.2.2. By Product Type- Market Insights and Forecast 2022-2032, USD Million
6.5. Mexico Sodium Carbonate Market Statistics, 2022-2032F
6.5.1.Market Size & Growth Outlook
6.5.1.1. By Revenues in USD Million
6.5.2.Market Segmentation & Growth Outlook
6.5.2.1. By Source- Market Insights and Forecast 2022-2032, USD Million
6.5.2.2. By Product Type- Market Insights and Forecast 2022-2032, USD Million
7. South America Sodium Carbonate Market Statistics, 2022-2032F
7.1. Market Size & Growth Outlook
7.1.1.By Revenues in USD Million
7.2. Market Segmentation & Growth Outlook
7.2.1.By Source- Market Insights and Forecast 2022-2032, USD Million
7.2.2.By Product Type- Market Insights and Forecast 2022-2032, USD Million
7.2.3.By Application- Market Insights and Forecast 2022-2032, USD Million
7.2.4.By Purity Grade- Market Insights and Forecast 2022-2032, USD Million
7.2.5.By End Use Industry- Market Insights and Forecast 2022-2032, USD Million
7.2.6.By Country
7.2.6.1. Brazil
7.2.6.2. Argentina
7.2.6.3. Chile
7.2.6.4. Rest of South America
7.3. Brazil Sodium Carbonate Market Statistics, 2022-2032F
7.3.1.Market Size & Growth Outlook
7.3.1.1. By Revenues in USD Million
7.3.2.Market Segmentation & Growth Outlook
7.3.2.1. By Source- Market Insights and Forecast 2022-2032, USD Million
7.3.2.2. By Product Type- Market Insights and Forecast 2022-2032, USD Million
7.4. Argentina Sodium Carbonate Market Statistics, 2022-2032F
7.4.1.Market Size & Growth Outlook
7.4.1.1. By Revenues in USD Million
7.4.2.Market Segmentation & Growth Outlook
7.4.2.1. By Source- Market Insights and Forecast 2022-2032, USD Million
7.4.2.2. By Product Type- Market Insights and Forecast 2022-2032, USD Million
7.5. Chile Sodium Carbonate Market Statistics, 2022-2032F
7.5.1.Market Size & Growth Outlook
7.5.1.1. By Revenues in USD Million
7.5.2.Market Segmentation & Growth Outlook
7.5.2.1. By Source- Market Insights and Forecast 2022-2032, USD Million
7.5.2.2. By Product Type- Market Insights and Forecast 2022-2032, USD Million
8. Europe Sodium Carbonate Market Statistics, 2022-2032F
8.1. Market Size & Growth Outlook
8.1.1.By Revenues in USD Million
8.2. Market Segmentation & Growth Outlook
8.2.1.By Source- Market Insights and Forecast 2022-2032, USD Million
8.2.2.By Product Type- Market Insights and Forecast 2022-2032, USD Million
8.2.3.By Application- Market Insights and Forecast 2022-2032, USD Million
8.2.4.By Purity Grade- Market Insights and Forecast 2022-2032, USD Million
8.2.5.By End Use Industry- Market Insights and Forecast 2022-2032, USD Million
8.2.6.By Country
8.2.6.1. Russia
8.2.6.2. Germany
8.2.6.3. Poland
8.2.6.4. United Kingdom
8.2.6.5. France
8.2.6.6. Rest of Europe
8.3. Russia Sodium Carbonate Market Statistics, 2022-2032F
8.3.1.Market Size & Growth Outlook
8.3.1.1. By Revenues in USD Million
8.3.2.Market Segmentation & Growth Outlook
8.3.2.1. By Source- Market Insights and Forecast 2022-2032, USD Million
8.3.2.2. By Product Type- Market Insights and Forecast 2022-2032, USD Million
8.4. Germany Sodium Carbonate Market Statistics, 2022-2032F
8.4.1.Market Size & Growth Outlook
8.4.1.1. By Revenues in USD Million
8.4.2.Market Segmentation & Growth Outlook
8.4.2.1. By Source- Market Insights and Forecast 2022-2032, USD Million
8.4.2.2. By Product Type- Market Insights and Forecast 2022-2032, USD Million
8.5. Poland Sodium Carbonate Market Statistics, 2022-2032F
8.5.1.Market Size & Growth Outlook
8.5.1.1. By Revenues in USD Million
8.5.2.Market Segmentation & Growth Outlook
8.5.2.1. By Source- Market Insights and Forecast 2022-2032, USD Million
8.5.2.2. By Product Type- Market Insights and Forecast 2022-2032, USD Million
8.6. United Kingdom Sodium Carbonate Market Statistics, 2022-2032F
8.6.1.Market Size & Growth Outlook
8.6.1.1. By Revenues in USD Million
8.6.2.Market Segmentation & Growth Outlook
8.6.2.1. By Source- Market Insights and Forecast 2022-2032, USD Million
8.6.2.2. By Product Type- Market Insights and Forecast 2022-2032, USD Million
8.7. France Sodium Carbonate Market Statistics, 2022-2032F
8.7.1.Market Size & Growth Outlook
8.7.1.1. By Revenues in USD Million
8.7.2.Market Segmentation & Growth Outlook
8.7.2.1. By Source- Market Insights and Forecast 2022-2032, USD Million
8.7.2.2. By Product Type- Market Insights and Forecast 2022-2032, USD Million
9. Middle East & Africa Sodium Carbonate Market Statistics, 2022-2032F
9.1. Market Size & Growth Outlook
9.1.1.By Revenues in USD Million
9.2. Market Segmentation & Growth Outlook
9.2.1.By Source- Market Insights and Forecast 2022-2032, USD Million
9.2.2.By Product Type- Market Insights and Forecast 2022-2032, USD Million
9.2.3.By Application- Market Insights and Forecast 2022-2032, USD Million
9.2.4.By Purity Grade- Market Insights and Forecast 2022-2032, USD Million
9.2.5.By End Use Industry- Market Insights and Forecast 2022-2032, USD Million
9.2.6.By Country
9.2.6.1. Egypt
9.2.6.2. Saudi Arabia
9.2.6.3. United Arab Emirates
9.2.6.4. South Africa
9.2.6.5. Kenya
9.2.6.6. Rest of Middle East & Africa
9.3. Egypt Sodium Carbonate Market Statistics, 2022-2032F
9.3.1.Market Size & Growth Outlook
9.3.1.1. By Revenues in USD Million
9.3.2.Market Segmentation & Growth Outlook
9.3.2.1. By Source- Market Insights and Forecast 2022-2032, USD Million
9.3.2.2. By Product Type- Market Insights and Forecast 2022-2032, USD Million
9.4. Saudi Arabia Sodium Carbonate Market Statistics, 2022-2032F
9.4.1.Market Size & Growth Outlook
9.4.1.1. By Revenues in USD Million
9.4.2.Market Segmentation & Growth Outlook
9.4.2.1. By Source- Market Insights and Forecast 2022-2032, USD Million
9.4.2.2. By Product Type- Market Insights and Forecast 2022-2032, USD Million
9.5. United Arab Emirates Sodium Carbonate Market Statistics, 2022-2032F
9.5.1.Market Size & Growth Outlook
9.5.1.1. By Revenues in USD Million
9.5.2.Market Segmentation & Growth Outlook
9.5.2.1. By Source- Market Insights and Forecast 2022-2032, USD Million
9.5.2.2. By Product Type- Market Insights and Forecast 2022-2032, USD Million
9.6. South Africa Sodium Carbonate Market Statistics, 2022-2032F
9.6.1.Market Size & Growth Outlook
9.6.1.1. By Revenues in USD Million
9.6.2.Market Segmentation & Growth Outlook
9.6.2.1. By Source- Market Insights and Forecast 2022-2032, USD Million
9.6.2.2. By Product Type- Market Insights and Forecast 2022-2032, USD Million
9.7. Kenya Sodium Carbonate Market Statistics, 2022-2032F
9.7.1.Market Size & Growth Outlook
9.7.1.1. By Revenues in USD Million
9.7.2.Market Segmentation & Growth Outlook
9.7.2.1. By Source- Market Insights and Forecast 2022-2032, USD Million
9.7.2.2. By Product Type- Market Insights and Forecast 2022-2032, USD Million
10. Asia Pacific Sodium Carbonate Market Statistics, 2022-2032F
10.1. Market Size & Growth Outlook
10.1.1. By Revenues in USD Million
10.2. Market Segmentation & Growth Outlook
10.2.1. By Source- Market Insights and Forecast 2022-2032, USD Million
10.2.2. By Product Type- Market Insights and Forecast 2022-2032, USD Million
10.2.3. By Application- Market Insights and Forecast 2022-2032, USD Million
10.2.4. By Purity Grade- Market Insights and Forecast 2022-2032, USD Million
10.2.5. By End Use Industry- Market Insights and Forecast 2022-2032, USD Million
10.2.6. By Country
10.2.6.1. China
10.2.6.2. India
10.2.6.3. Japan
10.2.6.4. South Korea
10.2.6.5. Australia
10.2.6.6. Rest of Asia Pacific
10.3. China Sodium Carbonate Market Statistics, 2022-2032F
10.3.1. Market Size & Growth Outlook
10.3.1.1. By Revenues in USD Million
10.3.2. Market Segmentation & Growth Outlook
10.3.2.1. By Source- Market Insights and Forecast 2022-2032, USD Million
10.3.2.2. By Product Type- Market Insights and Forecast 2022-2032, USD Million
10.4. India Sodium Carbonate Market Statistics, 2022-2032F
10.4.1. Market Size & Growth Outlook
10.4.1.1. By Revenues in USD Million
10.4.2. Market Segmentation & Growth Outlook
10.4.2.1. By Source- Market Insights and Forecast 2022-2032, USD Million
10.4.2.2. By Product Type- Market Insights and Forecast 2022-2032, USD Million
10.5. Japan Sodium Carbonate Market Statistics, 2022-2032F
10.5.1. Market Size & Growth Outlook
10.5.1.1. By Revenues in USD Million
10.5.2. Market Segmentation & Growth Outlook
10.5.2.1. By Source- Market Insights and Forecast 2022-2032, USD Million
10.5.2.2. By Product Type- Market Insights and Forecast 2022-2032, USD Million
10.6. South Korea Sodium Carbonate Market Statistics, 2022-2032F
10.6.1. Market Size & Growth Outlook
10.6.1.1. By Revenues in USD Million
10.6.2. Market Segmentation & Growth Outlook
10.6.2.1. By Source- Market Insights and Forecast 2022-2032, USD Million
10.6.2.2. By Product Type- Market Insights and Forecast 2022-2032, USD Million
10.7. Australia Sodium Carbonate Market Statistics, 2022-2032F
10.7.1. Market Size & Growth Outlook
10.7.1.1. By Revenues in USD Million
10.7.2. Market Segmentation & Growth Outlook
10.7.2.1. By Source- Market Insights and Forecast 2022-2032, USD Million
10.7.2.2. By Product Type- Market Insights and Forecast 2022-2032, USD Million
11. Competitive Outlook
11.1. Company Profiles
11.1.1. Sisecam
11.1.1.1. Business Description
11.1.1.2. Product Portfolio
11.1.1.3. Collaborations & Alliances
11.1.1.4. Recent Developments
11.1.1.5. Financial Details
11.1.1.6. Others
11.1.2. WE Soda
11.1.2.1. Business Description
11.1.2.2. Product Portfolio
11.1.2.3. Collaborations & Alliances
11.1.2.4. Recent Developments
11.1.2.5. Financial Details
11.1.2.6. Others
11.1.3. Solvay
11.1.3.1. Business Description
11.1.3.2. Product Portfolio
11.1.3.3. Collaborations & Alliances
11.1.3.4. Recent Developments
11.1.3.5. Financial Details
11.1.3.6. Others
11.1.4. Tata Chemicals
11.1.4.1. Business Description
11.1.4.2. Product Portfolio
11.1.4.3. Collaborations & Alliances
11.1.4.4. Recent Developments
11.1.4.5. Financial Details
11.1.4.6. Others
11.1.5. Sanyou Chemical
11.1.5.1. Business Description
11.1.5.2. Product Portfolio
11.1.5.3. Collaborations & Alliances
11.1.5.4. Recent Developments
11.1.5.5. Financial Details
11.1.5.6. Others
11.1.6. Shandong Haihua
11.1.6.1. Business Description
11.1.6.2. Product Portfolio
11.1.6.3. Collaborations & Alliances
11.1.6.4. Recent Developments
11.1.6.5. Financial Details
11.1.6.6. Others
11.1.7. Nirma Limited
11.1.7.1. Business Description
11.1.7.2. Product Portfolio
11.1.7.3. Collaborations & Alliances
11.1.7.4. Recent Developments
11.1.7.5. Financial Details
11.1.7.6. Others
11.1.8. Ciner Resources Corporation
11.1.8.1. Business Description
11.1.8.2. Product Portfolio
11.1.8.3. Collaborations & Alliances
11.1.8.4. Recent Developments
11.1.8.5. Financial Details
11.1.8.6. Others
11.1.9. Ciech
11.1.9.1. Business Description
11.1.9.2. Product Portfolio
11.1.9.3. Collaborations & Alliances
11.1.9.4. Recent Developments
11.1.9.5. Financial Details
11.1.9.6. Others
11.1.10. Hubei Yuhua/Yihua
11.1.10.1.Business Description
11.1.10.2.Product Portfolio
11.1.10.3.Collaborations & Alliances
11.1.10.4.Recent Developments
11.1.10.5.Financial Details
11.1.10.6.Others
11.1.11. Haohua Honghe Chemical
11.1.11.1.Business Description
11.1.11.2.Product Portfolio
11.1.11.3.Collaborations & Alliances
11.1.11.4.Recent Developments
11.1.11.5.Financial Details
11.1.11.6.Others
11.1.12. Bashkir Soda Company
11.1.12.1.Business Description
11.1.12.2.Product Portfolio
11.1.12.3.Collaborations & Alliances
11.1.12.4.Recent Developments
11.1.12.5.Financial Details
11.1.12.6.Others
11.1.13. OCI Chemical Corporation
11.1.13.1.Business Description
11.1.13.2.Product Portfolio
11.1.13.3.Collaborations & Alliances
11.1.13.4.Recent Developments
11.1.13.5.Financial Details
11.1.13.6.Others
11.1.14. Searles Valley Minerals
11.1.14.1.Business Description
11.1.14.2.Product Portfolio
11.1.14.3.Collaborations & Alliances
11.1.14.4.Recent Developments
11.1.14.5.Financial Details
11.1.14.6.Others
11.1.15. GHCL
11.1.15.1.Business Description
11.1.15.2.Product Portfolio
11.1.15.3.Collaborations & Alliances
11.1.15.4.Recent Developments
11.1.15.5.Financial Details
11.1.15.6.Others
12. Disclaimer
| Segment | Sub-Segment |
|---|---|
| By Source |
|
| By Product Type |
|
| By Application |
|
| By Purity Grade |
|
| By End Use Industry |
|
| By Region |
|
Research Methodology
This study followed a structured approach comprising four key phases to assess the size and scope of the electro-oxidation market. The process began with thorough secondary research to collect data on the target market, related markets, and broader industry context. These findings, along with preliminary assumptions and estimates, were then validated through extensive primary research involving industry experts from across the value chain. To calculate the overall market size, both top-down and bottom-up methodologies were employed. Finally, market segmentation and data triangulation techniques were applied to refine and validate segment-level estimations.
Secondary Research
The secondary research phase involved gathering data from a wide range of credible and published sources. This step helped in identifying industry trends, defining market segmentation, and understanding the market landscape and value chain.
Sources consulted during this phase included:
- Company annual reports, investor presentations, and press releases
- Industry white papers and certified publications
- Trade directories and market-recognized databases
- Articles from authoritative authors and reputable journals
- Gold and silver standard websites
Secondary research was critical in mapping out the industry's value chain and monetary flow, identifying key market segments, understanding regional variations, and tracking significant industry developments.
Other key sources:
- Financial disclosures
- Industry associations and trade bodies
- News outlets and business magazines
- Academic journals and research studies
- Paid industry databases
Primary Research
To validate secondary data and gain deeper market insights, primary research was conducted with key stakeholders across both the supply and demand sides of the market.
On the demand side, participants included decision-makers and influencers from end-user industries—such as CIOs, CTOs, and CSOs—who provided first-hand perspectives on market needs, product usage, and future expectations.
On the supply side, interviews were conducted with manufacturers, industry associations, and institutional participants to gather insights into current offerings, product pipelines, and market challenges.
Primary interviews provided critical inputs such as:
- Market size and revenue data
- Product and service breakdowns
- Market forecasts
- Regional and application-specific trends
Stakeholders consulted included:
- Leading OEM and solution providers
- Channel and distribution partners
- End users across various applications
- Independent consultants and industry specialists
Market Size Estimation and Data Triangulation
- Identifying Key Market Participants (Secondary Research)
- Goal: To identify the major players or companies in the target market. This typically involves using publicly available data sources such as industry reports, market research publications, and financial statements of companies.
- Tools: Reports from firms like Gartner, Forrester, Euromonitor, Statista, IBISWorld, and others. Public financial statements, news articles, and press releases from top market players.
- Extracting Earnings of Key Market Participants
- Goal: To estimate the earnings generated from the product or service being analyzed. This step helps in understanding the revenue potential of each market player in a specific geography.
- Methods: Earnings data can be gathered from:
- Publicly available financial reports (for listed companies).
- Interviews and primary data sources from professionals, such as Directors, VPs, SVPs, etc. This is especially useful for understanding more nuanced, internal data that isn't publicly disclosed.
- Annual reports and investor presentations of key players.
- Data Collation and Development of a Relevant Data Model
- Goal: To collate inputs from both primary and secondary sources into a structured, data-driven model for market estimation. This model will incorporate key market KPIs and any independent variables relevant to the market.
- Key KPIs: These could include:
- Market size, growth rate, and demand drivers.
- Industry-specific metrics like market share, average revenue per customer (ARPC), or average deal size.
- External variables, such as economic growth rates, inflation rates, or commodity prices, that could affect the market.
- Data Modeling: Based on this data, the market forecasts are developed for the next 5 years. A combination of trend analysis, scenario modeling, and statistical regression might be used to generate projections.
- Scenario Analysis
- Goal: To test different assumptions and validate how sensitive the market is to changes in key variables (e.g., market demand, regulatory changes, technological disruptions).
- Types of Scenarios:
- Base Case: Based on current assumptions and historical data.
- Best-Case Scenario: Assuming favorable market conditions, regulatory environments, and technological advancements.
- Worst-Case Scenario: Accounting for adverse factors, such as economic downturns, stricter regulations, or unexpected disruptions.


