Global Polylactic Acid Intermediates Market Report: Trends, Growth and Forecast (2026-2032)
By Purity Grade (Industrial Grade, Food Grade, Medical Grade), By Application (Packaging, Bioplastics, Textile Fibers, Automotive, Medical Devices), By Region (North America, Latin America, Europe, Asia Pacific) ... Read more
|
Major Players
|
Global Polylactic Acid Intermediates Market Statistics and Insights, 2026
- Market Size Statistics
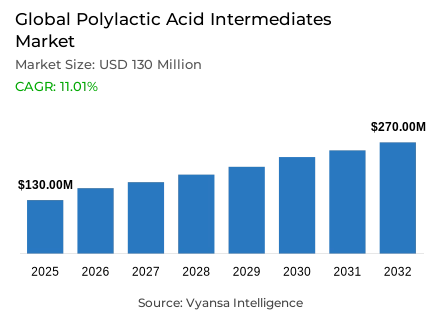
- Global polylactic acid intermediates market is estimated at USD 130 million in 2025.
- The market size is expected to grow to USD 270 million by 2032.
- Market to register a CAGR of around 11.01% during 2026-32.
- Purity Grade Shares
- Industrial grade grabbed market share of 60%.
- Competition
- Global polylactic acid intermediates market is currently being catered to by more than 15 companies.
- Top 5 companies acquired around 60% of the market share.
- Shanghai Tong-jie-liang Biomaterials, Futerro S.A., Synbra Technology, NatureWorks LLC, TotalEnergies Corbion etc., are few of the top companies.
- Application
- Packaging grabbed 40% of the market.
- Region
- Asia Pacific leads with a 45% share of the global market.
Global Polylactic Acid Intermediates Market Outlook
The Global polylactic acid (PLA) intermediates market is estimated at USD 130 million in 2025 and is expected to grow at a CAGR of about 11.01% between 2026 and 2032 with a valuation of about USD 270 million in 2032. Regulatory clarity in key economies, especially in packaging-related applications, plays a significant role in this growth trend. The European Union Packaging and Packaging Waste Regulation contains binding directives that require converters and end users to shift to materials that meet the requirements of recycled content, reuse, and material reduction. These regulatory necessities create a predictable demand landscape, allowing end users to strategize long-term changes towards compliant polymers, including PLA intermediates, thus supporting consistent volume growth over the forecast horizon.
Industrial Grade PLA has a leading 60% market share in the purity-grade market. It has been able to lead due to a synergistic balance of cost efficiency, compatibility in processing and regulatory conformity, particularly in extrusion and injection molding processes. Industrial-grade variants are favored by end users since they meet industrial compostability requirements without requiring complicated formulations or high input prices. This uniformity simplifies the qualification of converters that work within strict compliance schedules, which further strengthens industrial-grade PLA as the foundation of intermediate demand in high-volume applications.
The largest end-use segment is packaging, which constitutes about 40% of the total demand. The ability of PLA to provide structural integrity, optical transparency, and certified compostability is suitable to packaging formats like bottles, trays, films, and rigid containers. Continued regulatory pressure on single-use plastics and the minimization of packaging waste remains to cement the adoption of PLA in this industry, and other uses are progressing at a slower rate because of infrastructure requirements.
Asia Pacific dominates the global market with a 45% share, which is supported by a concentrated production capacity, stable access to agricultural feedstock, and closeness to key packaging end users. Strong manufacturing ecosystems across the region facilitate effective supply chains, making Asia Pacific a core location of PLA intermediates by 2032.

Global Polylactic Acid Intermediates Market Growth Driver
Regulatory Mandates Driving Material Demand
The Packaging and Packaging Waste Regulation (PPWR) of the European Union, which was adopted in December 2024 and published in January 2025, has introduced binding targets of packaging-waste reduction and recycled-content targets that are transforming material specifications in end-user segments. The minimum recycled-content requirements under the PPWR are 30% single-use beverage bottle recycling by 2030 and 65% by 2040, and 40% transport and sales packaging reuse by 2030 and 70% by 2040. These regulatory requirements force converters to use materials that can facilitate compliance, thus directly driving the demand of certified PLA intermediates that can be used to achieve structural integrity and recyclability, especially as the packaging designs will need to reduce the amount of void space and total material consumption starting on 1 January 2030. This generates a regulatory-based volume push to PLA and other compliant polymers that can meet the changing EU demands.
In China, the government policy has strengthened material limits by its 2020 Opinions on further strengthening the control of plastic pollution, which prohibited single-use plastic straws and has led to significant enforcement measures, such as fines and seizures. The existence of these parallel regulatory frameworks in key areas is an indicator of long-term policy commitments to impose material-specific restrictions instead of short-term interventions, which creates predictable demand drivers of PLA intermediates. To the end user in packaging and other related applications, this regulatory clarity minimizes the risk of investment and allows long-term planning of material transitions. PLA intermediates can be critical inputs to converters that serve regulated geographies by matching product specifications with required market-access requirements, making regulatory compliance part of the procurement decision.
Global Polylactic Acid Intermediates Market Challenge
Performance Limitations of PLA in Uncontrolled Environments
Polylactic acid (PLA) has been shown to have serious biodegradation limitations under uncontrolled environmental conditions, which restricts its applicability in some end-user applications, especially where unintended release to the marine or natural ecosystem can occur. According to peer-reviewed studies, PLA did not lose more than 2.5% of its mass in 600 days under simulated marine conditions, and bottles and bags only degraded 3-4% in the actual marine environment. These performance constraints are based on the polymer chemistry of PLA that necessitates thermophilic industrial composting conditions of about 58°C to be effectively biodegraded. According to ISO 14855 standards, PLA has to transform 90% of organic carbon to carbon dioxide within 180 days to be certified as compostable, which is impossible in uncontrolled environments.
This limitation is also applied to deep-sea and subsurface disposal conditions where rigid forms of PLA including polylactic acid PLLA exhibit no degradation, in contrast to some polyhydroxyalkanoate substitutes which exhibit some but slow degradation at depth. With regulatory frameworks and scientific advice placing more emphasis on the reliance of biodegradation performance on access to industrial composting infrastructure, end users who lack access to certified systems are limited in their application of PLA. This technical constraint is therefore a structural market constraint, which directs demand to areas and industries with compatible waste-management systems and restricts the overall environmental attractiveness of the material in uncontrolled end-of-life situations.
Unlock Market Intelligence
Explore the market potential with our data-driven report
Global Polylactic Acid Intermediates Market Trend
Expansion of Production Capacity Aligning with Regulatory Timelines
The world bioplastics capacity to produce PLA intermediates is experiencing a rapid growth in capacity due to regulatory confidence and increased end-user demand. According to industry data, the global production capacity was about 2.18 million tonnes in 2023, and it is expected to reach about 7.43 million tonnes in 2028, which represents a greater than three-fold increase in infrastructure over five years. This expansion is geographically spread in Asia, Europe, and North America, matching investment schedules with regulatory compliance deadlines, including those set by the EU PPWR. The magnitude and speed of these investments are indicative of maturation of production infrastructure, and thus, the alleviation of historical supply constraints that once impeded PLA adoption in mainstream end-user applications.
The rates of capacity utilization also indicate the reinforcement of the fundamentals of demand that underpin infrastructure build-out, with global PLA intermediates production at approximately 72% utilization in 2025. This level of utilization implies that there is a significant margin of capacity to be converted into output without causing price pressures. Capacity additions between 2025 and 2028 will concentrate capacity to address demand spikes related to compliance, and will lower execution risk to end users switching to PLA-based product portfolios. With maturity of infrastructure, supply availability and consistency improves market confidence, allowing wider end-user acceptance and more predictable procurement approaches in regulated and sustainability-oriented markets.
Global Polylactic Acid Intermediates Market Opportunity
Standardized Compliance Pathways Supporting Market Access
The procurement and specification strategies in the end-user segments of PLA intermediates are being influenced by regulatory compliance requirements and harmonized performance requirements. The PPWR of the EU provides binding compostability criteria of designated packaging formats, thus differentiating between compliance-based material uptake and voluntary sustainability efforts by associating non-compliance with the inability to access the market. These regulatory limits establish structural demand of PLA intermediates that can attain certified compostability, which strengthens long-term material planning and investment by converters. Regulatory frameworks promote the use of materials with internationally accepted certification routes to facilitate multi-jurisdictional market access by defining clear performance expectations.
International standards like ISO 14855 and ASTM D6400 offer internationally consistent requirements of PLA biodegradation under controlled industrial composting environments, such as set targets of carbon dioxide evolution, physical disintegration, and ecotoxicity. The harmonization of EU, US and global standards allows converters to seek single material qualifications that meet various regional standards. To end users, the presence of harmonized compliance routes simplifies the process of choosing and certifying materials, creating a long-term demand of PLA intermediates regardless of price fluctuations or new competitor technologies. Consequently, the trend in procurement patterns is towards regulatory determinants, making certified PLA a cornerstone of sustainable material strategies.
Global Polylactic Acid Intermediates Market Regional Analysis

By Region
- North America
- Latin America
- Europe
- Asia Pacific
Asia Pacific commands a significant 45% share of the Global polylactic acid (PLA) intermediates market, underpinned by established feedstock availability, concentrated manufacturing infrastructure, and proximity to high-growth packaging demand centers. Regional clustering of bioplastics production—accounting for approximately 70% of global capacity with major hubs in China, India, and Southeast Asia—creates supply network advantages that support end-user access to intermediates. The convergence of low-cost feedstock sources such as corn, sugarcane, and cassava with expanding regulatory adoption across India, Japan, and other Asia Pacific economies amplifies regional competitive advantages in PLA supply and technology development.
This regional concentration also facilitates inventory optimization and distribution efficiencies for converters operating across Asia Pacific markets, enhancing responsiveness to demand shifts and compliance deadlines. End users benefit from localized production ecosystems that reduce lead times and logistical costs while supporting compliance with evolving sustainability regulations. As regulatory frameworks in regional economies increasingly align with global standards, Asia Pacific’s dominant position is likely to sustain, reinforcing its role as a primary PLA intermediates supplier to both domestic and export markets.
Unlock Market Intelligence
Explore the market potential with our data-driven report
Global Polylactic Acid Intermediates Market Segmentation Analysis
By Purity Grade
- Industrial Grade
- Food Grade
- Medical Grade
Industrial Grade PLA commands the lead in the purity grade segment, capturing 60% market share due to its balance of performance, processability, and cost efficiency for extrusion and injection molding applications. End users prioritize this grade for its ability to meet standard processing requirements while delivering the structural clarity, dimensional stability, and industrial compostability necessary to satisfy regulatory mandates without the added expense of premium additives or specialized thermal management. The predominance of industrial grade reflects converter preferences for baseline material specifications that support compliance and maintain competitive production economics.
The widespread adoption of Industrial Grade PLA reinforces consistent downstream demand for intermediate polymers, as volume displacement mechanisms favor this specification over advanced formulations in dominant packaging segments. End users optimizing compliance costs and profit margins find industrial grade PLA aligns with both regulatory thresholds and operational realities, enabling faster qualification cycles and broader application penetration. This segment’s dominance underscores its role as a structural volume driver, establishing baseline intermediates demand independent of niche or high-performance alternatives. As regulatory and market forces converge, industrial grade PLA remains central to converter strategies across primary end-use categories.

By Application
- Packaging
- Bioplastics
- Textile Fibers
- Automotive
- Medical Devices
Within the Global polylactic acid (PLA) intermediates market, packaging applications represent the preeminent end-use segment with 40% share, driven by regulatory mandates and the imperative to reduce single-use plastic waste. PLA’s suitability for a range of packaging formats-including bottles, trays, films, and rigid containers—positions it as a preferred resin in sectors transitioning toward certified industrial compostability. End users in food and beverage, personal care, and consumer goods packaging leverage PLA’s mechanical properties and compliance credentials to meet stringent regulatory timelines while preserving product performance attributes such as clarity and strength.
Beyond packaging, emerging applications in textiles, agricultural films, and consumer durables are gaining traction as technology improvements and waste management infrastructure evolve. However, the rate of adoption in these segments depends on end users’ access to compliant waste processing and industrial composting systems, given PLA’s performance limitations in uncontrolled environments. Application diversity is expanding, but packaging remains the dominant driver of volume demand, reflecting both regulatory alignment and converter prioritization of segments with established end-of-life infrastructure. This segmentation landscape highlights how material characteristics and compliance requirements jointly shape demand patterns across end-use categories.
Market Players in Global Polylactic Acid Intermediates Market
These market players maintain a significant presence in the Global polylactic acid intermediates market sector and contribute to its ongoing evolution.
- Shanghai Tong-jie-liang Biomaterials
- Futerro S.A.
- Synbra Technology
- NatureWorks LLC
- TotalEnergies Corbion
- Zhejiang Hisun Biomaterials
- COFCO Biochemical
- Jiangsu Supla / Supla Bioplastics
- Evonik
- Sulzer
- BenQ Materials / BenQ Green
- SynBalance
- Jiangxi Keyuan Bio-Material
- Shanghai Kingfa
Market News & Updates
- NatureWorks LLC, 2025:
NatureWorks completed full construction and commenced operations at its integrated polylactic acid manufacturing facility in Nakhon Sawan, Thailand in 2025 with 75,000 tonnes annual production capacity. The facility represents a fully integrated complex incorporating fermentation, lactide monomer production, and polymerization lines producing the complete Ingeo PLA portfolio from renewable sugarcane feedstock sourced within a 50-kilometer radius of the plant. In March 2025, NatureWorks launched the Ingeo Extend 4950D platform—the first grade enabling 7x stretch efficiency in the transverse direction for biaxially-oriented polylactic acid (BOPLA) film production, allowing manufacturers to achieve increased efficiency without requiring capital equipment replacement for converters already utilizing polypropylene-designed machinery.
Frequently Asked Questions
Related Report
- Market Segmentation
- Research Scope
- Research Methodology
- Definitions and Assumptions
- Executive Summary
- Global Polylactic Acid (PLA) Intermediates Market Policies, Regulations, and Standards
- Global Polylactic Acid (PLA) Intermediates Market Dynamics
- Growth Factors
- Challenges
- Trends
- Opportunities
- Global Polylactic Acid (PLA) Intermediates Market Statistics, 2022-2032F
- Market Size & Growth Outlook
- By Revenues in USD Million
- Market Segmentation & Growth Outlook
- By Purity Grade
- Industrial Grade- Market Insights and Forecast 2022-2032, USD Million
- Food Grade- Market Insights and Forecast 2022-2032, USD Million
- Medical Grade- Market Insights and Forecast 2022-2032, USD Million
- By Application
- Packaging- Market Insights and Forecast 2022-2032, USD Million
- Bioplastics- Market Insights and Forecast 2022-2032, USD Million
- Textile Fibers- Market Insights and Forecast 2022-2032, USD Million
- Automotive- Market Insights and Forecast 2022-2032, USD Million
- Medical Devices- Market Insights and Forecast 2022-2032, USD Million
- By Region
- North America
- Latin America
- Europe
- Asia Pacific
- By Competitors
- Competition Characteristics
- Market Share & Analysis
- By Purity Grade
- Market Size & Growth Outlook
- North America Polylactic Acid (PLA) Intermediates Market Statistics, 2022-2032F
- Market Size & Growth Outlook
- By Revenues in USD Million
- Market Segmentation & Growth Outlook
- By Purity Grade- Market Insights and Forecast 2022-2032, USD Million
- By Application- Market Insights and Forecast 2022-2032, USD Million
- By Country
- US
- Canada
- Mexico
- Rest of North America
- US Polylactic Acid (PLA) Intermediates Market Statistics, 2022-2032F
- Market Size & Growth Outlook
- By Revenues in USD Million
- Market Segmentation & Growth Outlook
- By Purity Grade- Market Insights and Forecast 2022-2032, USD Million
- By Application- Market Insights and Forecast 2022-2032, USD Million
- Market Size & Growth Outlook
- Canada Polylactic Acid (PLA) Intermediates Market Statistics, 2022-2032F
- Market Size & Growth Outlook
- By Revenues in USD Million
- Market Segmentation & Growth Outlook
- By Purity Grade- Market Insights and Forecast 2022-2032, USD Million
- By Application- Market Insights and Forecast 2022-2032, USD Million
- Market Size & Growth Outlook
- Mexico Polylactic Acid (PLA) Intermediates Market Statistics, 2022-2032F
- Market Size & Growth Outlook
- By Revenues in USD Million
- Market Segmentation & Growth Outlook
- By Purity Grade- Market Insights and Forecast 2022-2032, USD Million
- By Application- Market Insights and Forecast 2022-2032, USD Million
- Market Size & Growth Outlook
- Market Size & Growth Outlook
- Latin America Polylactic Acid (PLA) Intermediates Market Statistics, 2022-2032F
- Market Size & Growth Outlook
- By Revenues in USD Million
- Market Segmentation & Growth Outlook
- By Purity Grade- Market Insights and Forecast 2022-2032, USD Million
- By Application- Market Insights and Forecast 2022-2032, USD Million
- By Country
- Brazil
- Rest of Latin America
- Brazil Polylactic Acid (PLA) Intermediates Market Statistics, 2022-2032F
- Market Size & Growth Outlook
- By Revenues in USD Million
- Market Segmentation & Growth Outlook
- By Purity Grade- Market Insights and Forecast 2022-2032, USD Million
- By Application- Market Insights and Forecast 2022-2032, USD Million
- Market Size & Growth Outlook
- Market Size & Growth Outlook
- Europe Polylactic Acid (PLA) Intermediates Market Statistics, 2022-2032F
- Market Size & Growth Outlook
- By Revenues in USD Million
- Market Segmentation & Growth Outlook
- By Purity Grade- Market Insights and Forecast 2022-2032, USD Million
- By Application- Market Insights and Forecast 2022-2032, USD Million
- By Country
- Germany
- France
- UK
- Italy
- Spain
- Netherlands
- Belgium
- Poland
- Russia
- Turkey
- Rest of Europe
- Germany Polylactic Acid (PLA) Intermediates Market Statistics, 2022-2032F
- Market Size & Growth Outlook
- By Revenues in USD Million
- Market Segmentation & Growth Outlook
- By Purity Grade- Market Insights and Forecast 2022-2032, USD Million
- By Application- Market Insights and Forecast 2022-2032, USD Million
- Market Size & Growth Outlook
- France Polylactic Acid (PLA) Intermediates Market Statistics, 2022-2032F
- Market Size & Growth Outlook
- By Revenues in USD Million
- Market Segmentation & Growth Outlook
- By Purity Grade- Market Insights and Forecast 2022-2032, USD Million
- By Application- Market Insights and Forecast 2022-2032, USD Million
- Market Size & Growth Outlook
- UK Polylactic Acid (PLA) Intermediates Market Statistics, 2022-2032F
- Market Size & Growth Outlook
- By Revenues in USD Million
- Market Segmentation & Growth Outlook
- By Purity Grade- Market Insights and Forecast 2022-2032, USD Million
- By Application- Market Insights and Forecast 2022-2032, USD Million
- Market Size & Growth Outlook
- Italy Polylactic Acid (PLA) Intermediates Market Statistics, 2022-2032F
- Market Size & Growth Outlook
- By Revenues in USD Million
- Market Segmentation & Growth Outlook
- By Purity Grade- Market Insights and Forecast 2022-2032, USD Million
- By Application- Market Insights and Forecast 2022-2032, USD Million
- Market Size & Growth Outlook
- Spain Polylactic Acid (PLA) Intermediates Market Statistics, 2022-2032F
- Market Size & Growth Outlook
- By Revenues in USD Million
- Market Segmentation & Growth Outlook
- By Purity Grade- Market Insights and Forecast 2022-2032, USD Million
- By Application- Market Insights and Forecast 2022-2032, USD Million
- Market Size & Growth Outlook
- Netherlands Polylactic Acid (PLA) Intermediates Market Statistics, 2022-2032F
- Market Size & Growth Outlook
- By Revenues in USD Million
- Market Segmentation & Growth Outlook
- By Purity Grade- Market Insights and Forecast 2022-2032, USD Million
- By Application- Market Insights and Forecast 2022-2032, USD Million
- Market Size & Growth Outlook
- Belgium Polylactic Acid (PLA) Intermediates Market Statistics, 2022-2032F
- Market Size & Growth Outlook
- By Revenues in USD Million
- Market Segmentation & Growth Outlook
- By Purity Grade- Market Insights and Forecast 2022-2032, USD Million
- By Application- Market Insights and Forecast 2022-2032, USD Million
- Market Size & Growth Outlook
- Poland Polylactic Acid (PLA) Intermediates Market Statistics, 2022-2032F
- Market Size & Growth Outlook
- By Revenues in USD Million
- Market Segmentation & Growth Outlook
- By Purity Grade- Market Insights and Forecast 2022-2032, USD Million
- By Application- Market Insights and Forecast 2022-2032, USD Million
- Market Size & Growth Outlook
- Russia Polylactic Acid (PLA) Intermediates Market Statistics, 2022-2032F
- Market Size & Growth Outlook
- By Revenues in USD Million
- Market Segmentation & Growth Outlook
- By Purity Grade- Market Insights and Forecast 2022-2032, USD Million
- By Application- Market Insights and Forecast 2022-2032, USD Million
- Market Size & Growth Outlook
- Turkey Polylactic Acid (PLA) Intermediates Market Statistics, 2022-2032F
- Market Size & Growth Outlook
- By Revenues in USD Million
- Market Segmentation & Growth Outlook
- By Purity Grade- Market Insights and Forecast 2022-2032, USD Million
- By Application- Market Insights and Forecast 2022-2032, USD Million
- Market Size & Growth Outlook
- Market Size & Growth Outlook
- Asia Pacific Polylactic Acid (PLA) Intermediates Market Statistics, 2022-2032F
- Market Size & Growth Outlook
- By Revenues in USD Million
- Market Segmentation & Growth Outlook
- By Purity Grade- Market Insights and Forecast 2022-2032, USD Million
- By Application- Market Insights and Forecast 2022-2032, USD Million
- By Country
- China
- India
- Japan
- South Korea
- Australia
- Thailand
- Rest of Asia Pacific
- China Polylactic Acid (PLA) Intermediates Market Statistics, 2022-2032F
- Market Size & Growth Outlook
- By Revenues in USD Million
- Market Segmentation & Growth Outlook
- By Purity Grade- Market Insights and Forecast 2022-2032, USD Million
- By Application- Market Insights and Forecast 2022-2032, USD Million
- Market Size & Growth Outlook
- India Polylactic Acid (PLA) Intermediates Market Statistics, 2022-2032F
- Market Size & Growth Outlook
- By Revenues in USD Million
- Market Segmentation & Growth Outlook
- By Purity Grade- Market Insights and Forecast 2022-2032, USD Million
- By Application- Market Insights and Forecast 2022-2032, USD Million
- Market Size & Growth Outlook
- Japan Polylactic Acid (PLA) Intermediates Market Statistics, 2022-2032F
- Market Size & Growth Outlook
- By Revenues in USD Million
- Market Segmentation & Growth Outlook
- By Purity Grade- Market Insights and Forecast 2022-2032, USD Million
- By Application- Market Insights and Forecast 2022-2032, USD Million
- Market Size & Growth Outlook
- South Korea Polylactic Acid (PLA) Intermediates Market Statistics, 2022-2032F
- Market Size & Growth Outlook
- By Revenues in USD Million
- Market Segmentation & Growth Outlook
- By Purity Grade- Market Insights and Forecast 2022-2032, USD Million
- By Application- Market Insights and Forecast 2022-2032, USD Million
- Market Size & Growth Outlook
- Australia Polylactic Acid (PLA) Intermediates Market Statistics, 2022-2032F
- Market Size & Growth Outlook
- By Revenues in USD Million
- Market Segmentation & Growth Outlook
- By Purity Grade- Market Insights and Forecast 2022-2032, USD Million
- By Application- Market Insights and Forecast 2022-2032, USD Million
- Market Size & Growth Outlook
- Thailand Polylactic Acid (PLA) Intermediates Market Statistics, 2022-2032F
- Market Size & Growth Outlook
- By Revenues in USD Million
- Market Segmentation & Growth Outlook
- By Purity Grade- Market Insights and Forecast 2022-2032, USD Million
- By Application- Market Insights and Forecast 2022-2032, USD Million
- Market Size & Growth Outlook
- Market Size & Growth Outlook
- Competitive Outlook
- Company Profiles
- NatureWorks LLC
- Business Description
- Product Portfolio
- Collaborations & Alliances
- Recent Developments
- Financial Details
- Others
- TotalEnergies Corbion (Total Corbion PLA)
- Business Description
- Product Portfolio
- Collaborations & Alliances
- Recent Developments
- Financial Details
- Others
- Zhejiang Hisun Biomaterials
- Business Description
- Product Portfolio
- Collaborations & Alliances
- Recent Developments
- Financial Details
- Others
- COFCO Biochemical
- Business Description
- Product Portfolio
- Collaborations & Alliances
- Recent Developments
- Financial Details
- Others
- Jiangsu Supla / Supla Bioplastics
- Business Description
- Product Portfolio
- Collaborations & Alliances
- Recent Developments
- Financial Details
- Others
- Shanghai Tong-jie-liang Biomaterials
- Business Description
- Product Portfolio
- Collaborations & Alliances
- Recent Developments
- Financial Details
- Others
- Futerro S.A.
- Business Description
- Product Portfolio
- Collaborations & Alliances
- Recent Developments
- Financial Details
- Others
- Synbra Technology
- Business Description
- Product Portfolio
- Collaborations & Alliances
- Recent Developments
- Financial Details
- Others
- Evonik (specialty PLA services / partners)
- Business Description
- Product Portfolio
- Collaborations & Alliances
- Recent Developments
- Financial Details
- Others
- Sulzer (contract manufacturing partners)
- Business Description
- Product Portfolio
- Collaborations & Alliances
- Recent Developments
- Financial Details
- Others
- BenQ Materials / BenQ Green
- Business Description
- Product Portfolio
- Collaborations & Alliances
- Recent Developments
- Financial Details
- Others
- SynBalance / regional PLA producers
- Business Description
- Product Portfolio
- Collaborations & Alliances
- Recent Developments
- Financial Details
- Others
- Jiangxi Keyuan Bio-Material
- Business Description
- Product Portfolio
- Collaborations & Alliances
- Recent Developments
- Financial Details
- Others
- Shanghai Kingfa
- Business Description
- Product Portfolio
- Collaborations & Alliances
- Recent Developments
- Financial Details
- Others
- NatureWorks LLC
- Company Profiles
- Disclaimer
| Segment | Sub-Segment |
|---|---|
| By Purity Grade |
|
| By Application |
|
| By Region |
|
Research Methodology
This study followed a structured approach comprising four key phases to assess the size and scope of the electro-oxidation market. The process began with thorough secondary research to collect data on the target market, related markets, and broader industry context. These findings, along with preliminary assumptions and estimates, were then validated through extensive primary research involving industry experts from across the value chain. To calculate the overall market size, both top-down and bottom-up methodologies were employed. Finally, market segmentation and data triangulation techniques were applied to refine and validate segment-level estimations.
Secondary Research
The secondary research phase involved gathering data from a wide range of credible and published sources. This step helped in identifying industry trends, defining market segmentation, and understanding the market landscape and value chain.
Sources consulted during this phase included:
- Company annual reports, investor presentations, and press releases
- Industry white papers and certified publications
- Trade directories and market-recognized databases
- Articles from authoritative authors and reputable journals
- Gold and silver standard websites
Secondary research was critical in mapping out the industry's value chain and monetary flow, identifying key market segments, understanding regional variations, and tracking significant industry developments.
Other key sources:
- Financial disclosures
- Industry associations and trade bodies
- News outlets and business magazines
- Academic journals and research studies
- Paid industry databases
Primary Research
To validate secondary data and gain deeper market insights, primary research was conducted with key stakeholders across both the supply and demand sides of the market.
On the demand side, participants included decision-makers and influencers from end-user industries—such as CIOs, CTOs, and CSOs—who provided first-hand perspectives on market needs, product usage, and future expectations.
On the supply side, interviews were conducted with manufacturers, industry associations, and institutional participants to gather insights into current offerings, product pipelines, and market challenges.
Primary interviews provided critical inputs such as:
- Market size and revenue data
- Product and service breakdowns
- Market forecasts
- Regional and application-specific trends
Stakeholders consulted included:
- Leading OEM and solution providers
- Channel and distribution partners
- End users across various applications
- Independent consultants and industry specialists
Market Size Estimation and Data Triangulation
- Identifying Key Market Participants (Secondary Research)
- Goal: To identify the major players or companies in the target market. This typically involves using publicly available data sources such as industry reports, market research publications, and financial statements of companies.
- Tools: Reports from firms like Gartner, Forrester, Euromonitor, Statista, IBISWorld, and others. Public financial statements, news articles, and press releases from top market players.
- Extracting Earnings of Key Market Participants
- Goal: To estimate the earnings generated from the product or service being analyzed. This step helps in understanding the revenue potential of each market player in a specific geography.
- Methods: Earnings data can be gathered from:
- Publicly available financial reports (for listed companies).
- Interviews and primary data sources from professionals, such as Directors, VPs, SVPs, etc. This is especially useful for understanding more nuanced, internal data that isn't publicly disclosed.
- Annual reports and investor presentations of key players.
- Data Collation and Development of a Relevant Data Model
- Goal: To collate inputs from both primary and secondary sources into a structured, data-driven model for market estimation. This model will incorporate key market KPIs and any independent variables relevant to the market.
- Key KPIs: These could include:
- Market size, growth rate, and demand drivers.
- Industry-specific metrics like market share, average revenue per customer (ARPC), or average deal size.
- External variables, such as economic growth rates, inflation rates, or commodity prices, that could affect the market.
- Data Modeling: Based on this data, the market forecasts are developed for the next 5 years. A combination of trend analysis, scenario modeling, and statistical regression might be used to generate projections.
- Scenario Analysis
- Goal: To test different assumptions and validate how sensitive the market is to changes in key variables (e.g., market demand, regulatory changes, technological disruptions).
- Types of Scenarios:
- Base Case: Based on current assumptions and historical data.
- Best-Case Scenario: Assuming favorable market conditions, regulatory environments, and technological advancements.
- Worst-Case Scenario: Accounting for adverse factors, such as economic downturns, stricter regulations, or unexpected disruptions.


