Global Calcium Hydroxide Market Report: Trends, Growth and Forecast (2026-2032)
By Grade Type (Pharma Grade, Food Grade, Technical Grade), By Form (Powder, Granules, Slurry, Paste), By Purity (90-95%, 95-98%, 98-99%, 99% and above), By Application (Paper and Pulp Industry, Water Treatment, Food and Beverages, Chemical and Pharmaceutical Industry, Others), By Region (North America, South America, Europe, Middle East & Africa, Asia Pacific) ... Read more
|
Major Players
|
Global Calcium Hydroxide Market Statistics and Insights, 2026
- Market Size Statistics
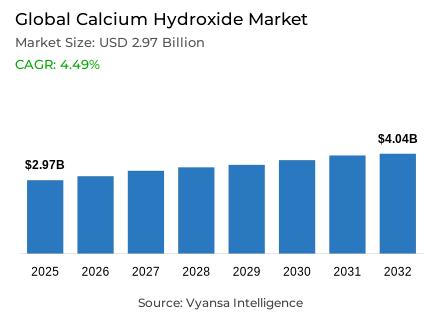
- Global calcium hydroxide market is estimated at USD 2.97 billion in 2025.
- The market size is expected to grow to USD 4.04 billion by 2032.
- Market to register a CAGR of around 4.49% during 2026-32.
- Grade Type Shares
- Technical grade grabbed market share of 60%.
- Competition
- Global calcium hydroxide market is currently being catered to by more than 25 companies.
- Top 5 companies acquired around 55% of the market share.
- Nordkalk Corporation; United States Lime & Minerals Inc.; Omya AG; Lhoist Group; Carmeuse etc., are few of the top companies.
- Application
- Water treatment grabbed 35% of the market.
- Region
- Asia Pacific leads with a 45% share of the global market.
Global Calcium Hydroxide Market Outlook
The Global calcium hydroxide market is estimated at USD 2.97 billion in 2025 and is expected to reach USD 4.04 billion in 2032 with a CAGR of about 4.49% between 2026 and 2032. The growth in this period is pegged on non-discretionary demand of basic public infrastructure, especially drinking water and wastewater treatment. The endemic lack of access to safely managed drinking water is a structural characteristic, and in 2024, about 2.1 billion individuals globally still lack access to such water. Despite the fact that the global coverage has been enhanced since 2015, the progress is still not enough to achieve the universal access goals by 2030, which requires the continued growth of municipal treatment capacity, where the role of calcium hydroxide is paramount.
The trends in urbanisation and financing of infrastructure also contribute to the stability of demand in the long term. Infrastructure investment in the world recovered sharply following 2022, with private investment increasing by approximately 10% in 2023. In rapidly growing economies like India, the demands of urban infrastructure are enormous, and resilient and green investment demands are projected to reach USD 2.4 trillion by 2050 as urban populations almost double. This growth directly boosts the demand of water and wastewater treatment chemicals, making calcium hydroxide a cornerstone input in South Asia, Southeast Asia, and some parts of Africa where access shortages are still concentrated.
Technical-grade calcium hydroxide has a leading market share of 60%, product wise. This indicates its significance in controlled uses where chemical uniformity and performance dependability are crucial. The largest application segment is water treatment, which consumes 35% of the world consumption, due to its use in pH control, reduction of hardness, pathogen control, and neutralisation of wastewater. This segment is comparatively immune to economic cycles because of the public health and regulatory demands.
Asia Pacific dominates the Global Calcium Hydroxide Market by a 45% share regionally. The population density, ongoing urban expansion, and significant water access challenges underpin sustained investment of the long-term investment in treatment facilities. The role of government-led programmes and climate resilience priorities in the region strengthens its role as the main demand centre by 2032.

Global Calcium Hydroxide Market Growth Driver
Expanding Water Infrastructure as a Structural Demand Catalyst
The chronic deficits in the availability of safely managed drinking water continue to form the basis of long-term demand fundamentals for calcium hydroxide. WHO and UNICEF data indicate that in 2024, some 2.1 billion individuals in the global population continue to lack access to safely managed drinking water, which underscores the scale of unmet basic service provision in emerging economies. Although the UN Statistics Division states that the coverage has increased to 74% in 2024 compared to 68% in 2015, the current rate is still significantly lower than the level required to reach the universal access goals by 2030. This deficiency requires a long-term increase in municipal water treatment capacity, where calcium hydroxide is essential in the adjustment of pH, elimination of hardness, and the control of pathogens in drinking water systems.
This demand trend is further supported by the urban growth and infrastructure financing trends. Infrastructure investment at the global level has recovered to higher levels than the 2018–2022 averages, and the increase in private infrastructure investment is estimated at about 10% in 2023. It is estimated that India alone will need USD 2.4 trillion in resilient and green urban infrastructure investment by 2050, as its urban population is set to nearly double. This growth directly translates into non-discretionary demand for water and wastewater treatment chemicals, thus making calcium hydroxide a cornerstone input in Africa, South Asia, and Southeast Asia, where access shortages remain.
Global Calcium Hydroxide Market Challenge
Tightening Environmental Regulations Increasing Cost Pressures
Environmental compliance requirements are becoming a key operational constraint for calcium hydroxide manufacturers worldwide. In March 2024, the U.S. Environmental Protection Agency approved more stringent PM2.5 standards, lowering the annual limit to 9.0 µg/m³, with estimated net health benefits of USD 46 billion by 2032. Such stricter limits have a direct impact on lime kilns and hydration plants that produce particulate emissions, forcing manufacturers to invest in sophisticated filtration, dust suppression, and constant monitoring systems to stay within the limits.
The pressure of regulation is also increasing in Europe. The updated EU Industrial Emissions Directive (EU 2024/1785) that comes into force in August 2024 has more stringent values of emission limits, digital permitting, and penalties of up to 3% of annual EU turnover in the case of serious non-compliance. These are applicable to industrial minerals and mining operations, which adds to the capital expenditure and administrative complexity. Smaller producers, especially, experience margin compression because of small economies of scale, and regulatory compliance is a significant impediment to capacity expansion despite structurally increasing downstream demand by regulated end-user sectors.
Unlock Market Intelligence
Explore the market potential with our data-driven report
Global Calcium Hydroxide Market Trend
Energy Storage and Grid Stability Creating Adjacent Demand Channels
The fast worldwide deployment of battery energy storage systems is transforming the industrial material demand patterns, which indirectly affects the consumption of calcium hydroxide. By June 2025, India had deployed about 490 MWh of energy storage capacity, and utilities had granted over 20 GWh of standalone projects between April 2024 and October 2025. By October 2025, storage capacity in the United States had reached 37.4 GW, reflecting a 32% year-to-date increase, and an indication of a fundamental change to storage-based power systems.
This infrastructure growth is indicative of more general structural transformations in electricity systems. According to the International Energy Agency, the average battery prices dropped to approximately USD 70/kWh in 2025, which expedited the implementation as electricity demand increased by 4.3% in 2024 through electrification and industrialization. Massive storage facilities demand high-resilience grid protection, thermal control, and environmental control systems, which present new applications of industrial minerals and chemicals. Although still a secondary outlet, this trend increases the applicability of calcium hydroxide beyond its traditional water and emissions control uses into the emerging energy infrastructure ecosystems.
Global Calcium Hydroxide Market Opportunity
Climate-Resilient Urban Investment as a Long-Term Growth Avenue
International climate resilience commitments are creating a sustainable investment channel in water and sanitation infrastructure, which has a direct impact on calcium hydroxide demand. World Bank analysis shows that USD 6.9 trillion of infrastructure investment per year is needed by 2030 to meet Sustainable Development Goals and Paris Agreement targets, with subnational governments contributing almost 69% of climate-resilient investment. Water and wastewater systems are also prominent, as they are used in the protection of the public health and reduction of the disaster risks.
The opportunity scale is demonstrated by evidence in emerging economies. Settlement development in high flood-prone regions in India has grown more than 100% in the period between 1985 and 2015, and the risk of pluvial flooding is expected to shoot up by 2070. Water and sanitation are some of the priority areas of adaptation that OECD assessments determine need integrated physical and chemical inputs. With the growth of multilateral development banks in climate-related financing, municipal projects are increasingly specifying proven treatment chemicals. This convergence of adaptation policy, availability of financing, and urban vulnerability presents a multiyear opportunity landscape for calcium hydroxide suppliers serving regulated end-user infrastructure projects.
Global Calcium Hydroxide Market Regional Analysis

By Region
- North America
- South America
- Europe
- Middle East & Africa
- Asia Pacific
Asia Pacific commands 45% of the Global calcium hydroxide market, establishing it as the leading regional market. The region encompasses approximately 4.6 billion people, representing around 60% of the world’s population, with water access challenges particularly acute in countries such as Indonesia, Pakistan, and the Philippines. WHO/UNICEF Joint Monitoring Programme data released in 2025 indicate that more than half of the population in several of these economies still lacks safely managed drinking water, necessitating extensive treatment capacity expansion.
Government-led infrastructure programs reinforce this position. India’s urban population is projected to rise from about 480 million to 951 million by 2050, driving large-scale investment in climate-resilient water systems. Southeast Asian economies are upgrading treatment and emissions control facilities alongside industrial growth, while Japan and South Korea emphasize high-specification purification and compliance solutions. Collectively, these dynamics sustain Asia Pacific’s role as the primary growth engine for the Global calcium hydroxide market.
Unlock Market Intelligence
Explore the market potential with our data-driven report
Global Calcium Hydroxide Market Segmentation Analysis
By Grade Type
- Pharma grade
- Food grade
- Technical grade
Grade-based segmentation highlights the clear dominance of technical grade calcium hydroxide, which accounts for about 60% of the global market. This leadership reflects its essential role in applications where chemical consistency, purity, and performance reliability are non-negotiable. Municipal drinking water treatment facilities depend on technical grade material to ensure precise pH control and regulatory compliance, while industrial wastewater treatment relies on predictable reactivity for metal precipitation and acid neutralization. Air emissions control systems similarly require uniform particle characteristics to meet tightening environmental standards.
The remaining 40% share comprises standard and specialty grades serving less specification-intensive uses. Agricultural soil conditioning and certain construction applications prioritize cost efficiency over stringent purity thresholds, allowing broader grade flexibility. The sustained 60% dominance of technical grade underscores structural demand concentration in regulated sectors, where end users face strict public health and environmental obligations. These requirements raise entry barriers and favor established producers capable of maintaining quality assurance, reinforcing technical grade’s central position within the Global calcium hydroxide market.

By Application
- Paper and Pulp Industry
- Water Treatment
- Food and Beverages
- Chemical and Pharmaceutical Industry
- Others
Water treatment applications represent the highest-share segment at 35% of global calcium hydroxide consumption. Municipal drinking water treatment represents the core sub-segment, where lime is used for pH adjustment, hardness reduction through softening, and pathogen control. Industrial and municipal wastewater treatment further reinforce this segment, as calcium hydroxide enables neutralization of acidic effluents, heavy metal precipitation, and improved sludge handling, while meeting regulatory discharge standards.
The remaining demand is distributed across construction, emissions control, pulp and paper, and other industrial uses. Construction-related consumption benefits from sustained infrastructure spending, while flue gas treatment demand is rising in response to stricter EPA and EU air quality regulations introduced in 2024. Water treatment’s prominence reflects regulatory mandates, public health imperatives, and relative insensitivity to economic cycles, making it the most stable demand anchor for calcium hydroxide producers.
Market Players in Global Calcium Hydroxide Market
These market players maintain a significant presence in the Global calcium hydroxide market sector and contribute to its ongoing evolution.
- Nordkalk Corporation
- United States Lime & Minerals Inc.
- Omya AG
- Lhoist Group
- Carmeuse
- Graymont Limited
- Mississippi Lime Company
- Minerals Technologies Inc.
- Hydrite Chemical Co.
- Boral Ltd.
- Calcinor SA
- Singleton Birch Ltd.
- Huber Engineered Materials
- Jost Chemical Co.
- Sigma Minerals Ltd.
Market News & Updates
- Lhoist Group, 2025:
Lhoist Group operates comprehensive calcium hydroxide-based solutions for water and wastewater treatment serving industrial and municipal applications across Europe, with product portfolios specifically engineered for pH neutralization, metal precipitation, silica removal, and fluoride treatment addressing stricter environmental regulations. The company provides tailored formulations of hydrated lime and milk of lime reagents optimized for drinking water softening, industrial wastewater management, municipal sewage treatment, and desalination applications, supporting regulatory compliance in water quality management.
- Carmeuse, 2025:
Carmeuse maintains high-calcium hydrated lime portfolios serving industrial, food-grade, and construction applications with the POTABILIS joint venture operational as of 2025 for sustainable lime production and water treatment solutions. The company's product offerings include specialized hydrated lime formulations for water and wastewater treatment, with its POTABILIS venture dedicated to sustainable lime manufacturing practices supporting environmental compliance and efficient resource utilization across European water treatment infrastructure.
Frequently Asked Questions
Related Report
1. Market Segmentation
1.1. Research Scope
1.2. Research Methodology
1.3. Definitions and Assumptions
2. Executive Summary
3. Global Calcium Hydroxide Market Policies, Regulations, and Standards
4. Global Calcium Hydroxide Market Dynamics
4.1. Growth Factors
4.2. Challenges
4.3. Trends
4.4. Opportunities
5. Global Calcium Hydroxide Market Statistics, 2022-2032F
5.1. Market Size & Growth Outlook
5.1.1.By Revenues in USD Million
5.2. Market Segmentation & Growth Outlook
5.2.1.By Grade Type
5.2.1.1. Pharma Grade- Market Insights and Forecast 2022-2032, USD Million
5.2.1.2. Food Grade- Market Insights and Forecast 2022-2032, USD Million
5.2.1.3. Technical Grade- Market Insights and Forecast 2022-2032, USD Million
5.2.2.By Form
5.2.2.1. Powder- Market Insights and Forecast 2022-2032, USD Million
5.2.2.2. Granules- Market Insights and Forecast 2022-2032, USD Million
5.2.2.3. Slurry- Market Insights and Forecast 2022-2032, USD Million
5.2.2.4. Paste- Market Insights and Forecast 2022-2032, USD Million
5.2.3.By Purity
5.2.3.1. 90-95%- Market Insights and Forecast 2022-2032, USD Million
5.2.3.2. 95-98%- Market Insights and Forecast 2022-2032, USD Million
5.2.3.3. 98-99%- Market Insights and Forecast 2022-2032, USD Million
5.2.3.4. 99% and above- Market Insights and Forecast 2022-2032, USD Million
5.2.4.By Application
5.2.4.1. Paper and Pulp Industry- Market Insights and Forecast 2022-2032, USD Million
5.2.4.2. Water Treatment- Market Insights and Forecast 2022-2032, USD Million
5.2.4.3. Food and Beverages- Market Insights and Forecast 2022-2032, USD Million
5.2.4.4. Chemical and Pharmaceutical Industry- Market Insights and Forecast 2022-2032, USD Million
5.2.4.5. Others- Market Insights and Forecast 2022-2032, USD Million
5.2.5.By Region
5.2.5.1. North America
5.2.5.2. South America
5.2.5.3. Europe
5.2.5.4. Middle East & Africa
5.2.5.5. Asia Pacific
5.2.6.By Competitors
5.2.6.1. Competition Characteristics
5.2.6.2. Market Share & Analysis
6. North America Calcium Hydroxide Market Statistics, 2022-2032F
6.1. Market Size & Growth Outlook
6.1.1.By Revenues in USD Million
6.2. Market Segmentation & Growth Outlook
6.2.1.By Grade Type- Market Insights and Forecast 2022-2032, USD Million
6.2.2.By Form- Market Insights and Forecast 2022-2032, USD Million
6.2.3.By Purity- Market Insights and Forecast 2022-2032, USD Million
6.2.4.By Application- Market Insights and Forecast 2022-2032, USD Million
6.2.5.By Country
6.2.5.1. US
6.2.5.2. Canada
6.2.5.3. Mexico
6.2.5.4. Rest of North America
6.3. US Calcium Hydroxide Market Statistics, 2022-2032F
6.3.1.Market Size & Growth Outlook
6.3.1.1. By Revenues in USD Million
6.3.2.Market Segmentation & Growth Outlook
6.3.2.1. By Grade Type- Market Insights and Forecast 2022-2032, USD Million
6.3.2.2. By Form- Market Insights and Forecast 2022-2032, USD Million
6.3.2.3. By Purity- Market Insights and Forecast 2022-2032, USD Million
6.3.2.4. By Application- Market Insights and Forecast 2022-2032, USD Million
6.4. Canada Calcium Hydroxide Market Statistics, 2022-2032F
6.4.1.Market Size & Growth Outlook
6.4.1.1. By Revenues in USD Million
6.4.2.Market Segmentation & Growth Outlook
6.4.2.1. By Grade Type- Market Insights and Forecast 2022-2032, USD Million
6.4.2.2. By Form- Market Insights and Forecast 2022-2032, USD Million
6.4.2.3. By Purity- Market Insights and Forecast 2022-2032, USD Million
6.4.2.4. By Application- Market Insights and Forecast 2022-2032, USD Million
6.5. Mexico Calcium Hydroxide Market Statistics, 2022-2032F
6.5.1.Market Size & Growth Outlook
6.5.1.1. By Revenues in USD Million
6.5.2.Market Segmentation & Growth Outlook
6.5.2.1. By Grade Type- Market Insights and Forecast 2022-2032, USD Million
6.5.2.2. By Form- Market Insights and Forecast 2022-2032, USD Million
6.5.2.3. By Purity- Market Insights and Forecast 2022-2032, USD Million
6.5.2.4. By Application- Market Insights and Forecast 2022-2032, USD Million
7. South America Calcium Hydroxide Market Statistics, 2022-2032F
7.1. Market Size & Growth Outlook
7.1.1.By Revenues in USD Million
7.2. Market Segmentation & Growth Outlook
7.2.1.By Grade Type- Market Insights and Forecast 2022-2032, USD Million
7.2.2.By Form- Market Insights and Forecast 2022-2032, USD Million
7.2.3.By Purity- Market Insights and Forecast 2022-2032, USD Million
7.2.4.By Application- Market Insights and Forecast 2022-2032, USD Million
7.2.5.By Country
7.2.5.1. Brazil
7.2.5.2. Argentina
7.2.5.3. Rest of South America
7.3. Brazil Calcium Hydroxide Market Statistics, 2022-2032F
7.3.1.Market Size & Growth Outlook
7.3.1.1. By Revenues in USD Million
7.3.2.Market Segmentation & Growth Outlook
7.3.2.1. By Grade Type- Market Insights and Forecast 2022-2032, USD Million
7.3.2.2. By Form- Market Insights and Forecast 2022-2032, USD Million
7.3.2.3. By Purity- Market Insights and Forecast 2022-2032, USD Million
7.3.2.4. By Application- Market Insights and Forecast 2022-2032, USD Million
7.4. Argentina Calcium Hydroxide Market Statistics, 2022-2032F
7.4.1.Market Size & Growth Outlook
7.4.1.1. By Revenues in USD Million
7.4.2.Market Segmentation & Growth Outlook
7.4.2.1. By Grade Type- Market Insights and Forecast 2022-2032, USD Million
7.4.2.2. By Form- Market Insights and Forecast 2022-2032, USD Million
7.4.2.3. By Purity- Market Insights and Forecast 2022-2032, USD Million
7.4.2.4. By Application- Market Insights and Forecast 2022-2032, USD Million
8. Europe Calcium Hydroxide Market Statistics, 2022-2032F
8.1. Market Size & Growth Outlook
8.1.1.By Revenues in USD Million
8.2. Market Segmentation & Growth Outlook
8.2.1.By Grade Type- Market Insights and Forecast 2022-2032, USD Million
8.2.2.By Form- Market Insights and Forecast 2022-2032, USD Million
8.2.3.By Purity- Market Insights and Forecast 2022-2032, USD Million
8.2.4.By Application- Market Insights and Forecast 2022-2032, USD Million
8.2.5.By Country
8.2.5.1. Germany
8.2.5.2. UK
8.2.5.3. Italy
8.2.5.4. France
8.2.5.5. Rest of Europe
8.3. Germany Calcium Hydroxide Market Statistics, 2022-2032F
8.3.1.Market Size & Growth Outlook
8.3.1.1. By Revenues in USD Million
8.3.2.Market Segmentation & Growth Outlook
8.3.2.1. By Grade Type- Market Insights and Forecast 2022-2032, USD Million
8.3.2.2. By Form- Market Insights and Forecast 2022-2032, USD Million
8.3.2.3. By Purity- Market Insights and Forecast 2022-2032, USD Million
8.3.2.4. By Application- Market Insights and Forecast 2022-2032, USD Million
8.4. UK Calcium Hydroxide Market Statistics, 2022-2032F
8.4.1.Market Size & Growth Outlook
8.4.1.1. By Revenues in USD Million
8.4.2.Market Segmentation & Growth Outlook
8.4.2.1. By Grade Type- Market Insights and Forecast 2022-2032, USD Million
8.4.2.2. By Form- Market Insights and Forecast 2022-2032, USD Million
8.4.2.3. By Purity- Market Insights and Forecast 2022-2032, USD Million
8.4.2.4. By Application- Market Insights and Forecast 2022-2032, USD Million
8.5. Italy Calcium Hydroxide Market Statistics, 2022-2032F
8.5.1.Market Size & Growth Outlook
8.5.1.1. By Revenues in USD Million
8.5.2.Market Segmentation & Growth Outlook
8.5.2.1. By Grade Type- Market Insights and Forecast 2022-2032, USD Million
8.5.2.2. By Form- Market Insights and Forecast 2022-2032, USD Million
8.5.2.3. By Purity- Market Insights and Forecast 2022-2032, USD Million
8.5.2.4. By Application- Market Insights and Forecast 2022-2032, USD Million
8.6. France Calcium Hydroxide Market Statistics, 2022-2032F
8.6.1.Market Size & Growth Outlook
8.6.1.1. By Revenues in USD Million
8.6.2.Market Segmentation & Growth Outlook
8.6.2.1. By Grade Type- Market Insights and Forecast 2022-2032, USD Million
8.6.2.2. By Form- Market Insights and Forecast 2022-2032, USD Million
8.6.2.3. By Purity- Market Insights and Forecast 2022-2032, USD Million
8.6.2.4. By Application- Market Insights and Forecast 2022-2032, USD Million
9. Middle East & Africa Calcium Hydroxide Market Statistics, 2022-2032F
9.1. Market Size & Growth Outlook
9.1.1.By Revenues in USD Million
9.2. Market Segmentation & Growth Outlook
9.2.1.By Grade Type- Market Insights and Forecast 2022-2032, USD Million
9.2.2.By Form- Market Insights and Forecast 2022-2032, USD Million
9.2.3.By Purity- Market Insights and Forecast 2022-2032, USD Million
9.2.4.By Application- Market Insights and Forecast 2022-2032, USD Million
9.2.5.By Country
9.2.5.1. Saudi Arabia
9.2.5.2. UAE
9.2.5.3. South Africa
9.2.5.4. Rest of Middle East & Africa
9.3. Saudi Arabia Calcium Hydroxide Market Statistics, 2022-2032F
9.3.1.Market Size & Growth Outlook
9.3.1.1. By Revenues in USD Million
9.3.2.Market Segmentation & Growth Outlook
9.3.2.1. By Grade Type- Market Insights and Forecast 2022-2032, USD Million
9.3.2.2. By Form- Market Insights and Forecast 2022-2032, USD Million
9.3.2.3. By Purity- Market Insights and Forecast 2022-2032, USD Million
9.3.2.4. By Application- Market Insights and Forecast 2022-2032, USD Million
9.4. UAE Calcium Hydroxide Market Statistics, 2022-2032F
9.4.1.Market Size & Growth Outlook
9.4.1.1. By Revenues in USD Million
9.4.2.Market Segmentation & Growth Outlook
9.4.2.1. By Grade Type- Market Insights and Forecast 2022-2032, USD Million
9.4.2.2. By Form- Market Insights and Forecast 2022-2032, USD Million
9.4.2.3. By Purity- Market Insights and Forecast 2022-2032, USD Million
9.4.2.4. By Application- Market Insights and Forecast 2022-2032, USD Million
9.5. South Africa Calcium Hydroxide Market Statistics, 2022-2032F
9.5.1.Market Size & Growth Outlook
9.5.1.1. By Revenues in USD Million
9.5.2.Market Segmentation & Growth Outlook
9.5.2.1. By Grade Type- Market Insights and Forecast 2022-2032, USD Million
9.5.2.2. By Form- Market Insights and Forecast 2022-2032, USD Million
9.5.2.3. By Purity- Market Insights and Forecast 2022-2032, USD Million
9.5.2.4. By Application- Market Insights and Forecast 2022-2032, USD Million
10. Asia Pacific Calcium Hydroxide Market Statistics, 2022-2032F
10.1. Market Size & Growth Outlook
10.1.1. By Revenues in USD Million
10.2. Market Segmentation & Growth Outlook
10.2.1. By Grade Type- Market Insights and Forecast 2022-2032, USD Million
10.2.2. By Form- Market Insights and Forecast 2022-2032, USD Million
10.2.3. By Purity- Market Insights and Forecast 2022-2032, USD Million
10.2.4. By Application- Market Insights and Forecast 2022-2032, USD Million
10.2.5. By Country
10.2.5.1. China
10.2.5.2. India
10.2.5.3. Japan
10.2.5.4. South Korea
10.2.5.5. Rest of Asia Pacific
10.3. China Calcium Hydroxide Market Statistics, 2022-2032F
10.3.1. Market Size & Growth Outlook
10.3.1.1. By Revenues in USD Million
10.3.2. Market Segmentation & Growth Outlook
10.3.2.1. By Grade Type- Market Insights and Forecast 2022-2032, USD Million
10.3.2.2. By Form- Market Insights and Forecast 2022-2032, USD Million
10.3.2.3. By Purity- Market Insights and Forecast 2022-2032, USD Million
10.3.2.4. By Application- Market Insights and Forecast 2022-2032, USD Million
10.4. India Calcium Hydroxide Market Statistics, 2022-2032F
10.4.1. Market Size & Growth Outlook
10.4.1.1. By Revenues in USD Million
10.4.2. Market Segmentation & Growth Outlook
10.4.2.1. By Grade Type- Market Insights and Forecast 2022-2032, USD Million
10.4.2.2. By Form- Market Insights and Forecast 2022-2032, USD Million
10.4.2.3. By Purity- Market Insights and Forecast 2022-2032, USD Million
10.4.2.4. By Application- Market Insights and Forecast 2022-2032, USD Million
10.5. Japan Calcium Hydroxide Market Statistics, 2022-2032F
10.5.1. Market Size & Growth Outlook
10.5.1.1. By Revenues in USD Million
10.5.2. Market Segmentation & Growth Outlook
10.5.2.1. By Grade Type- Market Insights and Forecast 2022-2032, USD Million
10.5.2.2. By Form- Market Insights and Forecast 2022-2032, USD Million
10.5.2.3. By Purity- Market Insights and Forecast 2022-2032, USD Million
10.5.2.4. By Application- Market Insights and Forecast 2022-2032, USD Million
10.6. South Korea Calcium Hydroxide Market Statistics, 2022-2032F
10.6.1. Market Size & Growth Outlook
10.6.1.1. By Revenues in USD Million
10.6.2. Market Segmentation & Growth Outlook
10.6.2.1. By Grade Type- Market Insights and Forecast 2022-2032, USD Million
10.6.2.2. By Form- Market Insights and Forecast 2022-2032, USD Million
10.6.2.3. By Purity- Market Insights and Forecast 2022-2032, USD Million
10.6.2.4. By Application- Market Insights and Forecast 2022-2032, USD Million
11. Competitive Outlook
11.1. Company Profiles
11.1.1. Lhoist Group
11.1.1.1. Business Description
11.1.1.2. Product Portfolio
11.1.1.3. Collaborations & Alliances
11.1.1.4. Recent Developments
11.1.1.5. Financial Details
11.1.1.6. Others
11.1.2. Carmeuse
11.1.2.1. Business Description
11.1.2.2. Product Portfolio
11.1.2.3. Collaborations & Alliances
11.1.2.4. Recent Developments
11.1.2.5. Financial Details
11.1.2.6. Others
11.1.3. Graymont Limited
11.1.3.1. Business Description
11.1.3.2. Product Portfolio
11.1.3.3. Collaborations & Alliances
11.1.3.4. Recent Developments
11.1.3.5. Financial Details
11.1.3.6. Others
11.1.4. Mississippi Lime Company
11.1.4.1. Business Description
11.1.4.2. Product Portfolio
11.1.4.3. Collaborations & Alliances
11.1.4.4. Recent Developments
11.1.4.5. Financial Details
11.1.4.6. Others
11.1.5. Minerals Technologies Inc.
11.1.5.1. Business Description
11.1.5.2. Product Portfolio
11.1.5.3. Collaborations & Alliances
11.1.5.4. Recent Developments
11.1.5.5. Financial Details
11.1.5.6. Others
11.1.6. Nordkalk Corporation
11.1.6.1. Business Description
11.1.6.2. Product Portfolio
11.1.6.3. Collaborations & Alliances
11.1.6.4. Recent Developments
11.1.6.5. Financial Details
11.1.6.6. Others
11.1.7. United States Lime & Minerals Inc.
11.1.7.1. Business Description
11.1.7.2. Product Portfolio
11.1.7.3. Collaborations & Alliances
11.1.7.4. Recent Developments
11.1.7.5. Financial Details
11.1.7.6. Others
11.1.8. Omya AG
11.1.8.1. Business Description
11.1.8.2. Product Portfolio
11.1.8.3. Collaborations & Alliances
11.1.8.4. Recent Developments
11.1.8.5. Financial Details
11.1.8.6. Others
11.1.9. Hydrite Chemical Co.
11.1.9.1. Business Description
11.1.9.2. Product Portfolio
11.1.9.3. Collaborations & Alliances
11.1.9.4. Recent Developments
11.1.9.5. Financial Details
11.1.9.6. Others
11.1.10. Boral Ltd.
11.1.10.1.Business Description
11.1.10.2.Product Portfolio
11.1.10.3.Collaborations & Alliances
11.1.10.4.Recent Developments
11.1.10.5.Financial Details
11.1.10.6.Others
11.1.11. Calcinor SA
11.1.11.1.Business Description
11.1.11.2.Product Portfolio
11.1.11.3.Collaborations & Alliances
11.1.11.4.Recent Developments
11.1.11.5.Financial Details
11.1.11.6.Others
11.1.12. Singleton Birch Ltd.
11.1.12.1.Business Description
11.1.12.2.Product Portfolio
11.1.12.3.Collaborations & Alliances
11.1.12.4.Recent Developments
11.1.12.5.Financial Details
11.1.12.6.Others
11.1.13. Huber Engineered Materials
11.1.13.1.Business Description
11.1.13.2.Product Portfolio
11.1.13.3.Collaborations & Alliances
11.1.13.4.Recent Developments
11.1.13.5.Financial Details
11.1.13.6.Others
11.1.14. Jost Chemical Co.
11.1.14.1.Business Description
11.1.14.2.Product Portfolio
11.1.14.3.Collaborations & Alliances
11.1.14.4.Recent Developments
11.1.14.5.Financial Details
11.1.14.6.Others
11.1.15. Sigma Minerals Ltd.
11.1.15.1.Business Description
11.1.15.2.Product Portfolio
11.1.15.3.Collaborations & Alliances
11.1.15.4.Recent Developments
11.1.15.5.Financial Details
11.1.15.6.Others
12. Disclaimer
| Segment | Sub-Segment |
|---|---|
| By Grade Type |
|
| By Form |
|
| By Purity |
|
| By Application |
|
| By Region |
|
Research Methodology
This study followed a structured approach comprising four key phases to assess the size and scope of the electro-oxidation market. The process began with thorough secondary research to collect data on the target market, related markets, and broader industry context. These findings, along with preliminary assumptions and estimates, were then validated through extensive primary research involving industry experts from across the value chain. To calculate the overall market size, both top-down and bottom-up methodologies were employed. Finally, market segmentation and data triangulation techniques were applied to refine and validate segment-level estimations.
Secondary Research
The secondary research phase involved gathering data from a wide range of credible and published sources. This step helped in identifying industry trends, defining market segmentation, and understanding the market landscape and value chain.
Sources consulted during this phase included:
- Company annual reports, investor presentations, and press releases
- Industry white papers and certified publications
- Trade directories and market-recognized databases
- Articles from authoritative authors and reputable journals
- Gold and silver standard websites
Secondary research was critical in mapping out the industry's value chain and monetary flow, identifying key market segments, understanding regional variations, and tracking significant industry developments.
Other key sources:
- Financial disclosures
- Industry associations and trade bodies
- News outlets and business magazines
- Academic journals and research studies
- Paid industry databases
Primary Research
To validate secondary data and gain deeper market insights, primary research was conducted with key stakeholders across both the supply and demand sides of the market.
On the demand side, participants included decision-makers and influencers from end-user industries—such as CIOs, CTOs, and CSOs—who provided first-hand perspectives on market needs, product usage, and future expectations.
On the supply side, interviews were conducted with manufacturers, industry associations, and institutional participants to gather insights into current offerings, product pipelines, and market challenges.
Primary interviews provided critical inputs such as:
- Market size and revenue data
- Product and service breakdowns
- Market forecasts
- Regional and application-specific trends
Stakeholders consulted included:
- Leading OEM and solution providers
- Channel and distribution partners
- End users across various applications
- Independent consultants and industry specialists
Market Size Estimation and Data Triangulation
- Identifying Key Market Participants (Secondary Research)
- Goal: To identify the major players or companies in the target market. This typically involves using publicly available data sources such as industry reports, market research publications, and financial statements of companies.
- Tools: Reports from firms like Gartner, Forrester, Euromonitor, Statista, IBISWorld, and others. Public financial statements, news articles, and press releases from top market players.
- Extracting Earnings of Key Market Participants
- Goal: To estimate the earnings generated from the product or service being analyzed. This step helps in understanding the revenue potential of each market player in a specific geography.
- Methods: Earnings data can be gathered from:
- Publicly available financial reports (for listed companies).
- Interviews and primary data sources from professionals, such as Directors, VPs, SVPs, etc. This is especially useful for understanding more nuanced, internal data that isn't publicly disclosed.
- Annual reports and investor presentations of key players.
- Data Collation and Development of a Relevant Data Model
- Goal: To collate inputs from both primary and secondary sources into a structured, data-driven model for market estimation. This model will incorporate key market KPIs and any independent variables relevant to the market.
- Key KPIs: These could include:
- Market size, growth rate, and demand drivers.
- Industry-specific metrics like market share, average revenue per customer (ARPC), or average deal size.
- External variables, such as economic growth rates, inflation rates, or commodity prices, that could affect the market.
- Data Modeling: Based on this data, the market forecasts are developed for the next 5 years. A combination of trend analysis, scenario modeling, and statistical regression might be used to generate projections.
- Scenario Analysis
- Goal: To test different assumptions and validate how sensitive the market is to changes in key variables (e.g., market demand, regulatory changes, technological disruptions).
- Types of Scenarios:
- Base Case: Based on current assumptions and historical data.
- Best-Case Scenario: Assuming favorable market conditions, regulatory environments, and technological advancements.
- Worst-Case Scenario: Accounting for adverse factors, such as economic downturns, stricter regulations, or unexpected disruptions.


