Global Calcium Chloride Market Report: Trends, Growth and Forecast (2026-2032)
By Product Type (Flakes 77%, Flakes 94%, Prills 94%, Pellets 94%), By Grade (Food Grade, Industrial Grade, Agriculture Grade, Pharmaceutical Grade), By Form (Liquid, Hydrated Solid, Others), By Raw Material (Natural Brine, Solvay Process (by-product), Limestone, Hydrochloric Acid (HCL)), By Application (Dust Control, De-icing, Gas and Oil, Construction, Agriculture, Food, Others), By Region (North America, South America, Europe, Middle East & Africa, Asia Pacific) ... Read more
|
Major Players
|
Global Calcium Chloride Market Statistics and Insights, 2026
- Market Size Statistics
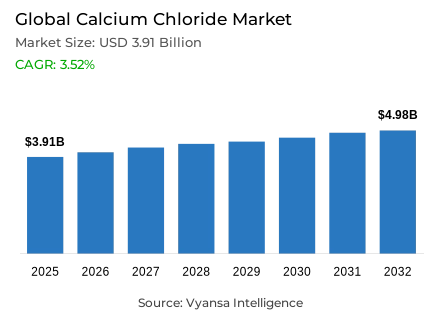
- Global calcium chloride market is estimated at USD 3.91 billion in 2025.
- The market size is expected to grow to USD 4.98 billion by 2032.
- Market to register a CAGR of around 3.52% during 2026-32.
- Grade Shares
- Industrial grade grabbed market share of 55%.
- Competition
- Global calcium chloride market is currently being catered to by more than 25 companies.
- Top 5 companies acquired around 60% of the market share.
- Ward Chemical Ltd; Weifang Haibin Chemical Co. Ltd.; Zirax Ltd.; Occidental Chemical Corporation (OxyChem); TETRA Technologies Inc. etc., are few of the top companies.
- Application
- De-icing grabbed 35% of the market.
- Region
- North America leads with a 40% share of the global market.
Global Calcium Chloride Market Outlook
The Global calcium chloride market during the forecast period will enter with strong scale and a stable structure. The market is estimated at USD 3.91 billion in 2025 and USD 4.98 billion in 2032, with a CAGR of about 3.52% in 2026-2032. The dominance of industrial-grade product is 55%, which is reflective of its widespread use in large-volume, cost-sensitive processes. Application wise, de-icing is the biggest segment with 35% of the sales, and North America is the biggest regionally with about 40% of the world demand based on its climatic conditions and infrastructure profile.
The expansion perspective is still closely linked to the priorities of the public-safety, especially the control of winter roads. The long-term emphasis on the decrease of traffic accidents makes snow-and-ice control remain on the governmental agenda, particularly in the high-traffic routes. The further public spending on winter maintenance, including large annual investments in snow and ice control across the United States, reinforces a continued dependence on calcium chloride, due to its low-temperature efficacy and its quick ice-melting action. These considerations provide a predictable demand foundation pegged on social infrastructure and seasonal needs.
At the same time, the increased environmental scrutiny is influencing the development of the market. There is an increasing regulatory focus on chloride levels in surface and drinking water, and water utilities are carefully monitoring chloride levels related to road de-icing. Although benchmarks like the chloride guideline of the United States Environmental Protection Agency are not enforceable, they have significant impacts on application practices. This setting encourages a more regulated use, better runoff control and prudent choice of chloride-based materials, thus taming growth without eliminating demand.
Outside the road industry, there is consistent backing through industrial efficiency needs and international water-infrastructure development. The energy-intensive industries continue to favour calcium chloride due to its consistent performance in drying, brine, and moisture-control operations as they seek operational stability in the face of increased energy prices. At the same time, the growing water stress in the world is driving investment in water and wastewater systems, where calcium chloride is used in supportive roles in construction and utility processes. All these aspects support a stable and sustainable perspective until 2032.

Global Calcium Chloride Market Growth Driver
Road Safety Imperatives Strengthening Winter Maintenance Practices
The increased focus on the minimization of winter road accidents is one of the fundamental growth drivers of the global calcium chloride market. According to the World Health Organization Global Status Report on Road Safety 2023, road crashes continue to claim about 1.19 million lives every year and are the number one cause of death among individuals aged 5-29 years. These statistics keep government officials concerned with preventive infrastructure, such as effective snow and ice management on highways with heavy traffic, where weather conditions drastically raise the risk of accidents.
Federal Highway Administration statistics indicate that there are approximately 744,900 weather-related crashes annually in the United States, 2019-2023, and over USD 4.6 billion is spent annually on snow and ice management. This long-term spending highlights the reason why transport agencies still use high-performance de-icers like calcium chloride to ensure that roads remain frictional, mobile, and safe to end users during winter events.
Global Calcium Chloride Market Challenge
Heightened Scrutiny on Chloride Impacts in Water Systems
Increasing regulatory focus on chloride content in surface and drinking water is a major limitation to the use of calcium chloride. The U.S. Environmental Protection Agency has a second drinking-water standard of 250 mg/L -1 of chloride, which utilities use as a measure of possible taste problems and corrosion potential. This benchmark, though not enforceable, has a powerful impact on monitoring practices and regulatory expectations in cold-climate regions.
Water utilities are becoming more associated with the increasing levels of chloride with human activities like road de-icing. St. Paul Regional Water Services documents alarming rates of surface-water chloride that are associated with road salt application and specifically cites the 250 ppm limit of the EPA. This accumulating evidence compels governments to increase application regulations, enhance runoff management, and inspect all chloride-based de-icers, such as calcium chloride, to safeguard long-term water quality.
Unlock Market Intelligence
Explore the market potential with our data-driven report
Global Calcium Chloride Market Trend
Process Optimization Priorities in Energy-Intensive Industries
The most obvious trend influencing demand is the efficiency trend in the energy-intensive sectors that consume calcium chloride in drying, brine preparation, and moisture-control applications. According to Eurostat statistics, industry contributed 25.1% of EU final energy consumption in 2022, of which the chemical and petrochemical industry alone used 1,892 petajoules, or 20.0% of industrial energy consumption. This energy concentration continues to make operational efficiency a management goal.
In these settings, the operators of plants prefer technically mature inputs that contribute to stable processes and minimize downtime. Calcium chloride fulfills this need by providing predictable performance in dehumidification, concentration, and brine systems. With the modernisation of industrial facilities and the tightening of process control to control exposure to energy, the demand is not decreasing in the auxiliary materials that help to make the operations smoother and more efficient.
Global Calcium Chloride Market Opportunity
Water Stress and Infrastructure Investment Creating New Demand Avenues
The increasing water stress in the world is creating new opportunities in the application of calcium chloride in infrastructure and utility development. According to the UN World Water Development Report 2023, two to three billion individuals experience at least one month of water shortage each year, and 26% of the world population does not have access to safely managed drinking water. These circumstances are fueling mass government spending on treatment, storage, and distribution facilities.
With the growth and renovation of utilities and municipalities, the focus is on the reliability of construction, moisture management, and operational stability. Calcium chloride helps to achieve these priorities by contributing to the acceleration of concrete, brine management, and certain water and wastewater treatment. The magnitude of infrastructure projects identified by UN agencies offers medium-term prospects to suppliers who satisfy public requirements and sustainability standards, especially in cases where the projects are intended to enhance service continuity to the end users.
Global Calcium Chloride Market Regional Analysis

By Region
- North America
- South America
- Europe
- Middle East & Africa
- Asia Pacific
Regionally, North America leads with an estimated 40% share of the global market. This position reflects an extensive road network exposed to prolonged snow, ice, and freeze-thaw cycles across the United States and Canada. Transport agencies in these areas have long adopted chloride-based winter maintenance strategies, often combining calcium chloride with rock salt to enhance low-temperature performance and response speed.
Beyond winter highways, the region also has vast rural and resource-driven areas with extensive unpaved road networks. Agriculture, mining, forestry, and local logistics depend on dust-suppression and surface-stabilization programs where calcium chloride is widely applied. The combination of intensive winter de-icing and sustained year-round dust control supports North America’s 40% share, providing a stable demand base within the Global calcium chloride market.
Unlock Market Intelligence
Explore the market potential with our data-driven report
Global Calcium Chloride Market Segmentation Analysis
By Grade
- Food Grade
- Industrial Grade
- Agriculture Grade
- Pharmaceutical Grade
Within grade-based segmentation, industrial grade holds the largest share at around 55% of the Global calcium chloride market. This dominance reflects its widespread use in de-icing, dust suppression, and general industrial brine applications, where end users prioritize consistent performance and cost efficiency rather than ultra-high purity. Public works departments, highway agencies, and industrial operators collectively account for substantial recurring volumes, anchoring industrial grade as the primary demand driver.
Food and pharmaceutical grades address more specialized requirements, including food processing, brewing, and medical formulations that require tighter impurity controls and certifications. While these grades command higher unit values, their total volumes remain comparatively limited. The 55% share held by industrial grade therefore highlights how overall market demand continues to be shaped by large-scale operational uses rather than niche, high-purity applications.

By Application
- Dust Control
- De-icing
- Gas and Oil
- Construction
- Agriculture
- Food
- Others
Application-based segmentation shows de-icing as the largest segment, accounting for about 35% of total demand. Calcium chloride is favored by winter maintenance authorities because it remains effective at lower temperatures than standard rock salt and accelerates ice melting on roads, bridges, and high-risk junctions. These performance advantages are critical in regions experiencing severe winters, where maintaining traffic flow and reducing accident risk are top priorities.
Other applications include dust suppression on unpaved roads, use as a concrete accelerator, industrial brines, and desiccant systems. While important, these uses do not match the scale and seasonally recurring volumes associated with publicly funded winter road programs. The 35% share attributed to de-icing underscores the close link between calcium chloride demand and exposure to snow and ice conditions across major transport networks serving daily end users.
Market Players in Global Calcium Chloride Market
These market players maintain a significant presence in the Global calcium chloride market sector and contribute to its ongoing evolution.
- Ward Chemical Ltd
- Weifang Haibin Chemical Co. Ltd.
- Zirax Ltd.
- Occidental Chemical Corporation (OxyChem)
- TETRA Technologies Inc.
- Solvay S.A.
- Dow Chemical Company (Dow)
- BASF SE
- Nedmag B.V.
- SAMEER CHEMICALS
- Sitara Chemical Industries Ltd.
- Sulaksh Chemicals
- Aditya Birla Chemicals
- Gujarat Alkalies and Chemicals Limited
- Qingdao Huadong Calcium Producing Co. Ltd.
Market News & Updates
- TETRA Technologies Inc., 2025:
TETRA Technologies maintained its position as the fifth consecutive year top Gulf of America supplier for product quality and overall performance in 2025. The company completed Q3 2025 reporting an 8% year-over-year revenue improvement, driven by continued strength in both its offshore and industrial calcium chloride segments across Northern Europe and deepwater operations. This performance reflects strong demand for calcium chloride products in high-density applications and demonstrates TETRA's market leadership in specialized calcium chloride manufacturing and distribution across energy and industrial markets globally.
- Solvay S.A., 2025:
Solvay maintains its comprehensive CASO® product portfolio for calcium chloride applications across technical and food-grade formulations, serving drilling fluids, road treatment, and animal feed markets through both synthesis and mineral recovery manufacturing pathways. The company's CASO® product lines include powder, flakes, and solution variants meeting purity standards for food applications (CASO® FCC Solution meeting E509 European additive specifications) and technical applications for industrial use, ensuring broad market coverage across diverse end-use segments.
Frequently Asked Questions
Related Report
1. Market Segmentation
1.1. Research Scope
1.2. Research Methodology
1.3. Definitions and Assumptions
2. Executive Summary
3. Global Calcium Chloride Market Policies, Regulations, and Standards
4. Global Calcium Chloride Market Dynamics
4.1. Growth Factors
4.2. Challenges
4.3. Trends
4.4. Opportunities
5. Global Calcium Chloride Market Statistics, 2022-2032F
5.1. Market Size & Growth Outlook
5.1.1.By Revenues in USD Million
5.2. Market Segmentation & Growth Outlook
5.2.1.By Product Type
5.2.1.1. Flakes 77%- Market Insights and Forecast 2022-2032, USD Million
5.2.1.2. Flakes 94%- Market Insights and Forecast 2022-2032, USD Million
5.2.1.3. Prills 94%- Market Insights and Forecast 2022-2032, USD Million
5.2.1.4. Pellets 94%- Market Insights and Forecast 2022-2032, USD Million
5.2.2.By Grade
5.2.2.1. Food Grade- Market Insights and Forecast 2022-2032, USD Million
5.2.2.2. Industrial Grade- Market Insights and Forecast 2022-2032, USD Million
5.2.2.3. Agriculture Grade- Market Insights and Forecast 2022-2032, USD Million
5.2.2.4. Pharmaceutical Grade- Market Insights and Forecast 2022-2032, USD Million
5.2.3.By Form
5.2.3.1. Liquid- Market Insights and Forecast 2022-2032, USD Million
5.2.3.2. Hydrated Solid- Market Insights and Forecast 2022-2032, USD Million
5.2.3.3. Others- Market Insights and Forecast 2022-2032, USD Million
5.2.4.By Raw Material
5.2.4.1. Natural Brine- Market Insights and Forecast 2022-2032, USD Million
5.2.4.2. Solvay Process (by-product)- Market Insights and Forecast 2022-2032, USD Million
5.2.4.3. Limestone- Market Insights and Forecast 2022-2032, USD Million
5.2.4.4. Hydrochloric Acid (HCL)- Market Insights and Forecast 2022-2032, USD Million
5.2.5.By Application
5.2.5.1. Dust Control- Market Insights and Forecast 2022-2032, USD Million
5.2.5.2. De-icing- Market Insights and Forecast 2022-2032, USD Million
5.2.5.3. Gas and Oil- Market Insights and Forecast 2022-2032, USD Million
5.2.5.4. Construction- Market Insights and Forecast 2022-2032, USD Million
5.2.5.5. Agriculture- Market Insights and Forecast 2022-2032, USD Million
5.2.5.6. Food- Market Insights and Forecast 2022-2032, USD Million
5.2.5.7. Others- Market Insights and Forecast 2022-2032, USD Million
5.2.6.By Region
5.2.6.1. North America
5.2.6.2. South America
5.2.6.3. Europe
5.2.6.4. Middle East & Africa
5.2.6.5. Asia Pacific
5.2.7.By Competitors
5.2.7.1. Competition Characteristics
5.2.7.2. Market Share & Analysis
6. North America Calcium Chloride Market Statistics, 2022-2032F
6.1. Market Size & Growth Outlook
6.1.1.By Revenues in USD Million
6.2. Market Segmentation & Growth Outlook
6.2.1.By Product Type- Market Insights and Forecast 2022-2032, USD Million
6.2.2.By Grade- Market Insights and Forecast 2022-2032, USD Million
6.2.3.By Form- Market Insights and Forecast 2022-2032, USD Million
6.2.4.By Raw Material- Market Insights and Forecast 2022-2032, USD Million
6.2.5.By Application- Market Insights and Forecast 2022-2032, USD Million
6.2.6.By Country
6.2.6.1. US
6.2.6.2. Canada
6.2.6.3. Mexico
6.2.6.4. Rest of North America
6.3. US Calcium Chloride Market Statistics, 2022-2032F
6.3.1.Market Size & Growth Outlook
6.3.1.1. By Revenues in USD Million
6.3.2.Market Segmentation & Growth Outlook
6.3.2.1. By Product Type- Market Insights and Forecast 2022-2032, USD Million
6.3.2.2. By Grade- Market Insights and Forecast 2022-2032, USD Million
6.3.2.3. By Form- Market Insights and Forecast 2022-2032, USD Million
6.3.2.4. By Raw Material- Market Insights and Forecast 2022-2032, USD Million
6.3.2.5. By Application- Market Insights and Forecast 2022-2032, USD Million
6.4. Canada Calcium Chloride Market Statistics, 2022-2032F
6.4.1.Market Size & Growth Outlook
6.4.1.1. By Revenues in USD Million
6.4.2.Market Segmentation & Growth Outlook
6.4.2.1. By Product Type- Market Insights and Forecast 2022-2032, USD Million
6.4.2.2. By Grade- Market Insights and Forecast 2022-2032, USD Million
6.4.2.3. By Form- Market Insights and Forecast 2022-2032, USD Million
6.4.2.4. By Raw Material- Market Insights and Forecast 2022-2032, USD Million
6.4.2.5. By Application- Market Insights and Forecast 2022-2032, USD Million
6.5. Mexico Calcium Chloride Market Statistics, 2022-2032F
6.5.1.Market Size & Growth Outlook
6.5.1.1. By Revenues in USD Million
6.5.2.Market Segmentation & Growth Outlook
6.5.2.1. By Product Type- Market Insights and Forecast 2022-2032, USD Million
6.5.2.2. By Grade- Market Insights and Forecast 2022-2032, USD Million
6.5.2.3. By Form- Market Insights and Forecast 2022-2032, USD Million
6.5.2.4. By Raw Material- Market Insights and Forecast 2022-2032, USD Million
6.5.2.5. By Application- Market Insights and Forecast 2022-2032, USD Million
7. South America Calcium Chloride Market Statistics, 2022-2032F
7.1. Market Size & Growth Outlook
7.1.1.By Revenues in USD Million
7.2. Market Segmentation & Growth Outlook
7.2.1.By Product Type- Market Insights and Forecast 2022-2032, USD Million
7.2.2.By Grade- Market Insights and Forecast 2022-2032, USD Million
7.2.3.By Form- Market Insights and Forecast 2022-2032, USD Million
7.2.4.By Raw Material- Market Insights and Forecast 2022-2032, USD Million
7.2.5.By Application- Market Insights and Forecast 2022-2032, USD Million
7.2.6.By Country
7.2.6.1. Brazil
7.2.6.2. Argentina
7.2.6.3. Rest of South America
7.3. Brazil Calcium Chloride Market Statistics, 2022-2032F
7.3.1.Market Size & Growth Outlook
7.3.1.1. By Revenues in USD Million
7.3.2.Market Segmentation & Growth Outlook
7.3.2.1. By Product Type- Market Insights and Forecast 2022-2032, USD Million
7.3.2.2. By Grade- Market Insights and Forecast 2022-2032, USD Million
7.3.2.3. By Form- Market Insights and Forecast 2022-2032, USD Million
7.3.2.4. By Raw Material- Market Insights and Forecast 2022-2032, USD Million
7.3.2.5. By Application- Market Insights and Forecast 2022-2032, USD Million
7.4. Argentina Calcium Chloride Market Statistics, 2022-2032F
7.4.1.Market Size & Growth Outlook
7.4.1.1. By Revenues in USD Million
7.4.2.Market Segmentation & Growth Outlook
7.4.2.1. By Product Type- Market Insights and Forecast 2022-2032, USD Million
7.4.2.2. By Grade- Market Insights and Forecast 2022-2032, USD Million
7.4.2.3. By Form- Market Insights and Forecast 2022-2032, USD Million
7.4.2.4. By Raw Material- Market Insights and Forecast 2022-2032, USD Million
7.4.2.5. By Application- Market Insights and Forecast 2022-2032, USD Million
8. Europe Calcium Chloride Market Statistics, 2022-2032F
8.1. Market Size & Growth Outlook
8.1.1.By Revenues in USD Million
8.2. Market Segmentation & Growth Outlook
8.2.1.By Product Type- Market Insights and Forecast 2022-2032, USD Million
8.2.2.By Grade- Market Insights and Forecast 2022-2032, USD Million
8.2.3.By Form- Market Insights and Forecast 2022-2032, USD Million
8.2.4.By Raw Material- Market Insights and Forecast 2022-2032, USD Million
8.2.5.By Application- Market Insights and Forecast 2022-2032, USD Million
8.2.6.By Country
8.2.6.1. Germany
8.2.6.2. France
8.2.6.3. UK
8.2.6.4. Netherlands
8.2.6.5. Switzerland
8.2.6.6. Belgium
8.2.6.7. Russia
8.2.6.8. Italy
8.2.6.9. Spain
8.2.6.10. Turkey
8.2.6.11. Rest of Europe
8.3. Germany Calcium Chloride Market Statistics, 2022-2032F
8.3.1.Market Size & Growth Outlook
8.3.1.1. By Revenues in USD Million
8.3.2.Market Segmentation & Growth Outlook
8.3.2.1. By Product Type- Market Insights and Forecast 2022-2032, USD Million
8.3.2.2. By Grade- Market Insights and Forecast 2022-2032, USD Million
8.3.2.3. By Form- Market Insights and Forecast 2022-2032, USD Million
8.3.2.4. By Raw Material- Market Insights and Forecast 2022-2032, USD Million
8.3.2.5. By Application- Market Insights and Forecast 2022-2032, USD Million
8.4. France Calcium Chloride Market Statistics, 2022-2032F
8.4.1.Market Size & Growth Outlook
8.4.1.1. By Revenues in USD Million
8.4.2.Market Segmentation & Growth Outlook
8.4.2.1. By Product Type- Market Insights and Forecast 2022-2032, USD Million
8.4.2.2. By Grade- Market Insights and Forecast 2022-2032, USD Million
8.4.2.3. By Form- Market Insights and Forecast 2022-2032, USD Million
8.4.2.4. By Raw Material- Market Insights and Forecast 2022-2032, USD Million
8.4.2.5. By Application- Market Insights and Forecast 2022-2032, USD Million
8.5. UK Calcium Chloride Market Statistics, 2022-2032F
8.5.1.Market Size & Growth Outlook
8.5.1.1. By Revenues in USD Million
8.5.2.Market Segmentation & Growth Outlook
8.5.2.1. By Product Type- Market Insights and Forecast 2022-2032, USD Million
8.5.2.2. By Grade- Market Insights and Forecast 2022-2032, USD Million
8.5.2.3. By Form- Market Insights and Forecast 2022-2032, USD Million
8.5.2.4. By Raw Material- Market Insights and Forecast 2022-2032, USD Million
8.5.2.5. By Application- Market Insights and Forecast 2022-2032, USD Million
8.6. Netherlands Calcium Chloride Market Statistics, 2022-2032F
8.6.1.Market Size & Growth Outlook
8.6.1.1. By Revenues in USD Million
8.6.2.Market Segmentation & Growth Outlook
8.6.2.1. By Product Type- Market Insights and Forecast 2022-2032, USD Million
8.6.2.2. By Grade- Market Insights and Forecast 2022-2032, USD Million
8.6.2.3. By Form- Market Insights and Forecast 2022-2032, USD Million
8.6.2.4. By Raw Material- Market Insights and Forecast 2022-2032, USD Million
8.6.2.5. By Application- Market Insights and Forecast 2022-2032, USD Million
8.7. Switzerland Calcium Chloride Market Statistics, 2022-2032F
8.7.1.Market Size & Growth Outlook
8.7.1.1. By Revenues in USD Million
8.7.2.Market Segmentation & Growth Outlook
8.7.2.1. By Product Type- Market Insights and Forecast 2022-2032, USD Million
8.7.2.2. By Grade- Market Insights and Forecast 2022-2032, USD Million
8.7.2.3. By Form- Market Insights and Forecast 2022-2032, USD Million
8.7.2.4. By Raw Material- Market Insights and Forecast 2022-2032, USD Million
8.7.2.5. By Application- Market Insights and Forecast 2022-2032, USD Million
8.8. Belgium Calcium Chloride Market Statistics, 2022-2032F
8.8.1.Market Size & Growth Outlook
8.8.1.1. By Revenues in USD Million
8.8.2.Market Segmentation & Growth Outlook
8.8.2.1. By Product Type- Market Insights and Forecast 2022-2032, USD Million
8.8.2.2. By Grade- Market Insights and Forecast 2022-2032, USD Million
8.8.2.3. By Form- Market Insights and Forecast 2022-2032, USD Million
8.8.2.4. By Raw Material- Market Insights and Forecast 2022-2032, USD Million
8.8.2.5. By Application- Market Insights and Forecast 2022-2032, USD Million
8.9. Russia Calcium Chloride Market Statistics, 2022-2032F
8.9.1.Market Size & Growth Outlook
8.9.1.1. By Revenues in USD Million
8.9.2.Market Segmentation & Growth Outlook
8.9.2.1. By Product Type- Market Insights and Forecast 2022-2032, USD Million
8.9.2.2. By Grade- Market Insights and Forecast 2022-2032, USD Million
8.9.2.3. By Form- Market Insights and Forecast 2022-2032, USD Million
8.9.2.4. By Raw Material- Market Insights and Forecast 2022-2032, USD Million
8.9.2.5. By Application- Market Insights and Forecast 2022-2032, USD Million
8.10. Italy Calcium Chloride Market Statistics, 2022-2032F
8.10.1. Market Size & Growth Outlook
8.10.1.1. By Revenues in USD Million
8.10.2. Market Segmentation & Growth Outlook
8.10.2.1. By Product Type- Market Insights and Forecast 2022-2032, USD Million
8.10.2.2. By Grade- Market Insights and Forecast 2022-2032, USD Million
8.10.2.3. By Form- Market Insights and Forecast 2022-2032, USD Million
8.10.2.4. By Raw Material- Market Insights and Forecast 2022-2032, USD Million
8.10.2.5. By Application- Market Insights and Forecast 2022-2032, USD Million
8.11. Spain Calcium Chloride Market Statistics, 2022-2032F
8.11.1. Market Size & Growth Outlook
8.11.1.1. By Revenues in USD Million
8.11.2. Market Segmentation & Growth Outlook
8.11.2.1. By Product Type- Market Insights and Forecast 2022-2032, USD Million
8.11.2.2. By Grade- Market Insights and Forecast 2022-2032, USD Million
8.11.2.3. By Form- Market Insights and Forecast 2022-2032, USD Million
8.11.2.4. By Raw Material- Market Insights and Forecast 2022-2032, USD Million
8.11.2.5. By Application- Market Insights and Forecast 2022-2032, USD Million
8.12. Turkey Calcium Chloride Market Statistics, 2022-2032F
8.12.1. Market Size & Growth Outlook
8.12.1.1. By Revenues in USD Million
8.12.2. Market Segmentation & Growth Outlook
8.12.2.1. By Product Type- Market Insights and Forecast 2022-2032, USD Million
8.12.2.2. By Grade- Market Insights and Forecast 2022-2032, USD Million
8.12.2.3. By Form- Market Insights and Forecast 2022-2032, USD Million
8.12.2.4. By Raw Material- Market Insights and Forecast 2022-2032, USD Million
8.12.2.5. By Application- Market Insights and Forecast 2022-2032, USD Million
9. Middle East & Africa Calcium Chloride Market Statistics, 2022-2032F
9.1. Market Size & Growth Outlook
9.1.1.By Revenues in USD Million
9.2. Market Segmentation & Growth Outlook
9.2.1.By Product Type- Market Insights and Forecast 2022-2032, USD Million
9.2.2.By Grade- Market Insights and Forecast 2022-2032, USD Million
9.2.3.By Form- Market Insights and Forecast 2022-2032, USD Million
9.2.4.By Raw Material- Market Insights and Forecast 2022-2032, USD Million
9.2.5.By Application- Market Insights and Forecast 2022-2032, USD Million
9.2.6.By Country
9.2.6.1. Saudi Arabia
9.2.6.2. UAE
9.2.6.3. South Africa
9.2.6.4. Egypt
9.2.6.5. Israel
9.2.6.6. Rest of Middle East & Africa
9.3. Saudi Arabia Calcium Chloride Market Statistics, 2022-2032F
9.3.1.Market Size & Growth Outlook
9.3.1.1. By Revenues in USD Million
9.3.2.Market Segmentation & Growth Outlook
9.3.2.1. By Product Type- Market Insights and Forecast 2022-2032, USD Million
9.3.2.2. By Grade- Market Insights and Forecast 2022-2032, USD Million
9.3.2.3. By Form- Market Insights and Forecast 2022-2032, USD Million
9.3.2.4. By Raw Material- Market Insights and Forecast 2022-2032, USD Million
9.3.2.5. By Application- Market Insights and Forecast 2022-2032, USD Million
9.4. UAE Calcium Chloride Market Statistics, 2022-2032F
9.4.1.Market Size & Growth Outlook
9.4.1.1. By Revenues in USD Million
9.4.2.Market Segmentation & Growth Outlook
9.4.2.1. By Product Type- Market Insights and Forecast 2022-2032, USD Million
9.4.2.2. By Grade- Market Insights and Forecast 2022-2032, USD Million
9.4.2.3. By Form- Market Insights and Forecast 2022-2032, USD Million
9.4.2.4. By Raw Material- Market Insights and Forecast 2022-2032, USD Million
9.4.2.5. By Application- Market Insights and Forecast 2022-2032, USD Million
9.5. South Africa Calcium Chloride Market Statistics, 2022-2032F
9.5.1.Market Size & Growth Outlook
9.5.1.1. By Revenues in USD Million
9.5.2.Market Segmentation & Growth Outlook
9.5.2.1. By Product Type- Market Insights and Forecast 2022-2032, USD Million
9.5.2.2. By Grade- Market Insights and Forecast 2022-2032, USD Million
9.5.2.3. By Form- Market Insights and Forecast 2022-2032, USD Million
9.5.2.4. By Raw Material- Market Insights and Forecast 2022-2032, USD Million
9.5.2.5. By Application- Market Insights and Forecast 2022-2032, USD Million
9.6. Egypt Calcium Chloride Market Statistics, 2022-2032F
9.6.1.Market Size & Growth Outlook
9.6.1.1. By Revenues in USD Million
9.6.2.Market Segmentation & Growth Outlook
9.6.2.1. By Product Type- Market Insights and Forecast 2022-2032, USD Million
9.6.2.2. By Grade- Market Insights and Forecast 2022-2032, USD Million
9.6.2.3. By Form- Market Insights and Forecast 2022-2032, USD Million
9.6.2.4. By Raw Material- Market Insights and Forecast 2022-2032, USD Million
9.6.2.5. By Application- Market Insights and Forecast 2022-2032, USD Million
9.7. Israel Calcium Chloride Market Statistics, 2022-2032F
9.7.1.Market Size & Growth Outlook
9.7.1.1. By Revenues in USD Million
9.7.2.Market Segmentation & Growth Outlook
9.7.2.1. By Product Type- Market Insights and Forecast 2022-2032, USD Million
9.7.2.2. By Grade- Market Insights and Forecast 2022-2032, USD Million
9.7.2.3. By Form- Market Insights and Forecast 2022-2032, USD Million
9.7.2.4. By Raw Material- Market Insights and Forecast 2022-2032, USD Million
9.7.2.5. By Application- Market Insights and Forecast 2022-2032, USD Million
10. Asia Pacific Calcium Chloride Market Statistics, 2022-2032F
10.1. Market Size & Growth Outlook
10.1.1. By Revenues in USD Million
10.2. Market Segmentation & Growth Outlook
10.2.1. By Product Type- Market Insights and Forecast 2022-2032, USD Million
10.2.2. By Grade- Market Insights and Forecast 2022-2032, USD Million
10.2.3. By Form- Market Insights and Forecast 2022-2032, USD Million
10.2.4. By Raw Material- Market Insights and Forecast 2022-2032, USD Million
10.2.5. By Application- Market Insights and Forecast 2022-2032, USD Million
10.2.6. By Country
10.2.6.1. China
10.2.6.2. Japan
10.2.6.3. India
10.2.6.4. South Korea
10.2.6.5. Singapore
10.2.6.6. Malaysia
10.2.6.7. Australia
10.2.6.8. Thailand
10.2.6.9. Indonesia
10.2.6.10.Philippines
10.2.6.11.Rest of Asia Pacific
10.3. China Calcium Chloride Market Statistics, 2022-2032F
10.3.1. Market Size & Growth Outlook
10.3.1.1. By Revenues in USD Million
10.3.2. Market Segmentation & Growth Outlook
10.3.2.1. By Product Type- Market Insights and Forecast 2022-2032, USD Million
10.3.2.2. By Grade- Market Insights and Forecast 2022-2032, USD Million
10.3.2.3. By Form- Market Insights and Forecast 2022-2032, USD Million
10.3.2.4. By Raw Material- Market Insights and Forecast 2022-2032, USD Million
10.3.2.5. By Application- Market Insights and Forecast 2022-2032, USD Million
10.4. Japan Calcium Chloride Market Statistics, 2022-2032F
10.4.1. Market Size & Growth Outlook
10.4.1.1. By Revenues in USD Million
10.4.2. Market Segmentation & Growth Outlook
10.4.2.1. By Product Type- Market Insights and Forecast 2022-2032, USD Million
10.4.2.2. By Grade- Market Insights and Forecast 2022-2032, USD Million
10.4.2.3. By Form- Market Insights and Forecast 2022-2032, USD Million
10.4.2.4. By Raw Material- Market Insights and Forecast 2022-2032, USD Million
10.4.2.5. By Application- Market Insights and Forecast 2022-2032, USD Million
10.5. India Calcium Chloride Market Statistics, 2022-2032F
10.5.1. Market Size & Growth Outlook
10.5.1.1. By Revenues in USD Million
10.5.2. Market Segmentation & Growth Outlook
10.5.2.1. By Product Type- Market Insights and Forecast 2022-2032, USD Million
10.5.2.2. By Grade- Market Insights and Forecast 2022-2032, USD Million
10.5.2.3. By Form- Market Insights and Forecast 2022-2032, USD Million
10.5.2.4. By Raw Material- Market Insights and Forecast 2022-2032, USD Million
10.5.2.5. By Application- Market Insights and Forecast 2022-2032, USD Million
10.6. South Korea Calcium Chloride Market Statistics, 2022-2032F
10.6.1. Market Size & Growth Outlook
10.6.1.1. By Revenues in USD Million
10.6.2. Market Segmentation & Growth Outlook
10.6.2.1. By Product Type- Market Insights and Forecast 2022-2032, USD Million
10.6.2.2. By Grade- Market Insights and Forecast 2022-2032, USD Million
10.6.2.3. By Form- Market Insights and Forecast 2022-2032, USD Million
10.6.2.4. By Raw Material- Market Insights and Forecast 2022-2032, USD Million
10.6.2.5. By Application- Market Insights and Forecast 2022-2032, USD Million
10.7. Singapore Calcium Chloride Market Statistics, 2022-2032F
10.7.1. Market Size & Growth Outlook
10.7.1.1. By Revenues in USD Million
10.7.2. Market Segmentation & Growth Outlook
10.7.2.1. By Product Type- Market Insights and Forecast 2022-2032, USD Million
10.7.2.2. By Grade- Market Insights and Forecast 2022-2032, USD Million
10.7.2.3. By Form- Market Insights an
| Segment | Sub-Segment |
|---|---|
| By Product Type |
|
| By Grade |
|
| By Form |
|
| By Raw Material |
|
| By Application |
|
| By Region |
|
Research Methodology
This study followed a structured approach comprising four key phases to assess the size and scope of the electro-oxidation market. The process began with thorough secondary research to collect data on the target market, related markets, and broader industry context. These findings, along with preliminary assumptions and estimates, were then validated through extensive primary research involving industry experts from across the value chain. To calculate the overall market size, both top-down and bottom-up methodologies were employed. Finally, market segmentation and data triangulation techniques were applied to refine and validate segment-level estimations.
Secondary Research
The secondary research phase involved gathering data from a wide range of credible and published sources. This step helped in identifying industry trends, defining market segmentation, and understanding the market landscape and value chain.
Sources consulted during this phase included:
- Company annual reports, investor presentations, and press releases
- Industry white papers and certified publications
- Trade directories and market-recognized databases
- Articles from authoritative authors and reputable journals
- Gold and silver standard websites
Secondary research was critical in mapping out the industry's value chain and monetary flow, identifying key market segments, understanding regional variations, and tracking significant industry developments.
Other key sources:
- Financial disclosures
- Industry associations and trade bodies
- News outlets and business magazines
- Academic journals and research studies
- Paid industry databases
Primary Research
To validate secondary data and gain deeper market insights, primary research was conducted with key stakeholders across both the supply and demand sides of the market.
On the demand side, participants included decision-makers and influencers from end-user industries—such as CIOs, CTOs, and CSOs—who provided first-hand perspectives on market needs, product usage, and future expectations.
On the supply side, interviews were conducted with manufacturers, industry associations, and institutional participants to gather insights into current offerings, product pipelines, and market challenges.
Primary interviews provided critical inputs such as:
- Market size and revenue data
- Product and service breakdowns
- Market forecasts
- Regional and application-specific trends
Stakeholders consulted included:
- Leading OEM and solution providers
- Channel and distribution partners
- End users across various applications
- Independent consultants and industry specialists
Market Size Estimation and Data Triangulation
- Identifying Key Market Participants (Secondary Research)
- Goal: To identify the major players or companies in the target market. This typically involves using publicly available data sources such as industry reports, market research publications, and financial statements of companies.
- Tools: Reports from firms like Gartner, Forrester, Euromonitor, Statista, IBISWorld, and others. Public financial statements, news articles, and press releases from top market players.
- Extracting Earnings of Key Market Participants
- Goal: To estimate the earnings generated from the product or service being analyzed. This step helps in understanding the revenue potential of each market player in a specific geography.
- Methods: Earnings data can be gathered from:
- Publicly available financial reports (for listed companies).
- Interviews and primary data sources from professionals, such as Directors, VPs, SVPs, etc. This is especially useful for understanding more nuanced, internal data that isn't publicly disclosed.
- Annual reports and investor presentations of key players.
- Data Collation and Development of a Relevant Data Model
- Goal: To collate inputs from both primary and secondary sources into a structured, data-driven model for market estimation. This model will incorporate key market KPIs and any independent variables relevant to the market.
- Key KPIs: These could include:
- Market size, growth rate, and demand drivers.
- Industry-specific metrics like market share, average revenue per customer (ARPC), or average deal size.
- External variables, such as economic growth rates, inflation rates, or commodity prices, that could affect the market.
- Data Modeling: Based on this data, the market forecasts are developed for the next 5 years. A combination of trend analysis, scenario modeling, and statistical regression might be used to generate projections.
- Scenario Analysis
- Goal: To test different assumptions and validate how sensitive the market is to changes in key variables (e.g., market demand, regulatory changes, technological disruptions).
- Types of Scenarios:
- Base Case: Based on current assumptions and historical data.
- Best-Case Scenario: Assuming favorable market conditions, regulatory environments, and technological advancements.
- Worst-Case Scenario: Accounting for adverse factors, such as economic downturns, stricter regulations, or unexpected disruptions.


