Argentina Room Air Conditioners Market Report: Trends, Growth and Forecast (2026-2032)
By Product Type (Split Air Conditioners (Up to 9,000 BTU/h, 9,001-12,000 BTU/h, 12,001-18,000 BTU/h, 18,001-24,000 BTU/h, Above 24,000 BTU/h), Window Air Conditioners (Up to 9,000 BTU/h, 9,001-12,000 BTU/h, 12,001-18,000 BTU/h, 18,001-24,000 BTU/h, Above 24,000 BTU/h), Others), By Technology (Inverter, Non-Inverter), By Price (Up to USD 300, USD 301 to USD 600, USD 601 to USD 1,000, Above USD 1,000), By End User (Residential (Individual Households, Apartments/Condominiums, Vacation/Secondary Homes), Commercial (Offices, Retail Stores/Showrooms, Hospitality, Healthcare Facilities, Educational Institutions, Small Commercial Establishments, Others)), By Sales Channel (Retail Online (Brand-Owned Websites/D2C, E-Commerce Marketplaces), Retail Offline (Exclusive Brand Stores, Multi-Brand Electronics & Appliance Stores, Specialty Stores, Hypermarkets/Supermarkets, Home Improvement Stores, Dealer/Distributor Network, Direct Sales/Institutional Sales, Local Independent Retailers)), By Refrigerant Type (R-32, R-410A, R-290, R-454B, Others), By Connectivity (Smart/Connected, Conventional/Non-Smart), By Energy Efficiency (1 Star, 2 Star, 3 Star, 4 Star, 5 Star) ... Read more
|
Major Players
|
Argentina Room Air Conditioners Market Statistics and Insights, 2026
- Market Size Statistics
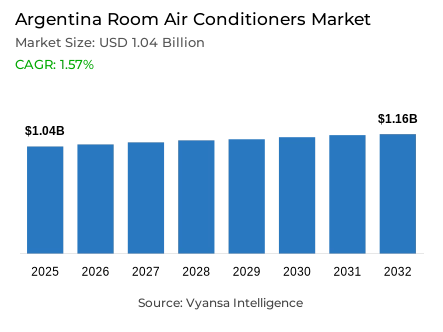
- Room air conditioners market size in Argentina was valued at USD 1.04 billion in 2025 and is estimated at USD 1.05 billion in 2026.
- The market size is expected to grow to USD 1.16 billion by 2032.
- Market to register a CAGR of around 1.57% during 2026-32.
- Product Type Shares
- Split air conditioners grabbed market share of 85%.
- Competition
- More than 10 companies are actively engaged in producing room air conditioners in Argentina.
- Top 5 companies acquired around 65% of the market share.
- Aires del Sur SA, TCL Corp, Robert Bosch GmbH, New San SA, BGH SA etc., are few of the top companies.
- Technology
- Inverter grabbed 55% of the market.
Argentina Room Air Conditioners Market Outlook
Argentina room air conditioners market size was valued at USD 1.04 billion in 2025 and is projected to grow from USD 1.05 billion in 2026 to USD 1.16 billion by 2032, exhibiting a CAGR of 1.57% during the forecast period. Growth remains steady as hotter weather continues to support cooling demand across households, while retail sales of air conditioners and climatizers already show solid traction in the country.
Demand remains supported by rising temperatures and stronger household cooling needs. Between January and October 2025, the country’s average temperature stayed above the 1991–2020 average, making that period the fourth warmest since 1961, while February 2025 records exceptionally warm conditions and more days above 40°C. In this setting, room air conditioners remain relevant for daily comfort, and higher electricity demand during warmer periods also reflects the stronger cooling use case across homes.
By product type, split air conditioners hold the leading share at around 85%, showing that demand remains heavily concentrated in this format. Their dominant position keeps them at the center of category performance and overall product movement. At the same time, running cost pressure remains important, as electricity and gas charges continue to rise, making consumers more careful about total ownership cost when buying room air conditioners for regular use.
By technology, inverter leads with around 55% share, showing a stronger market position than non inverter alternatives. This reflects growing attention to energy performance, as buyers increasingly compare products through a clearer efficiency framework. Official rules requiring minimum efficiency standards and visible energy labels in physical and digital catalogs further support this shift, helping efficient room air conditioners gain stronger visibility and consumer preference across Argentina.

Argentina Room Air Conditioners Market Growth DriverHotter Weather Keeps Cooling Needs Visible
Rising temperatures continue to support room air conditioner demand in Argentina. The Servicio Meteorológico Nacional says that between January and October 2025, the country’s average temperature stayed above the 1991–2020 average, making that period the fourth warmest since 1961. The same report says February 2025 was exceptionally warm, with national and local records and an elevated number of days above 40°C during intense heat events. This keeps cooling demand relevant across households and supports stronger need for room air conditioners in daily life.
Electricity demand data also reflects this pressure. Wholesale Electricity Market Administration Company (CAMMESA) reports that the average daily temperature in Greater Buenos Aires in January 2025 reached 26.3°C, which was 0.5°C above January 2024 and 1.7°C above historical values. During the same month, total national electricity demand at average levels rose 3.9% year on year. This points to a clear cooling use case for room air conditioners as hotter summer conditions lift household power demand.
Argentina Room Air Conditioners Market ChallengeUtility Costs Still Restrain Wider Adoption
Running cost pressure remains a key challenge for room air conditioners in Argentina. Electricity and gas charges continue to move upward, which makes consumers more careful about appliance purchases that add to monthly utility bills. For cooling products, this creates a more cautious buying environment, especially when households weigh not only the purchase price but also the cost of regular usage during hot periods.
Official price data supports this pressure. National Institute of Statistics and Censuses (INDEC) reports that the housing, water, electricity, gas and other fuels division rose 3.1% in September 2025 and 3.4% in December 2025. The national government also updated electricity and gas tariff tables in February 2025. These changes keep total ownership cost important in purchase decisions and can slow replacement or first time adoption for price sensitive buyers in the room air conditioners category.
Unlock Market Intelligence
Explore the market potential with our data-driven report
Argentina Room Air Conditioners Market TrendEfficiency-Led Buying Gains More Ground
Energy efficiency is becoming a clearer trend in Argentina’s room air conditioners market. Buyers increasingly have to compare products through a more visible efficiency framework, which is pushing attention toward models that can deliver cooling with better energy performance. This strengthens the role of technologies that are positioned around lower electricity consumption and more controlled operation in daily use.
Argentina’s official efficiency rules already support this shift. The government states that the minimum efficiency for air conditioners is A in cooling mode and C in heating mode, while the market now includes A+, A++, and A+++ categories. In addition, Resolution 438/2024, updated by Resolution 26/2025, requires manufacturers and importers to provide energy labels and include that information in physical and digital catalogs. This gives efficient technologies stronger visibility at the point of sale.
Argentina Room Air Conditioners Market OpportunityAppliance Recovery Opens More Upgrade Room
Retail activity is creating a clear opportunity for room air conditioners in Argentina. The latest official appliance trade data shows that consumers are already spending more on cooling products, which gives brands more room to expand through new launches, replacement demand, and better positioned premium models. This is especially relevant for formats and technologies that can combine stronger performance with visible energy efficiency benefits.
INDEC reports that in the fourth quarter of 2025, sales of air conditioners and climatizers reached ARS 288.8 billion, up 22.1% year on year, while 407,478 air conditioner units were sold, up 34.4%. In the first quarter of 2025, the same group recorded ARS 190.4 billion in sales, up 121.0% year on year. These figures show solid retail traction and create a stronger platform for further model expansion in Argentina.
Unlock Market Intelligence
Explore the market potential with our data-driven report
Argentina Room Air Conditioners Market Segmentation Analysis
By Product Type
- Split Air Conditioners
- Up to 9,000 BTU/h
- 9,001-12,000 BTU/h
- 12,001-18,000 BTU/h
- 18,001-24,000 BTU/h
- Above 24,000 BTU/h
- Window Air Conditioners
- Up to 9,000 BTU/h
- 9,001-12,000 BTU/h
- 12,001-18,000 BTU/h
- 18,001-24,000 BTU/h
- Above 24,000 BTU/h
- Others
The segment with the highest share under the product type is split air conditioners, holding around 85% of the Argentina room air conditioners market. This very high share shows that product demand remains heavily concentrated in split units and keeps this format at the center of the category. Its dominance also indicates that consumers continue to prefer this product type over other room air conditioner formats in the market.
Split air conditioners remain the clear lead segment because such a high share keeps them closely tied to the overall direction of product demand. With nearly nine tenths of the market, this segment continues to shape pricing, replacement demand, and overall category movement. The strong concentration in split units also suggests that room cooling demand in Argentina stays centered on this format across the market.

By Technology
- Inverter
- Non-Inverter
The segment with the highest share under the technology is inverter, accounting for around 55% of the Argentina room air conditioners market. This share keeps inverter technology in the leading position and shows that it has a stronger market presence than non inverter alternatives. Its lead also indicates that technology demand is increasingly centered on models that are associated with better operating efficiency in the category.
Inverter remains ahead as Argentina places more visibility on appliance energy performance. The government states that air conditioners must meet at least A efficiency in cooling mode, while higher classes such as A+, A++, and A+++ are also recognized. Energy labels must also appear in physical and digital product information, which supports stronger consumer focus on efficient room air conditioner technologies and helps keep inverter in the leading position.
List of Companies Covered in Argentina Room Air Conditioners Market
The companies listed below are highly influential in the Argentina room air conditioners market, with a significant market share and a strong impact on industry developments.
- Aires del Sur SA
- TCL Corp
- Robert Bosch GmbH
- New San SA
- BGH SA
- Hisense Group
- Midea Group Co Ltd
- Samsung Corp
- LG Corp
- Gree Electric Appliances Inc of Zhuhai
Market News & Updates
- Hisense Group, 2025:
Hisense Argentina introduced the Fresh Master room air conditioner to the local market. According to the company’s official Argentina platform, the product offers advanced features such as fresh-air intake of up to 40 m³/h, AI Smart functionality, R32 refrigerant, HEPA filtration, Wi-Fi/app control, and stable performance in challenging temperatures, including heating operation down to -15°C and cooling operation up to 45°C. This launch reflects Hisense’s focus on strengthening its premium room air conditioner portfolio in Argentina.
- Midea Group Co Ltd, 2025:
Midea Argentina organized a new product launch event with retail partners at Hilton Pilar. As stated on the company’s official Argentina website, the event highlighted Midea’s commercial strategies, new product lines, and marketing initiatives for the year. The company also indicated that additional home appliance line extensions would be introduced in the coming months. Since residential air conditioning remains one of Midea’s core categories in Argentina, this development represents an important step in reinforcing its market presence in the country’s room air conditioner segment.
Frequently Asked Questions
Related Report
- Market Segmentation
- Research Scope
- Research Methodology
- Definitions and Assumptions
- Executive Summary
- Argentina Room Air Conditioners Market Policies, Regulations, and Standards
- Argentina Room Air Conditioners Market Dynamics
- Growth Factors
- Challenges
- Trends
- Opportunities
- Argentina Room Air Conditioners Market Statistics, 2022-2032F
- Market Size & Growth Outlook
- By Revenues in USD Million
- By Units Sold in Thousand Units
- Market Segmentation & Growth Outlook
- By Product Type
- Split Air Conditioners- Market Insights and Forecast 2022-2032, USD Million
- Up to 9,000 BTU/h- Market Insights and Forecast 2022-2032, USD Million
- 9,001-12,000 BTU/h- Market Insights and Forecast 2022-2032, USD Million
- 12,001-18,000 BTU/h- Market Insights and Forecast 2022-2032, USD Million
- 18,001-24,000 BTU/h- Market Insights and Forecast 2022-2032, USD Million
- Above 24,000 BTU/h- Market Insights and Forecast 2022-2032, USD Million
- Window Air Conditioners- Market Insights and Forecast 2022-2032, USD Million
- Up to 9,000 BTU/h- Market Insights and Forecast 2022-2032, USD Million
- 9,001-12,000 BTU/h- Market Insights and Forecast 2022-2032, USD Million
- 12,001-18,000 BTU/h- Market Insights and Forecast 2022-2032, USD Million
- 18,001-24,000 BTU/h- Market Insights and Forecast 2022-2032, USD Million
- Above 24,000 BTU/h- Market Insights and Forecast 2022-2032, USD Million
- Others- Market Insights and Forecast 2022-2032, USD Million
- Split Air Conditioners- Market Insights and Forecast 2022-2032, USD Million
- By Technology
- Inverter- Market Insights and Forecast 2022-2032, USD Million
- Non-Inverter- Market Insights and Forecast 2022-2032, USD Million
- By Price
- Up to USD 300- Market Insights and Forecast 2022-2032, USD Million
- USD 301 to USD 600- Market Insights and Forecast 2022-2032, USD Million
- USD 601 to USD 1,000- Market Insights and Forecast 2022-2032, USD Million
- Above USD 1,000- Market Insights and Forecast 2022-2032, USD Million
- By End User
- Residential- Market Insights and Forecast 2022-2032, USD Million
- Individual Households- Market Insights and Forecast 2022-2032, USD Million
- Apartments/Condominiums- Market Insights and Forecast 2022-2032, USD Million
- Vacation/Secondary Homes- Market Insights and Forecast 2022-2032, USD Million
- Commercial- Market Insights and Forecast 2022-2032, USD Million
- Offices- Market Insights and Forecast 2022-2032, USD Million
- Retail Stores/Showrooms- Market Insights and Forecast 2022-2032, USD Million
- Hospitality- Market Insights and Forecast 2022-2032, USD Million
- Healthcare Facilities- Market Insights and Forecast 2022-2032, USD Million
- Educational Institutions- Market Insights and Forecast 2022-2032, USD Million
- Small Commercial Establishments- Market Insights and Forecast 2022-2032, USD Million
- Others- Market Insights and Forecast 2022-2032, USD Million
- Residential- Market Insights and Forecast 2022-2032, USD Million
- By Sales Channel
- Retail Online- Market Insights and Forecast 2022-2032, USD Million
- Brand-Owned Websites/D2C- Market Insights and Forecast 2022-2032, USD Million
- E-Commerce Marketplaces- Market Insights and Forecast 2022-2032, USD Million
- Retail Offline- Market Insights and Forecast 2022-2032, USD Million
- Exclusive Brand Stores- Market Insights and Forecast 2022-2032, USD Million
- Multi-Brand Electronics & Appliance Stores- Market Insights and Forecast 2022-2032, USD Million
- Specialty Stores- Market Insights and Forecast 2022-2032, USD Million
- Hypermarkets/Supermarkets- Market Insights and Forecast 2022-2032, USD Million
- Home Improvement Stores- Market Insights and Forecast 2022-2032, USD Million
- Dealer/Distributor Network- Market Insights and Forecast 2022-2032, USD Million
- Direct Sales/Institutional Sales- Market Insights and Forecast 2022-2032, USD Million
- Local Independent Retailers- Market Insights and Forecast 2022-2032, USD Million
- Retail Online- Market Insights and Forecast 2022-2032, USD Million
- By Refrigerant Type
- R-32- Market Insights and Forecast 2022-2032, USD Million
- R-410A- Market Insights and Forecast 2022-2032, USD Million
- R-290- Market Insights and Forecast 2022-2032, USD Million
- R-454B- Market Insights and Forecast 2022-2032, USD Million
- Others- Market Insights and Forecast 2022-2032, USD Million
- By Connectivity
- Smart/Connected- Market Insights and Forecast 2022-2032, USD Million
- Conventional/Non-Smart- Market Insights and Forecast 2022-2032, USD Million
- By Energy Efficiency
- 1 Star- Market Insights and Forecast 2022-2032, USD Million
- 2 Star- Market Insights and Forecast 2022-2032, USD Million
- 3 Star- Market Insights and Forecast 2022-2032, USD Million
- 4 Star- Market Insights and Forecast 2022-2032, USD Million
- 5 Star- Market Insights and Forecast 2022-2032, USD Million
- By Competitors
- Competition Characteristics
- Market Share & Analysis
- By Product Type
- Market Size & Growth Outlook
- Argentina Split Air Conditioners Market Statistics, 2022-2032
- Market Size & Growth Outlook
- By Revenues in USD Million
- By Units Sold in Thousand Units
- Market Segmentation & Growth Outlook
- By Technology- Market Insights and Forecast 2022-2032, USD Million
- By Price- Market Insights and Forecast 2022-2032, USD Million
- By End User- Market Insights and Forecast 2022-2032, USD Million
- By Sales Channel- Market Insights and Forecast 2022-2032, USD Million
- By Refrigerant Type- Market Insights and Forecast 2022-2032, USD Million
- By Connectivity- Market Insights and Forecast 2022-2032, USD Million
- By Energy Efficiency- Market Insights and Forecast 2022-2032, USD Million
- Market Size & Growth Outlook
- Argentina Window Air Conditioners Market Statistics, 2022-2032
- Market Size & Growth Outlook
- By Revenues in USD Million
- By Units Sold in Thousand Units
- Market Segmentation & Growth Outlook
- By Technology- Market Insights and Forecast 2022-2032, USD Million
- By Price- Market Insights and Forecast 2022-2032, USD Million
- By End User- Market Insights and Forecast 2022-2032, USD Million
- By Sales Channel- Market Insights and Forecast 2022-2032, USD Million
- By Refrigerant Type- Market Insights and Forecast 2022-2032, USD Million
- By Connectivity- Market Insights and Forecast 2022-2032, USD Million
- By Energy Efficiency- Market Insights and Forecast 2022-2032, USD Million
- Market Size & Growth Outlook
- Competitive Outlook
- Company Profiles
- New San SA
- Business Description
- Product Portfolio
- Collaborations & Alliances
- Recent Developments
- Financial Details
- Others
- BGH SA
- Business Description
- Product Portfolio
- Collaborations & Alliances
- Recent Developments
- Financial Details
- Others
- Hisense Group
- Business Description
- Product Portfolio
- Collaborations & Alliances
- Recent Developments
- Financial Details
- Others
- Midea Group Co Ltd
- Business Description
- Product Portfolio
- Collaborations & Alliances
- Recent Developments
- Financial Details
- Others
- Samsung Corp
- Business Description
- Product Portfolio
- Collaborations & Alliances
- Recent Developments
- Financial Details
- Others
- Aires del Sur SA
- Business Description
- Product Portfolio
- Collaborations & Alliances
- Recent Developments
- Financial Details
- Others
- TCL Corp
- Business Description
- Product Portfolio
- Collaborations & Alliances
- Recent Developments
- Financial Details
- Others
- Robert Bosch GmbH
- Business Description
- Product Portfolio
- Collaborations & Alliances
- Recent Developments
- Financial Details
- Others
- LG Corp
- Business Description
- Product Portfolio
- Collaborations & Alliances
- Recent Developments
- Financial Details
- Others
- Gree Electric Appliances Inc of Zhuhai
- Business Description
- Product Portfolio
- Collaborations & Alliances
- Recent Developments
- Financial Details
- Others
- New San SA
- Company Profiles
- Disclaimer
| Segment | Sub-Segment |
|---|---|
| By Product Type |
|
| By Technology |
|
| By Price |
|
| By End User |
|
| By Sales Channel |
|
| By Refrigerant Type |
|
| By Connectivity |
|
| By Energy Efficiency |
|
Research Methodology
This study followed a structured approach comprising four key phases to assess the size and scope of the electro-oxidation market. The process began with thorough secondary research to collect data on the target market, related markets, and broader industry context. These findings, along with preliminary assumptions and estimates, were then validated through extensive primary research involving industry experts from across the value chain. To calculate the overall market size, both top-down and bottom-up methodologies were employed. Finally, market segmentation and data triangulation techniques were applied to refine and validate segment-level estimations.
Secondary Research
The secondary research phase involved gathering data from a wide range of credible and published sources. This step helped in identifying industry trends, defining market segmentation, and understanding the market landscape and value chain.
Sources consulted during this phase included:
- Company annual reports, investor presentations, and press releases
- Industry white papers and certified publications
- Trade directories and market-recognized databases
- Articles from authoritative authors and reputable journals
- Gold and silver standard websites
Secondary research was critical in mapping out the industry's value chain and monetary flow, identifying key market segments, understanding regional variations, and tracking significant industry developments.
Other key sources:
- Financial disclosures
- Industry associations and trade bodies
- News outlets and business magazines
- Academic journals and research studies
- Paid industry databases
Primary Research
To validate secondary data and gain deeper market insights, primary research was conducted with key stakeholders across both the supply and demand sides of the market.
On the demand side, participants included decision-makers and influencers from end-user industries—such as CIOs, CTOs, and CSOs—who provided first-hand perspectives on market needs, product usage, and future expectations.
On the supply side, interviews were conducted with manufacturers, industry associations, and institutional participants to gather insights into current offerings, product pipelines, and market challenges.
Primary interviews provided critical inputs such as:
- Market size and revenue data
- Product and service breakdowns
- Market forecasts
- Regional and application-specific trends
Stakeholders consulted included:
- Leading OEM and solution providers
- Channel and distribution partners
- End users across various applications
- Independent consultants and industry specialists
Market Size Estimation and Data Triangulation
- Identifying Key Market Participants (Secondary Research)
- Goal: To identify the major players or companies in the target market. This typically involves using publicly available data sources such as industry reports, market research publications, and financial statements of companies.
- Tools: Reports from firms like Gartner, Forrester, Euromonitor, Statista, IBISWorld, and others. Public financial statements, news articles, and press releases from top market players.
- Extracting Earnings of Key Market Participants
- Goal: To estimate the earnings generated from the product or service being analyzed. This step helps in understanding the revenue potential of each market player in a specific geography.
- Methods: Earnings data can be gathered from:
- Publicly available financial reports (for listed companies).
- Interviews and primary data sources from professionals, such as Directors, VPs, SVPs, etc. This is especially useful for understanding more nuanced, internal data that isn't publicly disclosed.
- Annual reports and investor presentations of key players.
- Data Collation and Development of a Relevant Data Model
- Goal: To collate inputs from both primary and secondary sources into a structured, data-driven model for market estimation. This model will incorporate key market KPIs and any independent variables relevant to the market.
- Key KPIs: These could include:
- Market size, growth rate, and demand drivers.
- Industry-specific metrics like market share, average revenue per customer (ARPC), or average deal size.
- External variables, such as economic growth rates, inflation rates, or commodity prices, that could affect the market.
- Data Modeling: Based on this data, the market forecasts are developed for the next 5 years. A combination of trend analysis, scenario modeling, and statistical regression might be used to generate projections.
- Scenario Analysis
- Goal: To test different assumptions and validate how sensitive the market is to changes in key variables (e.g., market demand, regulatory changes, technological disruptions).
- Types of Scenarios:
- Base Case: Based on current assumptions and historical data.
- Best-Case Scenario: Assuming favorable market conditions, regulatory environments, and technological advancements.
- Worst-Case Scenario: Accounting for adverse factors, such as economic downturns, stricter regulations, or unexpected disruptions.


